


 nueva página del texto (beta)
 Inglés (pdf)
 Artículo en XML
 Referencias del artículo
 Enviar artículo por email
 Citado por SciELO
  Similares en
SciELO
Similares en
SciELO 
 Permalink
Introduction
An important component of water supply and vulnerability studies is quantifying groundwater recharge rates. Long-term safe yield and water management strategies require knowledge of recharge rates. However, recharge rate values are uncommon or difficult to specify because no methods can measure recharge directly. Furthermore, recharge rates are highly variable at both spatial and temporal scales as a consequence of several factors, such as geology, climate, and topography, which can lead to erroneous estimates. Therefore, it is necessary to employ tools that can evaluate the magnitude and spatial distribution of recharge rates, considering additional parameters that affect the hydrological system, which can be adjusted in later stages.
Using numerical flow models is one method to evaluate recharge rates and their spatiotemporal distributions objectively (Sanford, 2002). Numerical flow models are simulation tools that can represent the spatial and temporal variability of aquifer properties and the natural or artificial conditions of hydrogeological systems. Numerical models can be used to predict groundwater dynamics using hydraulic parameters (e.g., hydraulic conductivity and recharge) and boundary conditions (Bear & Cheng, 2010).
To obtain accurate predictions, numerical groundwater flow models must be calibrated. In the calibration process, also known as inverse modeling, it is looked for the minimization of the differences between the simulated (output) and observed (input) hydraulic head data using error statistics as the fitting criteria (Hill & Tiedeman, 2007). During the process, several combinations of hydraulic parameters (e.g., recharge and hydraulic conductivity) and boundary conditions are considered until an acceptable agreement between the simulated and observed heads is achieved (Batu, 2006). The calibration process can be accomplished manually (“trial-and-error”) or using mathematical optimization techniques. In the “trial-and-error approach, the user performs several combinations of parameters based on their knowledge, expertise, and predilection. In contrast, automatic processes utilize optimization techniques to minimize the residual heads in a global or local context until the fitting criteria are reached (Anderson et al., 2015).
The application of MODFLOW and HELP3 to estimate the spatial and temporal recharge distribution in the Pleasant Plain area of Dover Township, Ocean County, New Jersey, was studied by Jyrkama et al. (2002). Using daily precipitation and temperature records in conjunction with land use/land cover and soil data, it was developed a physically based and highly detailed boundary condition for groundwater modeling was developed from January 1970 to September 2000. The results showed that the combined use of a hydrological model (HELP3), a geographic information system (ArcView-GIS), and transient groundwater model (MODFLOW) improved not only model calibration but also simulated water table. The simulated water table is within 0.5 m of the observed values compared to that obtained using uniform recharge conditions with water levels varying as much as 2 m. Sensitivity analysis revealed that both the curve number and evaporative zone depth greatly influenced the groundwater recharge rates, whereas the leaf area index had a minor impact. The groundwater modeling program MODFLOW in conjunction with a geographic information system (MAPGIS), was used by Wang et al. (2008) to study the impact of recharge on the groundwater flow system in the North China Plain (NCP). MODFLOW and MAPGIS were integrated under the internet environment and applied to the NCP for the simulation period from January 2002 to December 2003. From the study period, it was inferred that the total recharge of the groundwater system was minor than the total discharge, thus exhibiting a budget deficit. The authors concluded that groundwater in the NCP was overexploited and had a severe crisis. It was also concluded that precipitation was the main recharge source, accounting for ~75 % of all recharge in 2002 and 2003, whereas evaporation was the main discharge, accounting for ~25 % of all recharge in 2002 and 2003 for the shallow aquifer. Artificial pumping is the major source of discharge in deeper aquifers of the NCP. The application of MODFLOW and the hybrid PSOLVER optimization algorithm to estimate groundwater recharge rates and zone structures on the Tahtalı Watershed was studied by Ayvaz & Elçi (2014). It was compared results of a finite-difference groundwater model adjusted by using PEST which considers hydraulic conductivity and recharge zone structures based on lithology and land use, against the same finite-difference model but using a Voronoi Tesselation of the studied domain and a global-local optimizer based on conjugate-gradient methods with penalty functions to constrain the simulation-optimization problem. The results shown that a six-zone structure solution was selected as best zone structure for the estimation problem, while calibration statistics were significantly improved by using the proposed methodology. MODFLOW, remote sensing, and satellite images were used to quantify the groundwater recharge in the Mosian aquifer system in western Iran by Ebrahimi et al. (2016). A steady-state numerical model in conjunction with land use map and irrigated area map were developed in 1991 to estimate the deep infiltration of water. The results of MODFLOW, remote sensing, and satellite images of Landsat TM indicated that groundwater recharge from rainfall and irrigation return occurred at a rate of 0.15 mm/day. Quantified groundwater recharge from rainfall was approximately 10 % of total rainfall. MODFLOW and HYDRUS-1D models were used to evaluate groundwater recharge and recharge flux in New Delhi, India (a semiarid region) by Dandekar et al. (2018). Using a variably saturated model (HYDRUS-1D) in various subareas, the daily recharge flux was obtained at the bottom of the unsaturated zone, which coincided with the uppermost boundary of the saturated zone. This water flux was taken as the recharge rate for simulation on MODFLOW to obtain groundwater recharge during the pre- and post-monsoon periods. These results suggest that evaporation is important in controlling recharge in semiarid regions. Approximately 61 % of rainfall (a major source of recharge) goes as evaporation (ET) whereas the average cumulative recharge flux was 31.28 % of the monsoon rainfall. If pumping conditions were maintained, net groundwater recharge would be 23 %, otherwise it would be approximately 30 % of the monsoon rainfall similar to the average cumulative recharge flux.
A groundwater flow model is commonly translated into mathematical terms using numerical methods, generally implemented through commercial software with ready-to-use graphical interfaces. However, most commercial packages lack additional tools for obtaining spatially distributed recharge-discharge patterns. Recharge or discharge rates are frequently considered just as fitting parameters, and the final user has no way to understand the process of getting these pattern distributions. Furthermore, spatially distributed recharge-discharge patterns using alternative modules require complicated additional modifications to the program’s code, which might be confusing and problematic for the final user. Therefore, it is necessary a simple and efficient numerical tool that can complement the use of conventional programs. Examples of this are spreadsheet programs (SSP). Programs based on spreadsheets are widely used, free, and can be employed to solve a wide diversity of engineering problems, such as evaluation of groundwater flow (Karahan & Ayvaz, 2005). User-friendly, numerical feedback, graphical visual interfaces, ease of programming, and real-time plotting are some of the main advantages of these tools. The objective of this study is to present the application of an SSP in conjunction with the mass-balance method to obtain recharge-discharge patterns in a Quaternary aquifer in northern Mexico. An SSP program was developed in conjunction with the mass-balance method to obtain recharge-discharge patterns corresponding to 2002 and 2014 years. A numerical groundwater flow model (MODFLOW) was constructed to evaluate the previously obtained recharge-discharge patterns, and each model was calibrated using UCODE. Two maps were prepared to observe the distribution of the recharge-discharge rates in the area. To assess the magnitude and spatial variation in the recharge-discharge patterns, it was necessary to perform a statistical analysis in order to conjecture on the spatial and temporal evolution of the recharge-discharge rates.
Study area
The Lagunera Region (101° 41’ and 104° 61’ W and 24° 59’ and 26° 53’ N) is located in the northern part of Mexico in the Coahuila and Durango states and forms part of the Chihuahuan Desert (Figure 1). It also includes the Nazas-Torreon, Aguanaval, Mayran, and Viesca basins. The Lagunera Region is surrounded by mountain ranges, which include the Jimulco Mountains to the southeast, the Noas Mountains to the south, the Mapimi and Sarnoso Mountains to the west, and the Campana, Tlahualilo, and Delicias Mountains to the north. The study area covers an approximate area of 5483 km2; the valley has elevations fluctuating around 1200 m above sea level (a.s.l), whereas surrounding mountain elevations fluctuate around 1500 m.a.s.l. Because of the rapid socio-economic development over the last decades, the population in Lagunera Region has grown from 700 000 in 1970 to approximately 1 500 000 inhabitants in 2010 (INEGI, 1970; 2010).

The Lagunera Region has annual temperatures varying from 4°C in winter to above 35°C during summer, with an average annual precipitation of 250 mm and an average annual evaporation of 2500 mm. Therefore, it is assumed that the main source of natural recharge entering the valley is lateral flow from the mountain front, underflow from adjacent aquifers, and irrigation return (CONAGUA, 2015). The principal localities are G. Palacio and Torreon in the southwest, F. Madero and Matamoros in the center, Tlahualilo and Bermejillo in the north, and E. Luis in the south.
The principal aquifer of the Lagunera Region is located in a valley filled with alluvial-lacustrine sediments forming an unconfined aquifer (CNA, 2003). It is located at the convergence of the tectonostratigraphic province Sierra Madre Oriental (SMO) and the granitic and metasedimentary basement high (horst), known as the Coahuila Block (Padilla y Sánchez, 1986; Goldhammer, 1999). The geological formations in the catchment area vary from Mesozoic to Quaternary (Figure 2). The Jurassic is represented by the Zuloaga, La Gloria, and La Casita formations constituted for limestones, sandstones, and evaporites with variable thicknesses. In contrast, the Cretaceous is represented by the Taraises, Cupido, La Peña, Acatita, Aurora, Cuesta del Cura, Indidura, and Caracol Formations, composed of sandstones, limestones, and lutites. The Cenozoic is represented by the Auichila Formation (conglomerates, mudstone, and tuff) from the Eocene and Oligocene granitic-dioritic intrusives. There are also Pliocene volcanic deposits that vary from rhyolites to basalts in outcrops to the north of S. Pedro (Tardy, 1972; Tardy et al., 1975; Padilla & Sánchez, 1986; Martínez, 1989; Goldhammer, 1999). Cretaceous formations and Quaternary alluvium are considered the most important aquifers. The second one has a variable thickness that varies from dozens (near mountains) to hundreds of meters (350-400 m) in the central parts of the valley (CNA, 1999). Because of clayey horizons, some areas east of the region may act as local aquitards (Ortega, 2003).

The Nazas and Aguanaval are the main rivers in the endoreic alluvial-lacustrine basin, and their contributions are used mainly in agricultural activities. The Nazas River, of perennial regime, has a longitude of 580 km and is formed at the confluence of the Ramos and Sextin rivers. Its approximate annual flow of 1300 × 106 m3 is controlled by the Lazaro Cárdenas Dam (El Palmito), which has a capacity of 2873 × 106 m3, and the Francisco Zarco Dam, which has a capacity of 309 × 106 m3. It also has five diverting dams, Santa Rosa, Calabazas, Coyote, Cuije, and San Fernando. The Aguanaval River has an approximate longitude of 500 km and is formed by the Sain Alto and Trujillo Rivers. Their approximate annual flow of 120 × 106 m3 is controlled by the Santa Rosa Dam (14 × 106 m3), Leobardo Reynoso Dam (118 × 106 m3), and Cazadero Dam (26.8 x 10⁶ m3) (CONAGUA, 2014).
The main types of soils in the area are Xerosoles and Litosoles. Of the total cultivable area, 80 % comprises forage (alfalfa) and corn (CONAGUA, 2010). According to Rodríguez et al., 2014, the estimated volumes of annual extraction during 2002 were 1088 × 106 m3, 1028 × 106 m3 in 2003, 1222 × 106 m3 in 2009, and 1788 × 106 m3 in 2013, with an average annual recharge of 518.9 x 10⁶ m3. The main uses of groundwater extraction volume are: 81.20 % agriculture, 11.61 % urban-public, 2.34 % domestic, 2.23 % livestock, 1.72 % industrial, 0.67 % service, and 0.21 % multiple uses (CNA, 2003). During 2015, potable water demand was satisfied at 98.43 % for the urban sector and 89.35 % for the rural sector (CONAGUA, 2018).
Estimation of water-budget
The water-budget method helps to determine changes in groundwater storage over time by using significant components that directly influence inflows and outflows to the hydrogeological system (Healy, 2010). It has been used in several practical studies to obtain changes in storage and determine components that are difficult to estimate by other methods (Zaidi et al., 2007; Skrzypek et al., 2016). Accordingly, in the case of Lagunera Region the main water-budget components are shown in Table 1.
Methodology
Distribution of recharge-discharge patterns
In general, the groundwater flow equation can be derived by using Darcy´s law and the continuity equation for a representative elementary volume (REV), often a cube, where hydraulic properties are assumed to be constant (Yeh et al., 2015). Thus, for steady-state conditions through an anisotropic, heterogeneous, two-dimensional porous media the groundwater flow equation can be expressed as:
Where:
h = hydraulic head.
Kx , Ky = principal components of the hydraulic tensor in the x and y directions, respectively.
W = source/sink term (Anderson et al., 2015).
Analytical solutions of Equation (1) are uncommon; it is customary to employ approximated solutions provided by numerical methods. Numerical methods can be used to solve the equations describing groundwater flow and solute transport. There are several numerical methods in the literature; however, one of the most widely used is the finite-difference method (Batu, 2006). In the finite-difference method, the studied domain is discretized into a group of cells (subareas), and partial derivatives are substituted by the fraction obtained between the differences in head values with respect to separation at the central nodes. Once the domain is discretized, and according to Figure 4, if contributions from all adjacent cells are considered, the total net inflow rate to a cell can be expressed using the SSP and Darcy´s Law as follows (Figure 3).


Figure 4 A map showing the finite differences grid over the study area, well locations and numerical model outline
In steady-state conditions, Equation (3) accounts for the recharge-discharge flow rates into a cell; thus, applying Equation (3) to all cells will produce a spatial distribution of the recharge-discharge patterns (Stoertz & Bradbury, 1989; Lin et al., 2009). Additionally, using the same established units, external flow rates, such as pumping or vertical recharge, can be added to Equation (3). Vertical recharge (QN) is frequently derived from additional models, such as the water budget (Healy, 2010). The Water-budget is often applicable at the basin or local scales using time-averaged components such as precipitation (P), irrigation return (Ir), and lateral flows (QL). Using the general water balance principle, changes in groundwater storage in the study area can be expressed as:
where P is precipitation, Ir means irrigation return, QLi is lateral inflow, QLo represents lateral outflow, ET is evapotranspiration, QB refers to pumping, and ΔS refers to changes in storage over time (Şen, 2015). However, because of intensive pumping in the study area, important changes in the natural flow regime have occurred, reducing lateral outflows and causing a thick unsaturated zone and, consequently, a deep-water table (Table 1). Because the water table is profound, there is no evapotranspiration/evaporation process to account for; thus, the term ET in Equation (4) can be ignored. Therefore, considering steady-state conditions, the water budget can be expressed as follows:
In this way, the corresponding fraction of the resulting value of natural recharge can be added to each cell to account for the total input flow to a cell or group of cells. The final expression considering the total flow into a cell can be finally written as:
Conceptual model
The conceptual model was defined according to existing geological data, cross-sections, and bore-hole data obtained from the archives of the National Water Commission and a field campaign. The finite-difference numerical method was the selected algorithm to evaluate the recharge-discharge patterns in the Lagunera Region. The Model Muse-graphical user interface for MODFLOW-2005 version 4.3.0.0 was chosen for the simulation process (Winston, 2019). The modular finite-difference model of the US Geological Survey, MODFLOW-2005 (Harbaugh, 2005), was applied to perform the analysis of recharge-discharge patterns and the numerical simulation of the hydrogeological system. This code has been used to evaluate recharge in several studies producing acceptable results to implement water management policies (Ayvaz & Elçi, 2014; Siade et al., 2015; Knowling & Werner, 2016).
The conceptualization process is based on the distribution of materials according to the local geology. Because the main aquifer is located in granular materials and there are no confining layers on top of the domain, the model was conceptualized as unconfined. Based on the cross-sections and lithological logs, the domain was conceptualized as a variable-thickness double-layer model. Additionally, all side domains were conceptualized as head-dependent boundary conditions to represent the inflows and outflows to the hydrogeological system. Recharge, discharge and pumping were simulated using a specified-flux boundary condition. Because of the lack of geological or hydrologic evidence regarding the hydrologic conditions that impede flow into or out of the hydrological system, it was unnecessary to consider a no-flow boundary condition. The bottom surface of the domain (approximately 300 m below the surface) was specified as a no-flow boundary. At this depth, and because there is no reliable information, it is assumed that there is no upward flow effect from deeper layers; therefore, the groundwater flow was considered essentially horizontal.
GIS-layers containing observation data (hydraulic head) and input parameters (hydraulic conductivity and recharge-discharge) were created for model construction and calibration. The aquifer hydraulic parameter assignment was based on the local geology and data availability. The spatial distribution of the hydraulic head was determined by universal kriging. Hydraulic conductivity values were obtained from pumping tests on the ancient river pathway near the main cities and towns. The initial recharge-discharge values were obtained from the water-budget and the procedure previously described. Additionally, because majority of water volume from rivers is used in agricultural activities, it was considered as a part of the irrigation return flow in the water-budget evaluation (Table 1). For analysis, a grid system was developed to cover the study domain. A uniform square grid with 103 columns and 130 rows containing cells with an area equivalent to 1 km2 produced a total of 13390 cells, of which only 5381 were active (Figure 4). Based on the pumping test, it was determined that transmissivity values vary from 8.64 × 10⁻⁵ to 8.11 × 10⁻³ with an average value of 1.77 × 10⁻³ m2/s from the north toward the central part of the study area. Storage coefficient varies from 1.245 × 10⁻² to 9.936 × 10⁻³ (CNA, 1999).
Numerical simulation and model calibration
Once the conceptual model of the study area was established, it was implemented using the MODFLOW software. The initial numerical values and corresponding interval values considered for each parameter used in the model setup and calibration are presented in Table 2. Additionally, a grid system was developed based on grid dimensions during the conceptualization process. The starting hydraulic head values were assumed to be between the bottom of the top layer and the reliable land surface elevation data. Then, MODFLOW was prepared to be executed under steady-state conditions. Initially, the layer property flow (LPF) package was used to define the properties that control the flow between cells, such as hydraulic conductivity, vertical and horizontal anisotropy, and layer geometry. A necessary condition for executing MODFLOW is specifying the type of boundary. According to the conceptual model of the study area, a main package was used to specify boundaries, the General-Head Boundary (GHB) package. The General-Head Boundary package is used to simulate the head-dependent flux boundaries. In the General-Head Boundary package, the flux is simulated as a proportional difference in the head. Finally, to compare the model outputs, three different solvers were used: the Strongly Implicit Procedure (SIP) package, the preconditioned conjugate-gradient (PCG) package, and the Direct Solver (DE4) package. The SIP package uses only the outer iterations. The PCG package uses both inner and outer iterations. The DE4 package uses inner or outer iterations, but not simultaneously (Harbaugh, 2005).
Table 2 Key parameters used for the calibration process
| Parameter | Interval | Starting value | Observations | |
|---|---|---|---|---|
| Hydraulic conductivity (m/s) |
1.0×10⁻⁶ to 3.5×10⁻⁵ |
1.1×10⁻⁶ | Values based on transmissi- vities calculated from pum- ping test data and literature values |
|
| Conductance (m2/s) | 2.1×10⁻⁶ to 4.2×10⁻⁵ | 2.50×10⁻⁶ | Consistent with horizontal hydraulic conductivity and the existent lithology in the area |
|
| Recharge/Discharge rates (m3/s) |
2002 | 2014 | ||
| -2.0×10⁻⁶ to 2.51×10⁻⁸ |
-8.0×10⁻⁸ to 2.1×10⁻⁸ |
-2.01×10⁻⁶ to 3×10⁻⁸ |
Values based on the applied procedure |
The universal inverse modeling computer code UCODE was employed in the calibration process (Poeter et al., 2005). The ModelMate-graphical user interface for UCODE-2005 version 1.0.3 was selected for calibration (Banta, 2011). UCODE applies nonlinear regression to parameter estimation by minimizing a weighted least-squares objective function using a modified Gauss-Newton method. First, transmissivities computed from pumping test data in granular media were used to obtain consistent hydraulic conductivity estimates according to granular materials and a literature review (CONAGUA, 2015). After that, it was also necessary to adjust the recharge values obtained with the proposed procedure. During the calibration process, the hydraulic conductivities of the two model layers were first calibrated, followed by the recharge values. This was done to avoid an undesirable correlation effect between recharge and hydraulic conductivity. Finally, according to the conceptual model, the main outflow in the aquifer is because of pumping, which is also the main cause of inversion in natural flow (CNA, 1999; CONAGUA, 2015); therefore, only lateral inflows were simulated using the general-head boundary (GHB) condition. Accordingly, during the calibration process, the conductances were also adjusted according to the geological material and boundary geometry.
To ensure an effective calibration process, it was necessary to identify a group of parameters that can satisfactorily reproduce field observations, whereas minimizing the root-mean-squared residual head (Anderson et al., 2015). The established target was ± 1 for the hydraulic head data to obtain a steady-state calibration. In total, 124 observed hydraulic head data points from the wells were used to calibrate the steady-state model within the target for both years.
Results and discussion
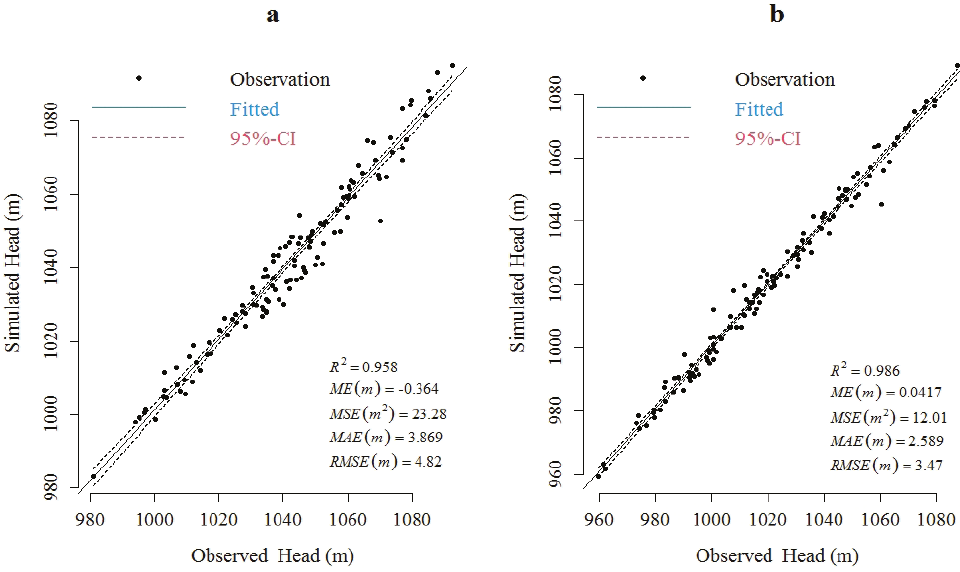
The calibrated model results for 2002 and 2014 are shown in Figure 5. As can be noted, the calibration plots indicated a good correlation coefficient between the hydraulic head and model-simulated data for both years. Additionally, the calibration process was evaluated using many statistical indices, such as the mean error (ME), mean absolute error (MAE), and root-mean-square error (RMSE), where the error (E) is represented as the difference between the observed and model-simulated head. In both cases, the root-mean-square error (RMSE) was minimal, which suggests that the models can adequately reproduce the local hydrogeological conditions.
The contour maps of the simulated hydraulic heads for 2002 and 2014 are shown in Figure 6. It can be noted from Figure 6 that groundwater levels are not uniformly distributed in the study area. The simulated hydraulic head contours exhibited a general decline throughout the domain. As shown in Figure 6, low groundwater levels are predominant in the central parts of the domain, which appear to coincide with the agricultural areas (north of Esmeralda, northwest of F. Madero, east of Torreon, and between Matamoros and E. Luis). The nearest neighbor analysis of pumping-well locations indicates that the observed mean distance is approximately 562.34 m, whereas the expected mean distance is 1056.39 m with the nearest neighbor index of 0.53 and a z-score of -43.05 which suggests that in the central parts of the domain, the concentration of pumping wells is high (~ 6 wells/km2). Furthermore, a visual inspection of Figures 3 and 6 indicates a spatial correlation between the cones of depression and the pumping-well locations. Figure 6b, which corresponds to 2014, also exhibits a similar geometry to that of Figure 6a, where equipotential lines decline toward the central and southern areas; however, groundwater-level contours are even lower than those obtained from 2002, and the cones of depression appear to be wider than those from figure 6a. This might be result from the fact that groundwater abstraction during the study period has change in a significant way to induce changes in groundwater flow pattern, and that groundwater outputs might not have been effectively compensated for by inputs to the hydrological system. Model results indicate that the average pumping during 2002 was approximately 492.85×10⁶ m3 and during 2014 was 423.44×10⁶ m3, which are 10.4 % and 0.18 % larger than the water budget, respectively. Additionally, an analysis of average annual rainfall data from climatic monitoring stations located in the surrounding sub-basins showed a general descending trend in rainfall amounts during the period 1970-2015, with a considerable period of low rainfall amounts from 1991 to 2001 followed by a recovery period 2002-2008 and an important diminution of registered rainfall during 2008-2013 which also suggests that the apparently low groundwater levels may be in response to the general low replenishment from precipitation during this decade (Figure 7). Information analysis of pumping-well locations and rainfall data suggests that the apparently low groundwater-level contour distribution corresponding to 2002 and 2014 may be in response to groundwater abstraction and generally low rainfall amounts, which might lead to considerable changes in groundwater flow patterns.

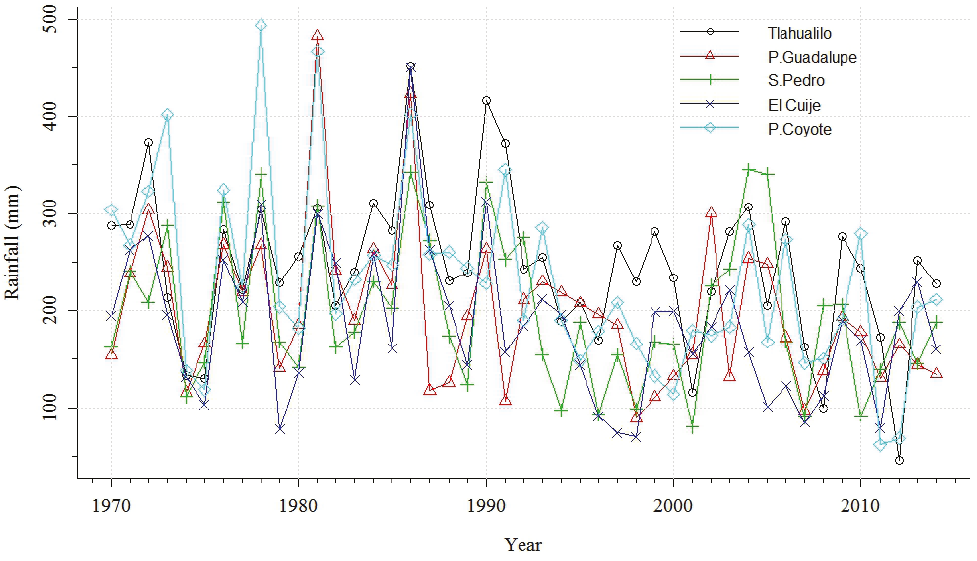
On the other hand, it can also be appreciated from Figure 6 that high groundwater levels are distributed principally on the periphery of the study area, principally from west-northwest areas (Mapimí, Bermejillo, and Sarnoso Mountains) and from the eastern areas (north of San Lorenzo Mountains) being coincident in a location with Tlahualilo, S. Pedro, El Cuije and P. Guadalupe climatic monitoring stations and where rainfall reports from this monitoring stations show an increase for the 2000 year. The groundwater-level contour distribution also indicates that inflows coming from surrounding mountains to the south and east are different than those coming from siliciclastic material in the northern areas, as was analyzed by the head-dependent boundary condition managed in the GHB package. Furthermore, agricultural activity is limited in these areas, and pumping wells are scarce (~1 wells/km2); as a consequence, pumping activity is not intensive or even null. Therefore, the observed trends in the groundwater-level contour distribution result from the effects of rainfall trends in conjunction with the groundwater abstraction regime, which highly influences groundwater-recharge patterns. Although direct vertical recharge from precipitation and irrigation returns plays an important role in the aquifer replenishment (jointly representing 32.12 % in 2002 and 29.33 % in 2014), model results suggest that main inflows become from lateral boundaries as were calculated by using GHB conditions (67.87 % in 2002 and 70.66 % in 2014). This might be because groundwater levels are profound, resulting in a thick unsaturated zone (an average of 76.6 m deep) which complicates replenishment from direct vertical recharge.
The resulting spatial distributions of the recharge-discharge rate values for 2002 and 2014 are shown in Figure 8. It can be appreciated that recharge-discharge rates values for 2002 were not uniformly distributed in the study area. Discharge rate values were distributed in an approximate area of 2427.8 km2 representing approximately 44.27 % of the studied domain, with an average rate of -2.11×10⁻⁹ m3/s. Similar to the case of the groundwater-level distribution for 2002, this spatial pattern also corresponds with agricultural areas in central zones where pumping wells are abundant. In contrast, recharge rate values represent an approximate area of 3055.2 km2 (55.72 %) with an average rate of 1.69×10⁻⁹ m3/s. They are mainly distributed around the studied domain where agricultural activities are non-intensive and pumping-well location is scarce, as in the groundwater-level contour distribution shown in Figure 6. This suggests a narrow relationship concerning the groundwater-level distribution, pumping-well abstraction, and recharge-discharge rate values.

The spatial distribution of the recharge-discharge rate values corresponding to 2014 is shown in Figure 8b. Regarding the spatial distribution of discharge rate values, it can be noted that they represent an approximate area of 2596.0 km2 (47.34 % of the studied domain), an increase of 3.76 % percent regarding the last reviewed year with an average rate of -1.41×10⁻⁸ m3/s. On the contrary, recharge rate values (average rate of 1.28×10⁻⁸ m3/s) are represented by an area of 2887.0 km2 (52.65 %), a decrease of 5.5 % regarding to 2002. This may be related to the reduction of 14.08 % in the estimated average pumping rates during the studied period. This estimated average pumping rate differs significantly from earlier findings of CNA (1999); CONAGUA, (2010; 2015) and (Dorjderem et al., 2020) by up to 5 0% less. Data scarcity, temporal changes and parameter uncertainty might have been important factors influencing the assessment of the pumping rates. The results also suggest that the spatial distribution of recharge-discharge rates might be because the proposed procedure is highly influenced by groundwater-level distribution which in turn are influenced by pumping and replenishment conditions, where vertical recharge appears not to be the dominant process.
To analyze whether there were significant changes in the recharge-discharge rate pattern distribution between 2002 and 2014, a statistical matched-pair sign test was performed for the difference in recharge-discharge rate values in each model cell using the signmedian.test R package (v1.5.1; Yeyun & Yang, 2015) implemented in R Statistical Software version 4.1.2 (R Core Team, 2021). Adopted null hypothesis establishes no significant changes in the recharge-discharge values throughout the analyzed period. Table 3 summarizes the sign test results. The nonparametric sign test is considered adequate for analyzing temporal changes in recharge-discharge values because the differences between the paired samples neither follow a normal distribution nor exhibit symmetry. The confidence interval test on the median of the difference between the two datasets concluded that the decrease in recharge-discharge values from 2002 to 2014 was between -3.146068 ×10⁻⁹ and 3.413747×10⁻⁹ m3/s at 95 % confidence. These results also suggest the need to implement regulatory policies for groundwater abstraction. Adapting groundwater abstraction based on safe yield is a priority to preserve the hydrological system and its dependent populations.
Conclusions
This study applies a spreadsheet program with the mass-balance method to estimate the recharge-discharge rate pattern distribution and its evolution for an alluvial aquifer in the Lagunera Region, Mexico. An SSP program was developed to obtain recharge-discharge patterns, and its results were analyzed using inverse numerical models for 2002 and 2014. The analysis and results indicate that the recharge-discharge patterns are not uniformly distributed in the study area, being discharge predominant in the central parts, whereas recharge is dominant in the surrounding areas. According to the numerical results, groundwater flow has changed its natural evolution from the surrounding areas toward the central parts of the study area, coinciding with agricultural areas. The nonparametric sign test also showed decreased recharge-discharge values from 2002 to 2014. These results suggest the necessity of adapting pumping rates to a safe yield in the main aquifer of the Lagunera Region to preserve the hydrogeological system and its dependent populations.

