


 nova página do texto(beta)
 Inglês (pdf)
 Artigo em XML
 Referências do artigo
 Enviar este artigo por email
 Citado por SciELO
  Similares em
SciELO
Similares em
SciELO 
 Permalink
Introduction
Humanity has used tents since ancient times. The skin of the well-known traditional tents, like Indian tepees, the widespread used yurts, or the Nomad’s black tents, were made of animal hides and woven materials like wool and canvas since ancient times (Hungtington, 2013; Bahamon, 2004). The traditional tent construction and the development of industrial textiles in the second half of the XXth century were the basis of the application of membrane structures in modern architecture.
Membrane structures are thin-walled flexible structures with very small self-weight; the applied pre-tensioning system governs their shape and stability. Membrane structures are beneficial for covering large areas without significant internal support (Kröplin, 2005). Compared with conventional structures composed of concrete or steel, the efficiency in construction time and material resources is better in the case of membrane structures.
Since the approximately 1 mm thick membrane can not carry compressive force, the whole surface must be pre-tensioned to provide the load-bearing capacity of the structure. Based on the method of pre-stressing, membrane structures can be categorized into different groups: tensioned (Figure 1a), air-supported (Figure 1b), and air-inflated (Figure 1c). Tensioned membrane structures are pre-stressed with forces around the membrane edges using edge cables or internal supports like masts, rings, or internal cables. The pre-stress in either air-supported or air-inflated membrane structures is given by the pressure of the enclosed air. In the first case, the whole covered space is closed, people can get in and out through special entrances. In the latter case, only the inflated walls of the structure must be closed; the covered space can be open. Either a tensioned membrane or a pneumatic structure, the pre-tensioning system should guarantee to avoid the loss of pre-stress in the membrane during its lifespan, which is necessary to avoid wrinkling and fluttering of the membrane (Lewis, 2018).
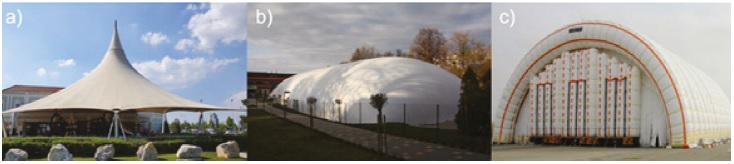
Figure 1 The classification of membrane structures is based on the pre-tensioning system: a) tensioned, b) air-supported, and c) air-inflated structures
The design and structural analysis of membrane structures is quite unusual compared to conventional buildings. The design process of tensile structures should include methods for determining the shape of equilibrium considering the mechanical material behavior and the pre-tensioning process (Wagner, 2005).
According to Hincz (2000), the design procedure of membrane structures incorporates four step-by-step stages: a) form-finding, b) cutting pattern generation, c) determination of the construction shape, and d) structural analysis. Hincz introduced the design steps for tensioned membranes, although they are also valid for pneumatic structures with some minor modifications. The first design step is the form-finding; it provides the 3D shape that fulfills the architectural requirements. The cutting pattern generation means transforming the 3D shape into 2D panels for manufacturing the fabric strips, which, after being welded together and pre-stressed or inflated (depending on the type of structure), gives the surface of the membrane. The third analysis step is the determination of the construction shape, the equilibrium shape of the tensioned membrane. It relates to the definition of the boundary conditions, the cutting pattern stripes, the fiber directions in the surface, the orthotropic material properties, and the internal pressure in the case of pneumatic structures. The final step is the structural analysis, calculating the membrane forces, reaction forces at the supports, and the displacements according to different external loads. The most common external loads are wind and snow. Wind loads are based on pressure coefficients on the structure surface.
One of the most challenging parts of the structural analysis of membranes is determining the wind forces on the structure. The design codes give the wind speed that should be used during the analysis considering the current location of the structure and the pressure coefficients of simple shapes like rectangular prisms, cylinders, or planar roofs with different geometry. Nevertheless, the codes neither provide the pressure coefficients for the anticlastic surfaces of tensioned membranes nor the synclastic shapes of inflated structures. For example, the EN 13782 (2005) gives general pressure coefficients for anticlastic surfaces for two load cases. Load case 1 means suction on the whole surface with a constant pressure coefficient equal to -0.7, whereas load case 2 means positive pressure over the entire surface with a constant value of +0.3. Although it is quite a rough approximation, it is often used during the design of small structures with anticlastic shapes. In the case of the design of larger structures, the pressure coefficients can be determined with expensive and time-consuming wind tunnel tests, Computational Fluid Dynamics (CFD) calculations, or applying available data of structures with similar geometry.
The lack of information given by the different design codes motivated researchers to determine the wind load on different doubly curved tensile surfaces. Kawamura & Kiuchi (1986) analyzed air-supported domes. The pressure coefficients were determined on rigid models, and the behavior of the membrane was investigated with flexible models. Canavesio and Natalini (1999) obtained pressure coefficients on the textile roof of a stadium with a circular plan subjected to three different wind directions. Rizzo et al. (2011, 2012) presented experimental pressure coefficient maps of hyperbolic paraboloid tensile roofs of buildings with rectangular, squared, and circular plans. The pressure coefficient maps were compared with the general pressure coefficients given by the Eurocode for flat roofs. Gamboa et al. (2011, 2013) and Sun et al. (2020) analyzed the wind load on arch-supported tensile roofs. Viskovic (2018) gave the mode pressure coefficient maps of hyperbolic paraboloid roofs for three wind directions. Sun et al. (2019) presented the wind tunnel-based pressure coefficient fields of membrane structures pre-stressed by ridge- and valley cables.
The determination of the pressure coefficients is commonly based on rigid models; however, the large deformations of the membrane can change the flow around the structure and the wind load itself. Hincz & Gamboa (2015) presented a method for the determination of the effect of the membrane deformation on the pressure coefficient fields and the membrane forces. Besides the determination of pressure coefficients by wind tunnel tests, nowadays numerical methods can be also applied. Balbastro and Sonzogni (2012); and Amaya et al. (2021) carried out numerical simulations on curved roofs and they validated their results by wind tunnel measurements.
The current paper introduces the wind tunnel results of an air-inflated structure. The research aimed to determine and compare the pressure coefficient fields on the membrane structure based on the variation of a) wind direction and b) the differences between an enclosed structure versus an open-sides structure. The main discussion included the comparison between the external pressure coefficients of the enclosed building and the open structure.
Development
Wind tunnel
The primary device used in this research was the open-circuit wind tunnel located at the Autonomous University of Yucatan, Mexico (Figure 2). The wind tunnel has a 1.5 m - long test area with a cross-section of 1 m². In the current research, a uniform wind flow was considered without generating the Atmospheric Boundary Layer (ABL) profile. This can be associated with a structure in a Terrain Category 0 or I according to EN 1991-1-4 (2005) and CFE (2020), respectively.
The analyzed model
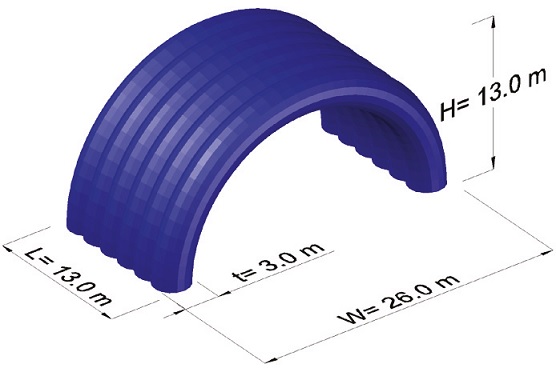
The research aimed to obtain the pressure coefficients of an air-inflated membrane structure composed of six circular arches. The prototype structure dimensions (Figure 3) are 13.0 m height and length, and 26.0 m width. The inflated arches have a diameter of 3 m.
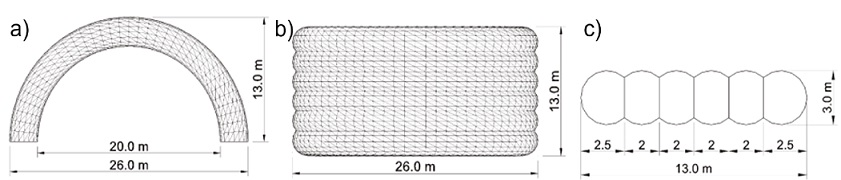
Figure 3 Dimensions of the prototype structure: a) front view, b) top view, and c) cross-section of the inflated walls
The equilibrium shape of the inflated membrane was determined by the Dynamic Relaxation Method (DRM), which is a step-by-step method developed by Day, 1965. DRM is often used for the form-finding and static analysis of different tensile structures (Barnes, 1988; Hegyi et al., 2006; Lengyel & Hincz, 2019). The synclastic surface of the inflated membrane was approximated by a network of planar, triangular surface elements during the form-finding. A linear and orthotropic material was considered with the same modulus of elasticity in mutually perpendicular fiber directions (warp and fill). The warp fiber direction was assumed to be parallel with the centerline of the inflated arches. The applied material properties were: E w =E f =400 kN/m, G=10 kN/m, vwf=vfw=0.3. The pressure in the tubes was 25 mbar during the form-finding procedure. Figure 4 shows the inflated equilibrium shape of the numerical model.
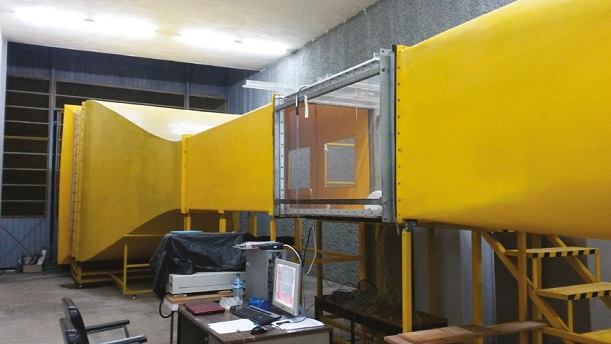
After the form-finding, the equilibrium shape of the inflated but unloaded membrane was 3D printed. The material used by the 3D printer was Polylactic Acid (PLA), with a layer thickness of 0.25 mm and a hatch filling ratio of 15 %. The two side walls were 3D printed with similar characteristics but as independent parts. Figure 5 shows photos of the model with and without side walls.

Considering that the blockage ratio required for wind tunnel experiments should not be higher than 10 % of the cross-section testing area (Meseguer, 2001), the selected geometric scale was 1:72.5, which allowed a proper study in the considered wind directions with a maximum blockage ratio of 5 %. Hence, the height and length of the model were 17.93 cm, and its width was 35.86 cm (Table 1).
Table 1 Geometry dimensions of the prototype structure and the model
| Geometric scale ratio 1:72.5 | Dimensions | |||
| Prototype | Model | |||
| Length | 1,300 | cm | 17.93 | cm |
| Height | 1,300 | cm | 17.93 | cm |
| Width | 2,600 | cm | 35.86 | cm |
| Free height | 1,000 | cm | 13.79 | cm |
| Free-span width | 2,000 | cm | 27.59 | cm |
| Diameter of tubes | 300 | cm | 4.14 | cm |
The next step in the modeling was to determine the distribution of the pressure taps. There were nine measurement points on every arch; the angle between the adjacent measurement points on the same arch was 10°. The pressure taps were composed of two parts, the sensor allocated at the measurement holes on the model surface and the tube which connects the sensor to the pressure transducer. Since the pressure taps were conducted through the arches wall, one hole with two diameters was drilled at every measurement point; the smaller diameter was used for the pressure tap itself (sensor) and the larger one, for the tube on the opposite side of the current arch. According to the model symmetry, measurement holes were drilled on two opposite quarters of the model (Figure 5c). It means that three arches were modeled to measure the pressure on the external surface, and the other three were used to measure the internal pressure. This arrangement was considered to measure both external and internal pressures on the structure.
By proper rotation of the model in the wind tunnel, the 27 external and 27 internal measurement points provided pressure values in 102 points on each, the external and the internal sides of the model for every wind direction. On the one hand, this density of the measurement points enables a smooth interpolation between the measured pressure values, as well as there is a convenient distance between the measurement points to fit the pressure taps. Besides the measurement points on the external and internal surfaces of the inflated arches, there were 15 measurement points on each side-wall, which resulted in altogether 54 pressure values on the two side-walls.
The pressure taps were installed into the model in groups during the tests. The groups of active taps were selected to minimize the disturbance of the flow by the tubes around the active taps. Therefore, the measurements of external and internal pressures were not recorded simultaneously.
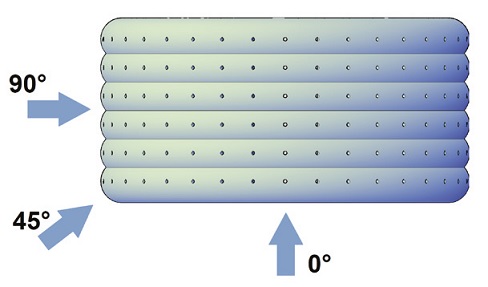
Both cases of the model (with and without end-walls) were analyzed in three wind directions 0°, 45° and 90°. The wind directions are measured from the structure’s central axis (Figure 6).
The pressures were recorded using a pressure scanner Esterline 9116, which can take up to 16 simultaneous measurements. As a control technique, all the tests were repeated at least three times, improving the validity of the results. The sampling time for each test was 120 seconds, and the sampling frequency was 10 Hz.
It is usual to refer all pressure values measured on a structural surface to the mean dynamic pressure
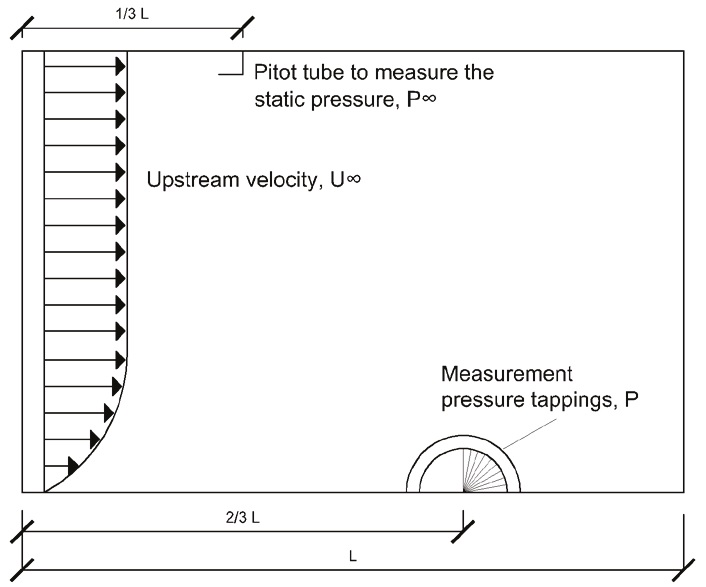
where p is the local pressure in a specific point on the structure surface detected by the pressure tap, p ∞ is the nominal undisturbed free stream static pressure, p is the density of air, and U∞ is the velocity of the undisturbed flow at a reference point distant from the model. These non-dimensional values make it possible to transfer the experimental model results to the full-scale structure (prototype) to present the aerodynamic properties of the given geometric shape. During the experiments, the value p - p ∞ for each point was measured by the pressure scanner in Pa and the mean wind velocity (U∞) was obtained in m/s using a Pitot tube. For the calculation of the pressure coefficients, standard air conditions with p = 1.23 kg/m3 density was considered. The setup of the experiment with the model and the Pitot tube can be seen in Figure 7.
A sensitivity analysis was carried out before all the experiments; this included the evaluation of the velocities, sampling frequency, and time length, which contributed to register the stabilization of the flow turbulence around the model. In the sensitivity analysis, speeds between 15-20 m/s were considered, but the conclusions were that velocities above 19 m/s would give steady pressures. Then, the applied velocities in all tests were 17, 19, 21, and 23 m/s to verify that in all directions 19 m/s was the lower boundary velocity to register stabilized pressures. This criterion of ±2 m/s was determined just to evaluate if there could be any significant difference when the wind speed changes. This way it was verified that pressure coefficients recorded with wind velocities equal or higher than the lower boundary velocity were above the transition gap of the Reynolds number and thus independent of its value (stabilized turbulence region). The Reynolds number defined in Equation (2) is a non-dimensional parameter which indicates the relation between the inertial and the viscous forces (Simiu & Yeo, 2019).
where p and U are the density and velocity of the air, respectively and their values were defined in previous paragraphs. The air viscosity (μ) was set up to 1.79e-5 kg/(m-s). Meanwhile, the characteristic length (L) was adopted according to each wind direction. The corresponding Reynolds number in each direction is presented in Table 2.
Table 2 Reynolds number according to the different wind directions
| Direction | Velocities | Characteristic Length (m) |
|||
| 17 (m/s) | 19 (m/s) | 21 (m/s) | 23 (m/s) | ||
| 0° | 3.04E+07 | 3.39E+07 | 3.75E+07 | 4.11E+07 | 26.0 |
| 90° | 1.52E+07 | 1.70E+07 | 1.88E+07 | 2.05E+07 | 13.0 |
| 45° | 2.15E+07 | 2.40E+07 | 2.66E+07 | 2.91E+07 | 18.4 |
Figure 8 shows the pressure coefficients for different wind speeds and the average values for the current wind directions and side-wall conditions. In these diagrams, the Cp values are presented in two sets of points, A) on the external and internal surface of the arches in the symmetry plane parallel with the main axis, B) on the external and internal surface of the two central arches; either set A or B are also visualized in Figure 8. Table 3 presents the mean percentage difference with respect to the average Cp obtained for each side condition case and every wind direction. The mean percentage differences reported in Table 3 were computed based on Equations (3) and (4):
where Cp was the resulting average pressure coefficient, Cp 19, Cp 21, and Cp 23 were the pressure coefficients obtained when the wind speed was 19, 21, or 23 m/s. The percentage difference for each point at a certain velocity was obtained by:
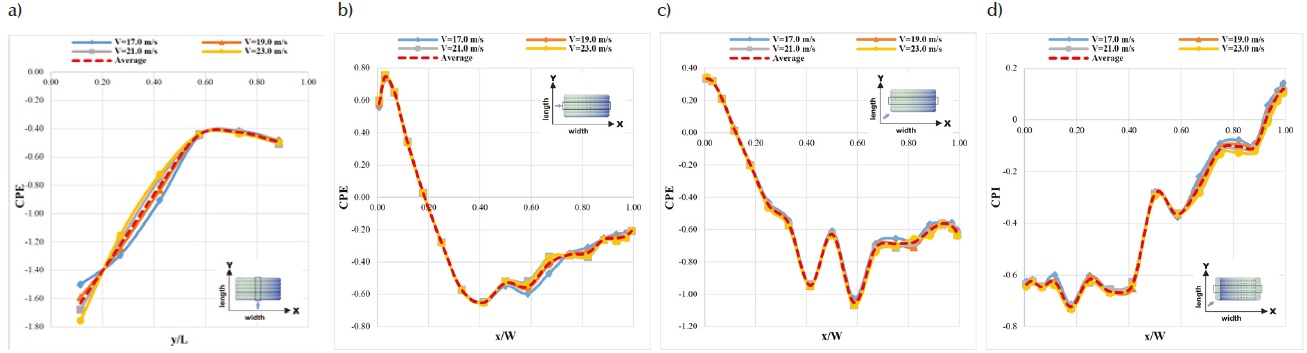
Figure 8 Mean Cp for the enclosed structure: a) 0° wind direction, point set A, b) 90° wind direction, point set B. Also, for the case of the open sides, 45° wind direction, point set B, c) mean external, and d) mean internal Cp
Table 3 Mean percentage difference versus the average
| Side condition case/ wind direction |
Side of the surface/ Point set |
Mean percentage difference |
| Enclosed/90° | External / point set B | 2.0 % |
| Enclosed/0° | External / point set A | 2.3 % |
| Enclosed/45° | External / point set B | 1.6 % |
| External / point set A | 0.9 % | |
| Open sides/90° | External / point set B | 0.8 % |
| Internal / point set B | 1.2 % | |
| Open sides/0° | External / point set A | 2.3 % |
| Internal / point set A | 6.0 % | |
| Open sides/45° | External / point set B | 1.3 % |
| Internal / point set B | 4.0 % | |
| External / point set A | 0.5 % | |
| Internal / point set A | 1.9 % |
Then the mean percentage difference was the average resulting from applying Equation (4) to all the points included in each configuration set (A or B). In most of the measurement points, the results showed that the wind speed had a minor effect on the Cp, which meant that the turbulence wake around the model was stabilized.
Discussion and results
Pressure coefficients
In this section, the mean pressure coefficient (Cp) distribution on the external and internal surfaces of the inflated membrane and the end-walls is discussed. The following nomenclature is referred to in the figures: CPE and CPI, which mean External Pressure Coefficient and Internal Pressure Coefficient, respectively. Implicitly CPI values were presented only for open sides case (model without side walls). Furthermore, CPN refers to Net Pressure Coefficient. Evidently, for the enclosed structure, CPE is the same as CPN, but for the structure without end-walls, CPN refers to the sum of the mean external and internal pressures. The mean Cp‘s presented in this section was calculated as the average of the reported data from the three wind speeds mentioned above. All the graphics in this section have been plotted with the same color scale to compare the different cases easily. In the case of symmetric cases (wind directions 0° and 90°), the pressures were measured only on half of the surface; the color Cp maps were prepared by taking into account symmetry.
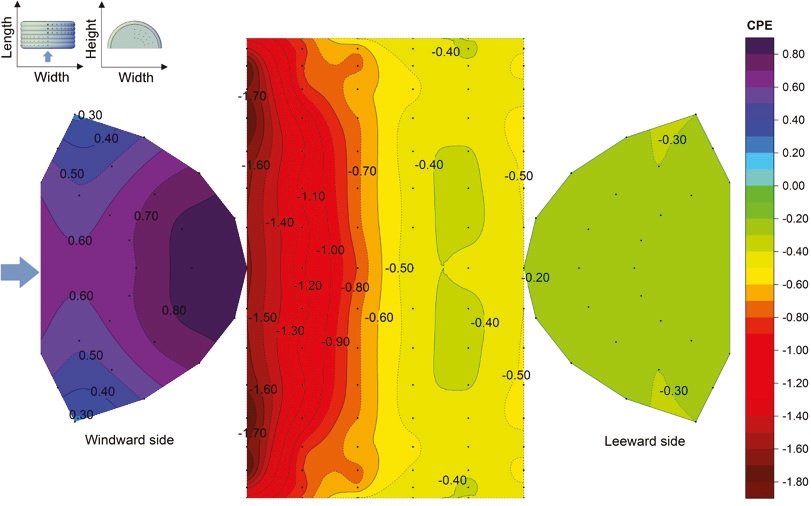
Enclosed structure, 90° wind direction
Figure 9 depicts the CPE on the whole membrane surface for the enclosed building with the flow perpendicular to the main central axis (90°). Both side-walls are parallel with the incoming flow; that is why there is wind suction only with CPE between -0.37 and -0.17. The Cp absolute values decrease from the windward to the leeward side. On the surface of the inflated arches, both positive and negative Cp’s were obtained between -0.76 and 0.75. As it was expected, the largest compression was at the windward side, close to the ground level, while on the top and leeward side, only suction was detected, with the minimum CPE values close to the top. It is important to recall that the fluid detachment on circular shapes has a strong relationship with the Reynolds number (Simiu & Yeo, 2019). So, because of the turbulence developed around the model, it was the mid-central part where the flow separation took place. In this research the Reynolds number was not calculated but with the applied velocities it could be seen that the flow detachment for velocities over 19 m/s was approximately at the same location.

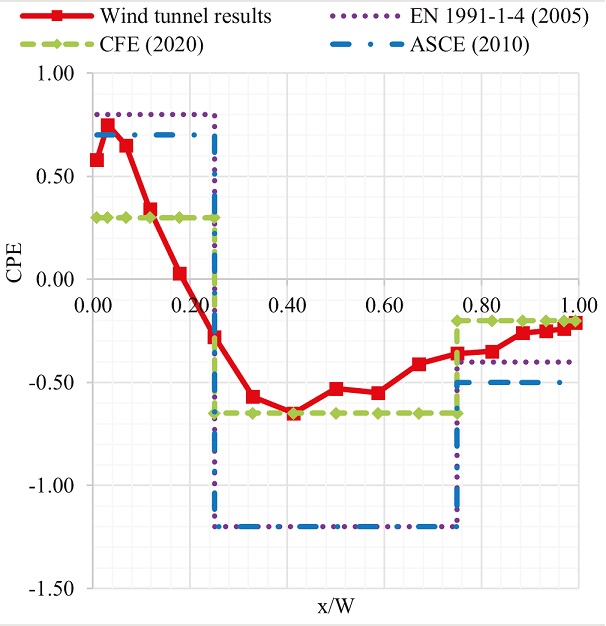
To validate the CPE results in this direction, Figure 10 depicts the standard CPE given in the EN 1991-1-4 (2005), CFE (2020), and ASCE (2010) for circular cylindrical roofs with a rectangular plan. The presented line refers to points set B. The experimental curve follows a similar tendency as the values established in the codes. In the middle of the model, the experimental results underestimated the values given by the codes. The European and American standards provide conservative parameters in the whole suction area and on the positive pressure zones. However, the CFE (2020) only does it on the separation zone, meanwhile it underestimates the wind effects on the pressure zones.
Enclosed building, 0° wind direction
For this condition, the wind was parallel with the central axis of the structure. Figure 11 shows the CPE on the whole membrane surface. The windward end-wall blocked the incoming flow, which resulted in relatively high positive Cp between 0.28 and 0.86. Simultaneously, wind suction appeared on the leeward end-wall with almost constant Cp between -0.30 and -0.27. On the inflated arches, only negative pressures were detected; the largest wind suction appeared along the first arch, and the absolute Cp magnitudes decreased along the length. The reported CPE varied between -1.81 and -0.37. Unfortunately, the EN 1991-1-4 (2005) does not include any CPE for curved roofs in this direction, but there are some researchers who have been developing wind tunnel tests on curved roofs subjected to different wind directions and considering various geometric ratios (Natalini et al., 2013; Blackmore & Tsokri, 2006). Both CFE (2020) and ASCE (2010) provide constant CPE for the whole surface, which depends on the geometric ratios of the structure. In this case, CFE (2020) included two cases with constant CPE equal to -0.90 and -0.40. At the same time, ASCE (2010) also provides two cases with values of -0.90 and -0.18. The worst case should be applied in the wind analysis.
Enclosed building, 45° wind direction
Figure 12 shows the CPE on the membrane surface obtained in the 45° wind direction. Compression was detected on most of the windward end-wall; the Cp varied from -0.06 to 0.62. Meanwhile, there was wind suction on the whole leeward wall, and the Cp range was from -0.72 to -0.50. On the surface of the inflated arches, there were wind suction and compression also. The largest positive pressure coefficient (0.41) was detected at the windward corner, close to the ground level. At the same time, the most significant wind suction appeared close to the top of the first arch at the windward side, caused by strong flow separations. The lowest pressure coefficient was -1.17.
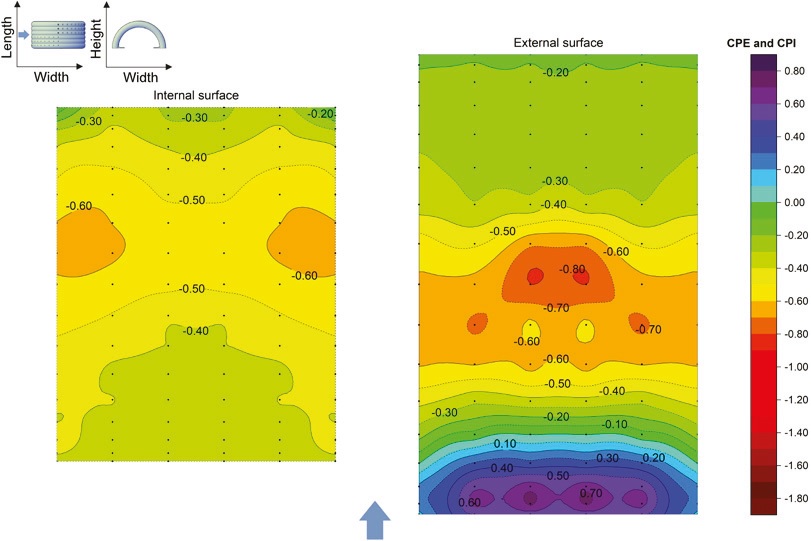
Open sides case, 90° wind direction
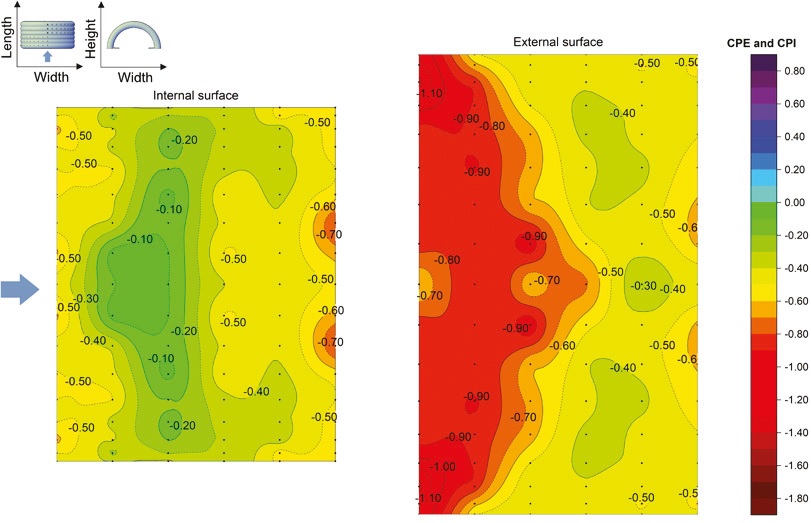
In the case of open sides, the pressure was also measured on the internal surface of the inflated arches. Figure 13 shows both CPI and CPE for 90° wind direction. The pressure distribution on the external surface was similar to the enclosed case. The maximum CPE (0.73) was detected at the windward side, close to the ground level, while the minimum CPE (-0.80) was detected close to the top of the structure. As abovementioned, for the given geometry, the flow separation point depends on fluid regimes. In the case of fully developed turbulence around the model, the fluid separation took place at the mid-central part of the model. On the internal surface, all CPI values were negative; they varied between -0.64 and -0.04. The lower CPI values were detected close to the top of the model.
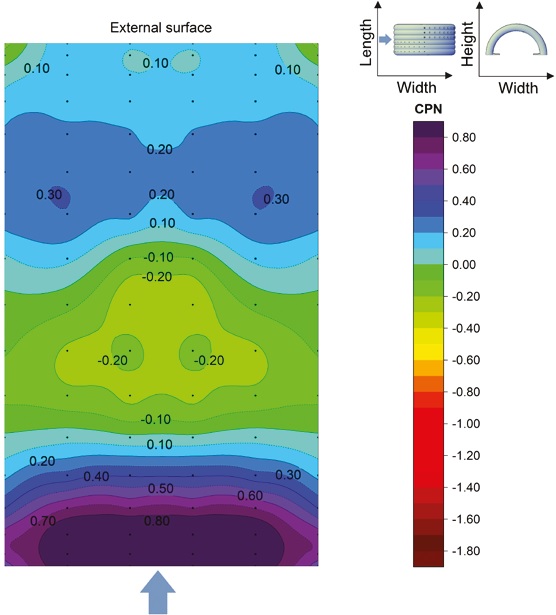
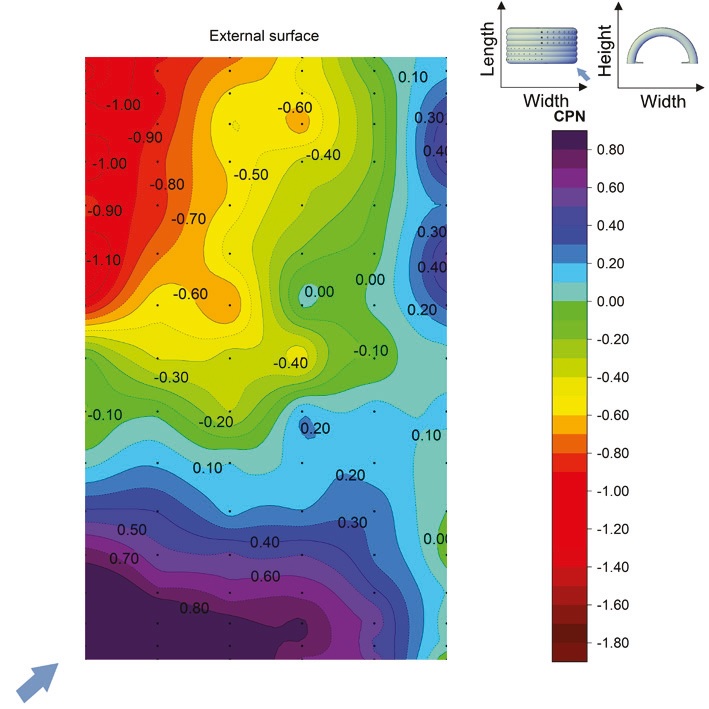
For 90° wind direction, the CPN (Figure 14) varied between -0.27 to 1.11. The positive pressures on the lower part of the windward side were induced by the addition of the mean external pressure and internal suction. Furthermore, on the leeward side, the magnitude of the mean internal suction was larger than the magnitude of the mean external suction, resulting in positive CPN, except for small areas at the corners. The mean external suction in the model central zone was larger than the mean internal suction, resulting in negative CPN.
Open sides case, 0° wind direction
In the 0° wind direction, all the CPE and CPI were negative (Figure 15). The magnitude of the wind suction on the external surface decreased from the windward to the leeward zone; CPE varied between -1.23 and -0.30. The CPI on the internal surface varied from -0.79 to -0.07. The minimum value was detected on the last arch at the leeward side of the model.
The CPN map for 0° wind direction is presented in Figure 16. The maximum CPN was 0.18, while the minimum was -0.86. The positive CPN values were obtained in the leeward area; this represented that the mean suction was higher on the internal than on the external surface. Meanwhile, the CPN values were negative in the windward zone because the mean external suction was higher than the internal one.

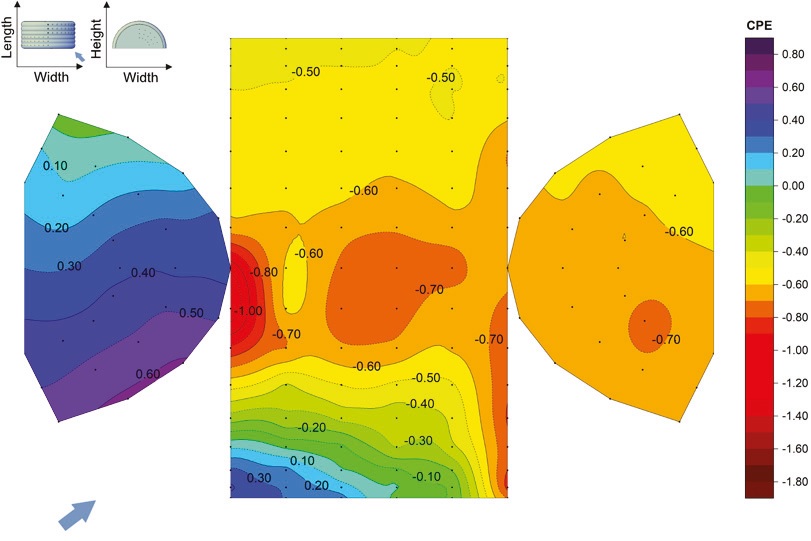
Open sides case, 45° wind direction
The Cp maps on the external and internal surfaces of the model are presented in Figure 17. On the inner surface, the obtained CPI varied between -1.20 and 0.60; it is important to recall that this was the only case with positive CPI. The maximum and minimum CPI were found on the first and last arch, respectively. The maximum was located close to the ground level. On the external surface, both the minimum and maximum CPE were found on the first arch; the CPE range was from -1.39 to 0.77.

The CPN values for the 45° wind direction are presented in Figure 18. Those CPN varied between -1.28 and 1.36. The maximum wind pressure was detected at the windward corner close to the ground level because of mean external pressure and internal suction. At the same time, the largest suction was detected close to the opposite support of the same arch due to the mean internal pressure and external suction.
Enclosed and open sides cases comparison
External Pressure Coefficients (CPE) and Net Pressure Coefficients (CPN)
In the 90° wind direction, the wind was parallel with the side walls so, they did not mean a significant blockage between the upcoming wind and the external surface of the inflated arches. Figure 19a presents the CPE and CPN measured in point set B for the current flow direction. The distributions and the magnitudes of the CPE are similar to the values obtained in the open sides case; however, on a relatively small area at the central part of the model, the CPE values were higher for the open sides structure. The largest differences were detected at the top of the structure where the CPE obtained on the open structure was 1.5 times the CPE measured on the enclosed structure (-0.80 versus -0.53, respectively). The positive CPN values at the windward side are larger in the case of the open structure. Also, the absolute magnitudes of the negative CPN values are larger for the enclosed structure. Thus, the minimum CPN on the enclosed building was -0.65 while on the structure without end-walls was -0.27.
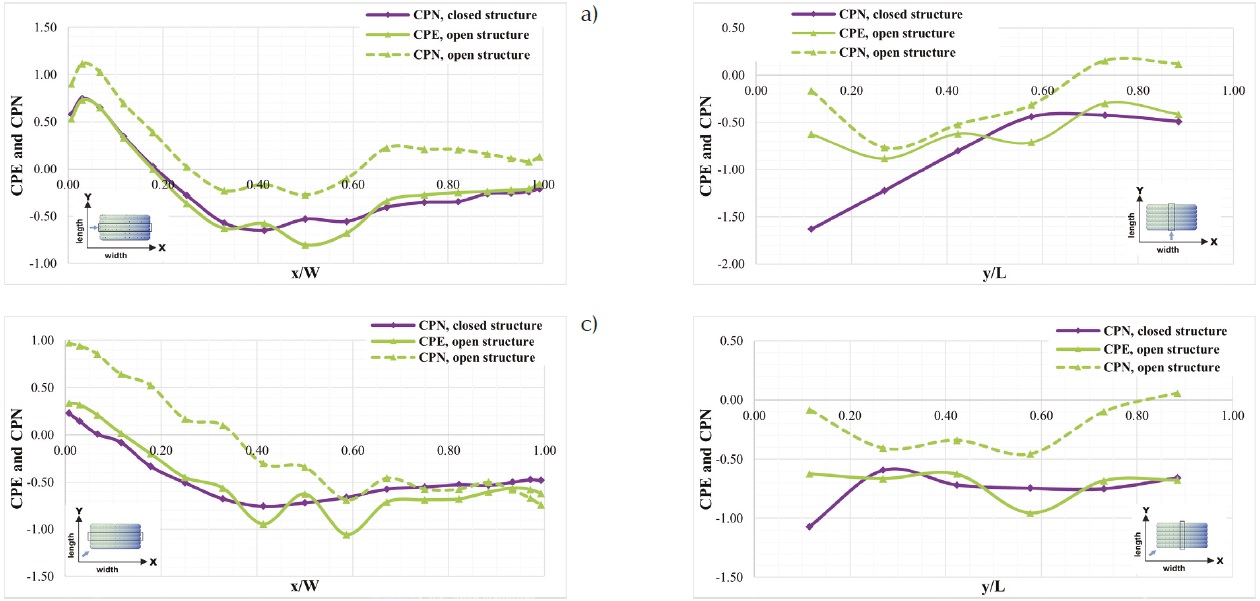
Figure 19 CPE and CPN, a) 90° wind direction, point set B; b) 0° wind direction, point set A; and 45° wind direction, c) point set B, and d) point set A
When the upcoming wind direction was 0°, the windward end-wall of the closed structure meant a significant obstruction, and it had a substantial effect on the flow separation. Figure 19b presents the CPE and CPN obtained in point set A for this direction. Nevertheless, the diagram also shows that the maximum difference could be detected at the top of the first arch, where the magnitude of the CPE is more than two times larger for the enclosed condition than in the case without end-walls: -1.63 versus -0.62, respectively. So, the CPE on the open sides condition only represents 40 % of the CPE on the enclosed structure. The CPN values are significantly larger in the case of the enclosed model, especially on the windward side of the surface. For example, the CPN on the first arch for the enclosed and open model were -1.63 and -0.17, respectively; this means that the CPN obtained on the open structure only represents approximately 10 % of the one measured on the enclosed structure.
Figures 19c and d present the CPE and CPN for 45° wind direction in point sets B and A, respectively. Similarly to the 0° wind direction, on the surface of the first arch, the negative pressure coefficients are significantly smaller if the windward end-wall blocks the flow. In most of the points presented in Figure 19c and d, the CPE followed the same flow pattern in both end-walls conditions (closed and open). However, Figure 19d shows that the CPE measured on the first arch was larger for the closed structure case than the one obtained on the structure without end-walls (-1.07 versus -0.62, respectively). It can be stated that the negative CPN values are more significant on the enclosed structure; however, the positive CPN values are larger on the open structure. Figure 19c depicts that the maximum CPN on the enclosed model only represents the 24 % of the CPN obtained on the open sides building: 0.23 versus 0.97, respectively. This supports the idea about considering the analysis of openings in the structures and how they could affect the global wind forces.
Conclusions
The model of an air-inflated membrane structure composed of six circular arches was analyzed with and without end-walls. The pressure coefficient distributions were determined by wind tunnel experiments for three wind directions. A uniform wind flow was applied corresponding to a terrain category zero. All tests were repeated for four different wind speeds to verify that the turbulence wake around the model was stabilized.
The pressure coefficients were presented, in the case of the enclosed model, on the external surface of the inflated arches and the end-walls, and, in the case of the open model, on the external and internal surfaces of the arches. The net pressure coefficients of the open model were also calculated by considering the mean pressures on the external and internal surfaces.
Based on the comparison of the external pressure coefficient distributions on the surface of the inflated arches, it can be stated that:
A) When the wind was parallel with the main axis of the structure (0° wind direction), the blockage of the wind by the windward end-wall had a significant effect on the flow and the pressure coefficients. The lowest negative pressure coefficient value was 47 % smaller (-1.81 versus -1.23) when compared with the model without end-walls. In the case of the enclosed model, the windward end-wall had a significant role in the strong flow separation.
B) For the 90° and 45° wind directions, the end-walls had a much less significant effect (5 % and 17 % differences, respectively) on the external pressure coefficients when compared with the case of the open sides.
Based on the comparison of the net pressure coefficients of the open-sides model with the external pressure coefficients of the enclosed structure, it can be stated that:
A) In the case of 0° wind direction, the magnitude of the lowest negative net pressure coefficient value was 52 % smaller (-0.86 versus -1.81) when compared with the external (also net) pressure coefficients of the closed structure.
B) In the case of 90° and 45° wind directions, the largest positive net pressure coefficients were 48 % (1.11 versus 0.75) and 132 % (1.36 versus 0.41) larger, respectively, when compared with the external (also net) pressure coefficients of the enclosed model. The largest positive net pressure was the result of the addition of a large mean pressure on the external and suction on the internal surfaces of the open model. This means that for these wind directions the open sides structure could be the one that gives the largest positive wind forces on the structure. This supports the idea to integrate the CPI values on the structures because as it can be seen, sometimes it could be the most adverse situation. Unfortunately, CPI are not always given in the codes.
The introduced experimental results can be used during the determination of the wind load on inflated structures with similar shapes and geometric ratios. The presented Cp maps extended with the results of further wind tunnel experiments of similar structures with different geometric ratios can be the basis of a future design code for the wind analysis of inflated structures.

