


 nueva página del texto (beta)
 Inglés (pdf)
 Artículo en XML
 Referencias del artículo
 Enviar artículo por email
 Citado por SciELO
  Similares en
SciELO
Similares en
SciELO 
 Permalink
Introduction
Seismic methods carry out the geophysical characterization of the mechanical properties of the subsoil. In the first meters of depth, seismic refraction is widely used to determine the velocities of compressive waves (Vp) and the thicknesses of shallow layers. The examination depth is limited by the presence of the higher velocity layer (in addition to the acquisition design), which may be of particular interest if its mechanical properties (velocities and elastic modules) classify it as the substratum. The seismic reflection method provides a better definition of the subsurface Vp structure; however, acquisition and processing are more expensive (Yilmaz, 2015). The characterization of the substratum allows to:
Establish the parameters of the foundation design.
Determine the local amplification effects for seismic microzonification purposes.
Detect the presence of the impermeable layer in shallow aquifer studies.
Establish the depth of study for the characterization of the Critical Zone (Brantley et al., 2006).
The subsoil exploration is also carried out by spectral analysis of surface waves produced during seismic surveys (active methods). The methods traditionally used are MASW (Park et al., 1999; Xia et al., 1999) and SASW (Nazarian, 1984; Nazarian and Desai, 1993), which provide representations of the shear wave velocity (Vs). The rise of seismic noise methods (passive methods) has made it possible to complement the active methods. Array stations methods as SPAC (Aki, 1957; Okada & Suto, 2003), ReMi (Louie, 2001), and Seismic Interferometry (e.g., Shapiro & Campillo, 2004; Shapiro et al., 2019) take advantage of the stationarity of ambient seismic noise recorded at more than two stations to determine Vs and even reach greater depths. If we use seismic noise recorded in a single triaxial seismic station, the method of spectral ratios H / V (Nakamura, 1989; Lermo & Chávez, 1994) could establish a first approximation of the depth of the substructure (e.g., García-Jerez et al., 2006; Hellel et al., 2019).
The indicated methods acceptably carry out the delineation of the substratum. The 3D representation of the subsoil velocity structure can be established by massive data acquisition in a single method or the combination of active and passive methods (e.g., Cardenas et al., 2016, 2020; Hussain et al., 2019; Chávez et al., 2021; Martorana & Capizzi, 2020). Whether 2D or 3D representation, data acquisition must be performed above the study target. An alternative to avoid invading the surface to be explored is the Seismic Interferometry method, which obtains the medium properties between pairs of stations. If an extensive array of receptors surrounds the area to be explored, we can perform a Vs tomography of the subsoil (e.g., Argote et al., 2020; Cardenas et al., 2020, 2021). A limitation of this method is that it requires an azimuthal distribution of noise sources and a dispersive medium to obtain an adequate distribution of velocities (Forghani & Snieder, 2010). However, different processing techniques have been implemented to mitigate the lighting of noise sources and highlight the dispersive character (Balestrini et al., 2020; Liu et al., 2021). The processing cost translates into more elaborate procedures with greater time consumption in quality control steps and seismic noise recording time.
A procedure not yet fully explored is the refraction tomography of sources and receptors on the surface (RTSRS). This method could provide a 2D image of the subsurface P-wave velocity distribution in two stages. The first is to identify the arrival times of the refracted waves, and the second is to solve the velocity and depth of the refractor in a discretized surface. Geophysical engineering students of UNAM have carried out this type of experiment to comply with field practices. In this type of experiment, seismic records contain primary arrivals that result from a combination of direct, refracted, and reflected waves. The results obtained so far show Vp subsoil images indicating lateral discontinuities due to subsoil composition (Ramos, 2015; Gamez, 2021). However, these images cannot be assigned an investigation depth because travel time first arrivals are mixed in the data inversion.
This study explores the RTSRS method, whose acquisition design raises the following questions: can refracted waves detect lateral variations with sufficient velocity contrast to recognize anthropogenic irregularities in the subsoil? Furthermore, the depth of the irregularities is related to the depth predicted by the linear model of the P-wave arrival times? The objective is to determine anomalies of interest and the refracting sublayer shape and depth under two archaeological structures. In the first stage, we explore the subsoil through seismic refraction sections along the lines that make up quadrangular arrays surrounding the structures. Subsequently, we describe the RTSRS method and analyze the tomography refraction images according to the substratum irregularity. Finally, we discuss our results and indicate the advantages and limitations of the method.
Study zones and data acquisition
We investigate two archaeological sites. The first one corresponds to the area called Plazuelas in the municipality of Pénjamo, State of Guanajuato. In this area, there are several buildings, but the most important corresponds to the building known as Casas Tapadas, where we carried out the study. The construction consists of a large rectangular platform on which four pyramidal bases were built for expansion. In the southern base of this structure, there are signs of leveling the land to preserve the building’s horizontality when constructing one of the basements (Secretaría de Cultura/INAH, 2020). The surface land materials are made up of basaltic tuff and sandstone (Pérez et al., 1999). It is worth mentioning that although another series of geophysical experiments have been carried out in the area (Morales et al., 2015; Huerta, 2017; Rocha, 2017), none of them had been directed to explore the subsoil under the pyramid to know the conditions of ground leveling for its foundation.
Seismic experiments were carried out to study ground leveling conditions. For this purpose, 72 vertical geophones of 4.5 Hz were placed around the central pyramid with a spacing of 1.77 m forming a square arrangement of 32 m per side (Figure 1). By the percussion of a metal plate with a 12 lb sledgehammer, 16 seismic sources were produced distributed around the arrangement at one meter of separation of the geophones line. In each source point, five strokes were stacked whose values were recorded on six SEISTRONIX EX6 model seismographs. Figure 3a shows an example of the traces recorded for source 1, where the primary arrivals (direct and refracted waves) with arrival times no greater than 30 ms are clearly observed.

Figure 1 a) Location of the seismic survey within the archaeological zone of Plazuelas, b) image of a pyramid side and geophones line, c) geophones array (red circles) and points where the sources were generated (blue triangles). Capital letters indicate the end of the seismic refraction profiles formed along the lines that define the geophones
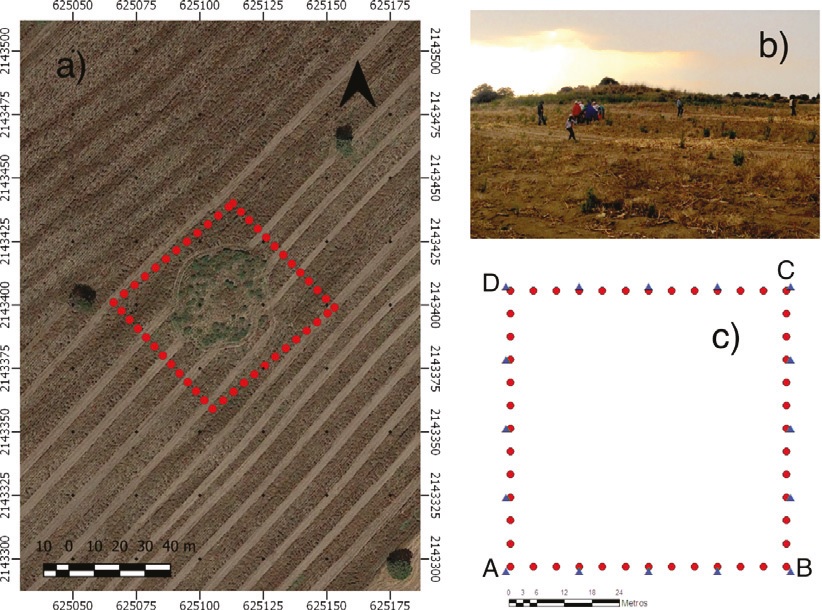
Figure 2 a) Location of the seismic survey within the archaeological zone of Xalasco, b) photograph of the site study appearance, c) geophones array (red circles), and points where the sources were generated (blue triangles). Capital letters indicate the end of the seismic refraction profiles formed along the lines that define the geophones

Figure 3 Example of recordings produced by a seismic source, a) Plazuelas site, b) Xalasco site. The dashed red lines indicate the first arrivals of the direct and refracted waves. On both sites, some channels did not operate
The second site is located in the archaeological zone of Xalasco, municipality of Atltzayanca, Tlaxcala. There are several pre-Hispanic sites in the area, some of which have been objects of archaeological and geophysical studies (Argote et al., 2016; Juárez et al., 2017). The selection site was in conjunction with INAH archaeologists to characterize what they believe may be a prehispanic construction of the Teotihuacan culture (Manzanilla & Bautista, 2019; López et al., 2016). The study was carried out in an agricultural area consisting of soil deposits overhanging andesitic tuffs (Juárez et al., 2017). In the acquisition of seismic data, 48 vertical geophones of 4.5 Hz with a separation of 5 m were used to form a square arrangement of 60 m per side. Like the previous experiment, 16 sources distributed around the arrangement were used (Figure 2). Figure 3b shows an example of the records produced by source 1. In this case, we observe that the refracted arrival times reach up to 150 ms on average; that is, we can infer that the subsurface velocity materials are lower than in the previous site.
The seismic refraction method
The seismic refraction method is widely used to determine the compressional wave velocity structure of the subsoil. By recording direct and refracted arrival times along a linear array of receivers, travel-time curves are constructed as a function of distance. Figure 4 sketches the interpretation of those times by adjusting straight lines to the data; the slope of the direct arrivals defines the upper layer's velocity, and the slope of the refracted arrivals determines the subjacent layer velocity. The travel time of a refracted wave (trajectory ABCD) can be represented by Equation 1, whose second term is the y intercept (Ti). The refractor depth (h) is determined from the Ti value once the layer and sub-layer velocities are determined. Using Equation 2, it is also possible to solve for h if we fix the distance at which the refracted arrivals begin to appear (crossover distance).
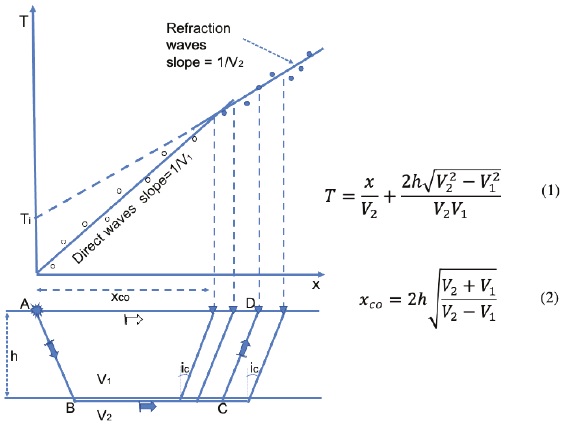
Figure 4 Interpretation scheme of direct (hollow circles) and refracted (solid circles) arrivals in the seismic refraction method. The travel time of a refractive wave (trajectory ABCD that emerges with a critical angle (ic) is represented by the equation of a straight line (Equation 1) whose y intercept time Ti (second term) allows to determine the refractor depth (h). The crossover distance (xco) also allows to solve for h
There are different methods to interpret the first arrivals represented in a travel-time plot. One of the first is the Generalized Reciprocal Method (Palmer, 1981), which is based on determining the arrival times of direct and reverse shots in pairs of receivers. Currently, traditional refraction processing has been replaced by tomography refraction. In this method, a subsurface structure model is constructed with the velocity variations produced by adjusting the travel times observed with those derived from the ray tracing (Sheehan et al., 2005; Zelt et al., 2013). According to the density of selected arrival times, a detailed image of the 2D velocity structure can be built, where the anomalies produced by various discontinuities (faults, pipes, cavities, foundations, etc.) can be reasonably interpreted.
Seismic refraction profiles
Figure 5 shows the first arrivals of all seismic sections of each site. At the Plazuelas site (Figure 5a), we observe a large dispersion for direct and refracted arrivals. This dispersion indicates the substructure irregularity under the pyramid structure. The crossover distance at which the refracted arrivals begin to appear is 7.5 m. In comparison, the first arrivals at the Xalasco site (Figure 5b) follow an almost linear behavior. In the travel-time plot, we can identify the critical distance as approximately 20 m. The time arrivals slope reveals a low contrast of velocities between the refractor and the surface layer.
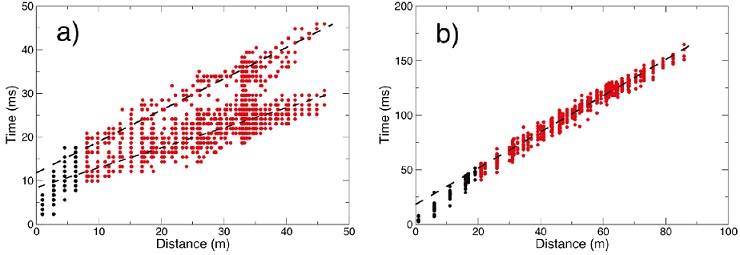
Figure 5 First arrival times as a function of the distance for the sites of: a) Plazuelas and b) Xalasco. The black circles represent the direct arrivals, and the red circles represent the refracted arrivals. The dashed black lines indicate the possible best fit of a line to the refracted arrivals
A first approach for identifying the basement under each structure is to analyze the seismic refraction sections (SRS). Since we have built quadrangular arrays, we can obtain four SRS along the receiver lines that make up each array. To do this, we process the first arrivals using the Zondst2D program (Kaminsky, 2015), which produces a tomography image by best fit of the observed travel times with those calculated from an initial velocity model. New travel times are produced from the updated model in each interaction until producing the best model with the minor fit error.
Figure 6a shows the SRS around the Pyramid of the Casas Tapadas site. Arrival times allow us to define a layer on an irregular sub-layer. Along the BC section, the layer has a thickness of 1m because the line is perpendicular to the lithological dip layers. In the other sections, the thickness is from 2 to 5 m. The velocity of the first layer is on average 800 m/s and the sub-layer 1400 m/s. Although the thicknesses at the ends of each section are interpolated (because refracted arrivals cannot be obtained at distances less than the critical distance), we observe a good agreement between the thicknesses of the surface layer obtained at the ends that join each section. The layer has a thickness of 2 m on the north side (Section B-C) and 5 m on the south side (Section D-A).
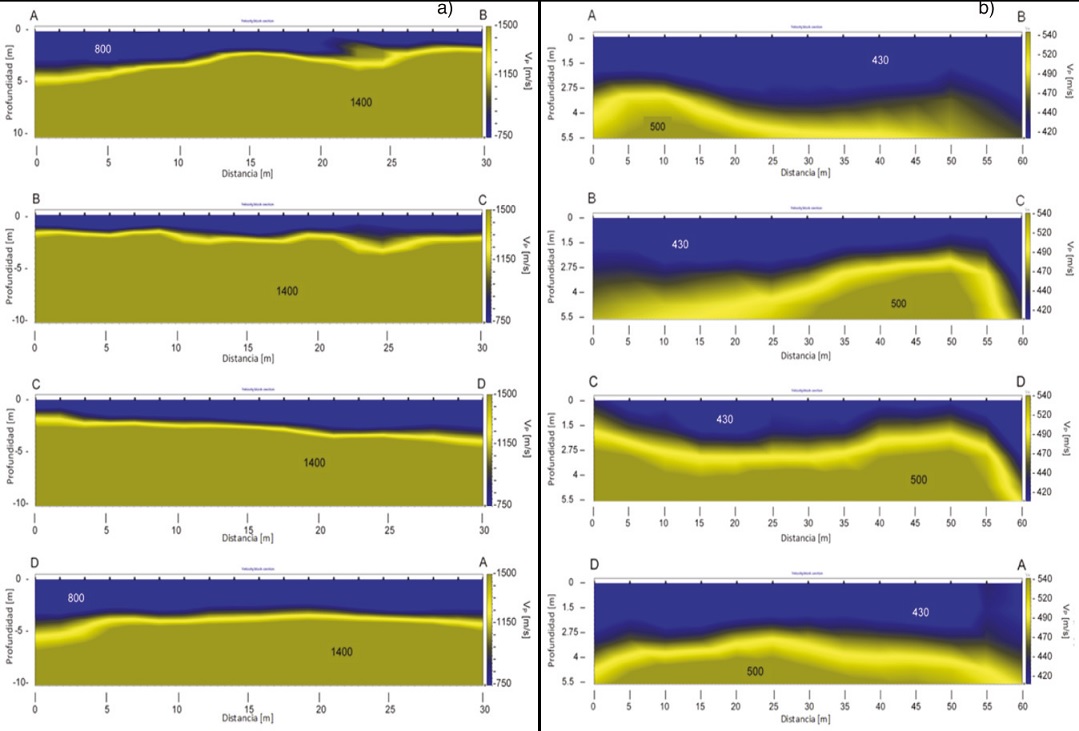
Figure 6 Seismic refractions sections obtained along the receiver lines that make up each array, a) Plazuelas site, b) site of Xalasco
The SRS of the site Xalasco is shown in Figure 6b. The arrival times modeling allows us to determine a layer of an average thickness of 2.75 m with a velocity of 430 m/s overlaying to substratum of 500 m/s. The velocity contrast between the layer and the substratum is weak, as shown by the arrival times of Figure 5b; however, we can define the substratum irregularity such that the depth of the layer can be followed at the ends of each section.
Pseudo seismic refraction tomography
We now explore the refracted arrivals recorded in the closed array of receivers with a distribution of sources on the surface and surrounding the array (RTSRS method). In this case, the primary waves recorded can be direct arrivals or reflected at short distances or refracted at intermediate to long distances. The proposed acquisition geometry does not allow applying the classical interpretation of the refraction method to determine the velocity and depth refractor. However, as we observed in the previous section, the representation of these travel times in a time-distance graph permits identifying direct and refracted arrivals (Figure 5).
If the study area is discretized with cells proportional to the geophone separation, we can identify the source-receiver trajectories that cross each cell. The refracted arrivals of these trajectories can be used to determine the refractor velocity if we adjust these arrivals to the slope-intercept straight line form (Equation 1, Figure 4). Figure 7 shows a ray-tracing diagram due to three sources and twelve receivers, where the ray paths converge in a cell located at a depth where the wavefronts are refracted due to enough impedance velocity contrast. The representation of the slopes inverse (or velocities) for each cell will provide us with a pseudo-tomography of the velocity variations under the receiver array. The intercept time can be utilized to determine the refractor depth according to the second term of Equation 1. In this estimate, the top layer velocity (V1) can be considered constant.

Figure 7 Ray path scheme (three sources and twelve receivers) in a 3D medium whose velocity increases with depth. The black rectangle indicates a cell where the refracted rays converge (modified from: https://www.pygimli.org/_examples_auto/2_seismics/plot_05_refraction_3D.html)
We have used the refracted arrivals of each site to create a pseudo-velocity tomography of the refractor substructure. The surface covered by the array was divided into cells of 5 m per side, and we assign the refracted trajectories (travel times) to each cell to perform a nonlinear least-squares fit using the Marquardt-Levenberg algorithm (Williams & Kelley, 2019). The solution provides the refractor velocity (V2) as the straight-line slope inverse (Equation 1). The intercept time allows calculating the refractor depth if we use the average velocity of the upper layer (V1; given in the refraction sections) and V2 estimated in each cell.
Figure 8a shows the results under the Pyramid of Casas Tapadas. The velocity distribution has values higher than 1500 m/s, in agreement with the substratum velocity resolved in the SRS of Figure 6a. Velocities larger than 2500 m/s are observed in the southern and southwest of the array, where depths are between 5 and 7 m. In the northern and northeast, we observe velocities are lower (1500 to 2500 m/s), and the depths are in the range of 2.5 to 5 m. We found that the depth values are consistent with those found in the SRS. The refractor layer is deeper at the southern part and shallower at the northern part. Figure 8b shows the error percentage quantified by the RMS of the calculated residuals in each cell. Practically the regression error is less than 0.3 %, indicating an acceptable best-fit of the arrival times.
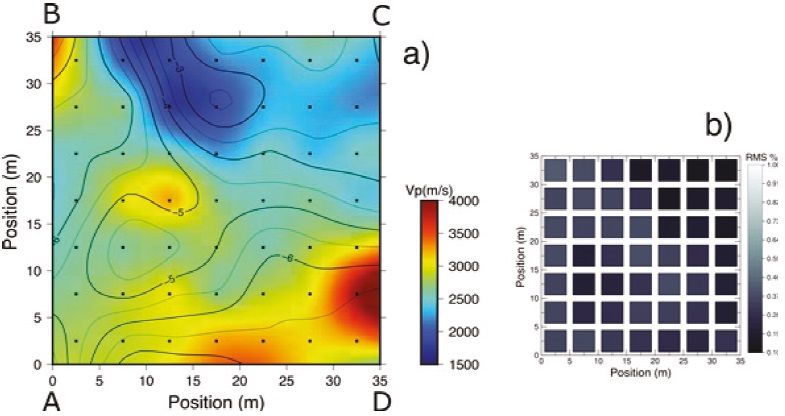
Figure 8 a) Pseudo seismic refraction tomography at Plazuelas site. The black lines represent the iso-depths of the refractor layer in meters. Black dots are the centers of cells, b) RMS residuals representation of travel times inversion in each cell
According to the SRS results at the Xalasco site, tomography velocities are between 500 to 700 m/s with an average depth of 3 to 4 m (Figure 9a). The tomography image of Figure 9a shows that the lateral variation of velocities is very low. Velocities of 700 m/s up to 8 m deep can be highlighted as anomalies of interest. It is observed that the anomaly that is located on the southeast extreme (near Point B) is not solved in the refraction line BC (Figure 6b), which probably is due to the low contrast velocity between the top and bottom layer. According to the residual RMS (Figure 9b), the zone with the most significant best-fit error is observed at the southwest. Both the high-velocity anomalies and the velocities on the Northern zone of the array can be considered reasonably resolved given that the RMS values are less than 0.5 %.

Discussion
The seismic refraction method makes it possible to determine the depth and velocity of a refractory layer reliably. The method resolution depends on the travel times identification of the refracted waves and the best fit to a subsoil inversion model (Palmer, 1981; Yilmaz, 2015). This study identified these travel times in two closed seismic arrays of sources and receivers. Thanks to the refraction method principle, it was possible to build tomography images showing the P-wave velocity distribution and the depth of the first refractive horizon. Constructing a tomography image of a second horizon requires considerable penetration energy produced by the seismic source and a more excellent velocity contrast in depth. At the moment, the method resolution depends on the best line fit to travel times; however, this can be improved if an inversion procedure is incorporated (e.g., Sheehan et al., 2005; Zelt et al., 2013).
The RTSRS method results applied to two archaeological sites show evidence of the shape and elastic properties of the substratum. In the Casas Tapadas site, the irregularity in-depth and velocity values (Figure 8a) correspond to more sane materials found below the superficial layer shown in Figure 6a. The site is not precisely a sedimentary zone, where materials are usually deposited in horizontal layers. Instead, it is a volcanic zone where sedimentary materials may be alternated with extrusive igneous rocks (Pérez et al., 1999; Morales et al., 2015). Therefore, the results shown in Figure 8a indicate that filling materials were used to level the ground to construct the pyramidal base.
In the Xalasco site, seismic refraction sections (Figure 6a) also show the thickness of a thin layer that overlaps an irregular subsoil horizon with a slightly higher velocity. The filling layer can be associated with sedimentary materials where agricultural work is carried out. According to the topography, the area covered by the seismic array corresponds to a foreland (see the image in Figure 2b) where archaeologists infer the presence of a prehispanic basement. A first geophysical exploration of the presence of this basement was presented by López et al. (2016). These authors conducted two perpendicular lines (crossing the foreland center) of electrical resistivity tomography, whose results show a thin laterally discontinuous horizon of low resistivity (approximately 2 m thick). Therefore, we believe that the irregular velocity distribution (velocities greater than 600 m/s) shown in Figure 9a corresponds precisely to the remains of a Prehispanic andesitic basement described by López et al. (2016).
Conclusions
In this study, we have expanded the seismic refraction method, typically performed in a linear array of sources and receivers, to be used in a quadrangular array to obtain a depth image of the P-wave velocity subsurface. In addition, we applied the method to two archaeological sites, where it is necessary to explore the subsoil without invading the study area.
RTSRS results on the Plazuelas site show that the substratum is irregular with an inclination to the southern, reaching up to 7 m deep. This result is congruent with seismic refraction profiles, showing that the surface layer thickness increases from North to South. These observations support the archaeologists' conjecture about the ground leveling for constructing a pyramidal base to expand the southern pyramid of Casas Tapadas.
At the Xalasco site, a weak velocity contrast between the surface and the underlying layers is observed. However, this contrast is enough to show the presence of anomalies could be associated with to the remains of a Prehispanic andesitic basement (López et al., 2016), materials, already evidenced in the surroundings by other geophysical methods and direct excavations (Juarez et al., 2017).
The identification and selection of refracted arrival times is a fundamental step to obtain an adequate pseudo tomography. Identifying these arrivals may be affected by material attenuation, velocity inversions, or a high cultural noise level if the study is carried out in an urban area. At the moment, this method does not allow detecting irregularities of layers close to the surface. However, the method can be enhanced with ambient seismic noise tomography or electrical tomography, techniques already developed by the Engineering School.

