


 nueva página del texto (beta)
 Inglés (pdf)
 Artículo en XML
 Referencias del artículo
 Enviar artículo por email
 Citado por SciELO
  Similares en
SciELO
Similares en
SciELO 
 Permalink
Introduction
The demand for electric energy in Mexico is growing at accelerated pace and public financial resources are insufficient to cover all investment needs in this field. CFE (Comisión Federal de Electricidad or Federal Electricity Commission), the former Mexican state-owned electricity monopoly lacks sufficient investment resources; this situation has been a main driver to open the electricity generation industry to private investment. Since 1992, almost all new fossil fuel (mainly natural gas) power stations have been built and financed by the private sector thought some form of PPP (Private-Public Partnership) structure where the location, technology and fuel type is defined by the CFE.
Electric energy generation in Mexico is heavily based on fossil fuels. Mexico has abundant oil and natural gas reserves, but a significant oil production rate decline is expected to take place in the next decade.
Several mid and long term ecological and system efficiency objectives have been established in Mexico. However, these will be difficult to achieve if investment in new capacity continues to be directed mainly to fossil fuels technologies, like natural gas combined cycle plants, and proportionally less to investment in non-fossil technologies.
The mexican power system
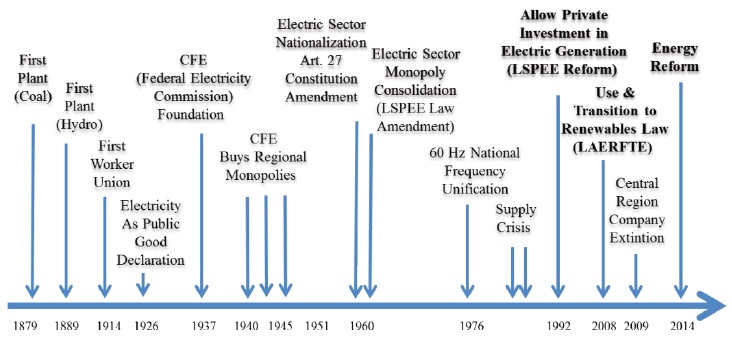
The first electric generation plant, coal fired, appeared in Mexico in 1879. Since then, the Mexican power system has been developing trough several technological stages; using hydro-electric non-fossil technologies; and, coal and fuel-oil technologies. In this period some crucial events have taken place, like the foundation of the CFE in 1937, the nationalization of the electric sector in 1960, the LSPEE law (See the glossary) allowing private investment in 1992, the LAERFTE law in 2008, designed to foster the non-fossil generation technologies and the Electrical Power Reform, as part of the Energy Reform (Figure 1). The objective of this reform is to offer more electrical power at lower and competitive price, for the benefit of all users including small and medium-sized companies (Presidencia, 2014; Lajous, 2014).
Elizalde et al. (2010) distinguishes three periods in the electric power generation sector in Mexico, each of them dominated by three different types of energy sources: the hydro era from 1965 to 1975, the fuel-oil era from 1975 to 2000 and the natural gas era from 2000 to the present. It is expected that in the next years this trend will continue with natural gas and combined cycle technology increasing their share.
In 2016, the Mexican power system ranks 13th in electric generation capacity in the world with 61.6 GW and 324 TWh energy generation (BP Statistical Review of World Energy, 2017), 16 % obtained from non-fossil sources. Power System Losses is about 13.5 %. CFE has a constitutional monopoly on electricity generation, transmission and distribution. Exceptionally, as a result of the LSPEE, the private sector was allowed to participate in generation where it has proportionately little participation. Mexico’s transmission and distribution grid has a total of 845, 200 km.
There is a great potential in non-fossil resources in Mexico that may be efficiently exploited with an effective energy policy and capacity planning design. Table 1 gives an overview on fossil and non-fossil energy resources in México.
Table 1: Potential of energy resources in México*
| Installed capacity and annual generation |
Estimated potential | |
| Oil | 2.2 million barrels / day (tbd) | 43, 837 million barrels (P3) oil equivalent (Mboe) Proved: 13, 810 Mboe (P1) Probable: 12, 352 Mboe Possible: 17, 674 Mboe |
| Natural gas | 6, 436 mmcf (millions cubic feet per day) |
61, 641 mmmcf (billions cubic feet) |
| Hydraulic | 11.5 GW 35.8 TWh |
80 TWh (3.25 GW Mini-Hydro) 6.3 GW (SENER, 2013) |
| Biomass | 459 MW | 803 MW 3 GW (SENER, 2013) 4,507 MWh per year |
| Geothermic | 886 MW 6.5 TWh |
1.3 - 12 GW 10 GW(SENER, 2013) |
| Wind | 87 MW | 10 - 40 GW 20 GW (SENER, 2013) |
| Solar | 31 MW | 14 GWh 5 KWh/m2 per day 6 GW (SENER, 2013) |
*Sources: SENER, 2016, 2013, 2012, 2012p, 2012ng, 2012r, 2010, 2009a, 2009b; Domenge, 2011; Romero et al., 2010; Vietor & Sheldahl, 2017.
Current mexican energy policy
Since 1992, when the LSPEE law was passed, the Mexican electricity sector has experienced a process of allowing the participation in generation of private capital. Independent Power Producers (IPP) or private generators were allowed to generate self-consumption energy and sell the rest to CFE. The main technology used by the IPP is the combined cycle thermal plants. The IPP participation in electric energy generation has been growing and so has the use of natural gas generation technology. There are several concerns in Mexico about the tendency of using this kind of fossil technology in the future and proportionally less in non-fossil capacity. IPP current generation represents 22.1 % of Mexico’s installed capacity.
In 2008, the Law for Using Renewable Energy Sources (LAERFTE, 2008) was introduced, designing a renewable energy program with the specific strategic objective among others, increasing, promoting and regulating the renewable energy portfolio mix.
The Mexican Government’s Energy Secretariat (SENER) is the public department responsible for directing the Mexican energy policy, regulating and promoting, among other duties, the use of non-fossil technologies and reducing fossil fuel dependence. There are three strategic lines that guide the Mexican electricity energy policy (SENER, 2009a, 2009b, 2012):
The model
Planning an electric energy generation system expansion is a complex and multifactor situation. As a complex system, there are several dimensions involved: the demographic, social and political dynamics, the economic growth and development, the creation and diffusion of new technologies, and the health, environmental and sustainability issues. In order to make a comprehensive and transparent energy planning exercise, it is necessary a model that relate the relevant decision or policy variables with the proposed objectives, fostering the relevant dimensions under the planner perspective.
There are several types of energy system models for policy planning, considering their objective and underlying methodology. The two main types are:
Optimization models: That minimize or maximize some kind of objective function, generally the minimum cost (financial, maintenance, operating, fuel, shortage, importing, externalities) under a set of physical, technical, financial or socio-political constrains, using linear, dynamic, min-regret or other optimization procedure (IAEA-WASP, 2001; Martín del Campo, 2011; Balmorel, 2018).
Simulation and assessment models: Assessing the system under a set of constrains, assumptions and desired evaluation policies (MDESRAP: Qudrat, 2005; IAEA-MAED, 2006), environmental impacts (IAEA, 2010: MESSAGE-OIEA) and financial (IAEA, 2010: IAEA-FINPLAN, IAEA-SIMPACTS). In Mexico see WASP (Ibars & Fernández, 2002; Martín del Campo, 2011).
The analysis in this article is based on a System Dynamics (SD) simulation model that generates and evaluates strategic scenarios. The objective of the model is the identification of the non-fossil and fossil generation capacity expansion, and time pacing requirements in order to achieve both ecological (fossil/non-fossil proportion) and reliable strategic objectives while supplying future electric energy demand.
System Dynamics is a general modelling approach that allows the discovering of the causal structure of a complex system and policies driving problematic behaviours (Schaffernicht & Groesser, 2016). It allows the creation of transparent models and diagrams of a real focal system characterized by accumulations, delays, and non-linear feedback mechanisms that reflect causal relationship between the system elements. The SD approach facilitates, also, the communication between various stakeholders, including the modeller (Dace et al., 2014).
Sterman (2010) summarise the five phases of the SD approach: problem structuring, causal loop modelling, stock and flow or dynamic modelling, scenario and policy exploring and planning, and implementation and organizational learning. Scenario planning provides a systemic view to help policy makers identify and understand the driving forces of their influence or focal system. SD methodology also provides a way to learn about the real system, challenging and changing policy makers’ mental models (Senge, 1990; Ritchie & Puente, 2008). Computer-based SD modelling provides decision makers an alternative tool to gain insights into the focal system for policy design support.
Model structure
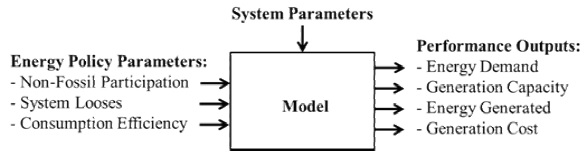
The proposed model has three decision variables derived from the desired energy policy decisions, four outputs or key performance indicators (KPI) measures and a series of parameters. Figure 2 shows the input-output black box model structure.
The model considers two electricity generation aggregated technology types: fossil and non-fossil. The fossil category includes natural gas (72 %), coal (13 %) and oil (15 %) as primary energy inputs, as estimated in Elizalde et al. (2010). The non-fossil category includes hydro (47.42 %), nuclear (12.89 %), geothermal (12.37 %), wind (14.04 %), biomass (13.19 %) and solar (0.09 %) technologies. The non-fossil percentage participations values are estimated based on SENER (2012, 2016a) data.
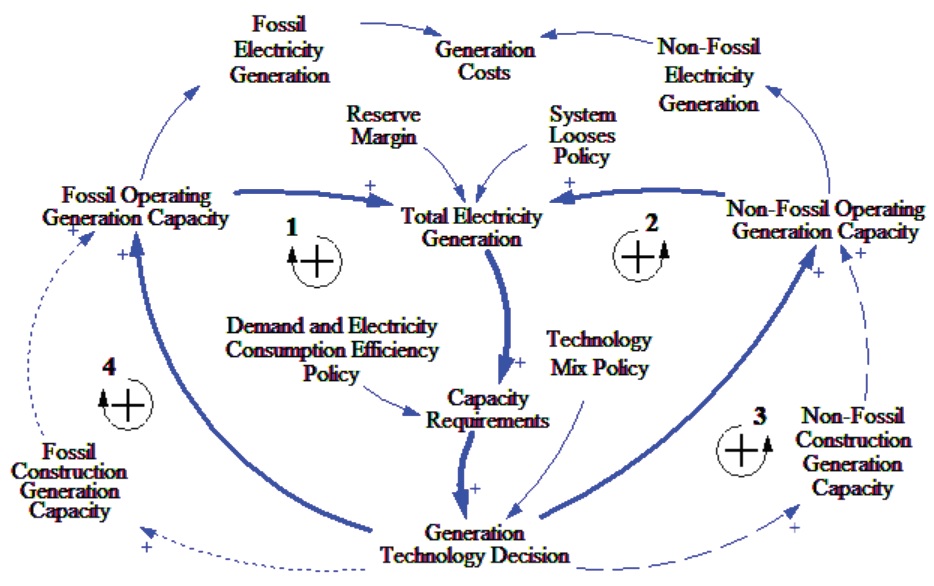
Based on an electricity demand forecast, as the main driver of the system, the model assigns the type of installed capacity required -fossil or non-fossil-, under a given strategic technology mix objective, an energy loss, a consumption efficiency and a reserve margin. In case that installed capacity is insufficient to satisfy expected demand, the model considers a capacity expansion level and a capacity construction period or delay for each electricity generation technology. Figure 3 shows the causal model structure diagram or CLD, composed by four reinforcement loops (Sterman, 2000): two for energy generation (loops one and two) and two for capacity expansion (loops three and four) that considers the delays due to the fossil and non-fossil construction generation capacity.
The conceptualization, structure and construction of the model are based on three sub-systems (Hines, 2005; Sterman, 2000; Lyneis, 1989; Albin, 1998; Brown, 2002; Qudrat, 2017): a. Electric Energy Demand, b. Power Plants Capacity and c. Cost modules.
a) The Electric Energy Demand (EED) module, is based on an electric energy demand growth function (Equation 1). It is considered the Growth Rate (GR) as an exogenous parameter. The Net Electric Energy Demand (NEED) is a function of EED (Equation 2) and the Efficiency Effect (EE), which has a first order delay effect and a given delay time D (Equation 3) of the consumption efficiency factor (CEF), a policy parameter (Davidsen et al., 1990; Whelan & Msefer, 2003) in the model. It is considered a first order delay as a gradually belief adjustment or adaptive expectation phenomena (Sterman, 2000), as electric energy users get convinced and adopt more efficient new technologies. In Equations 1 and 3, EEDt0 and It0 are initial values.
b) The Electric Energy Generation Capacity module, describes the new power plants capacity construction dynamics (Ford, 2001, 1999; Albin, 1998; Sterman, 2000, Sánchez et al., 2007, 2005; Olsina, 2005; Bunn et al., 1997; Jalal & Bodger, 2010; Vogstad, 2004; Qudrat, 2005), considering the fossil and non-fossil capacity in construction delay times and a maximum per-year non-fossil capacity expansion level. This module considers an average estimated useful life for both fossil and non-fossil installed capacity (SENER, 2012).
The capacity expansion is an endogenous variable. It is the incremental amount per year for each type of technology (fossil and non-fossil). It is considered that there can be several investment projects at the same time for a given technology type. Capacity increment has a delay or time lag between the investment decision and the real installed capacity. Capacity decisions have a “wave effect” causing periods of high and low reserve margins (Ford, 1999, 2001), non-fossil participation and costs. The capacity expansion module is designed as a goal seeking dynamic module (Sterman, 2000, p.111) where the Non-Fossil participation parameter (Equation 4) is considered the policy goal (SENER, 2012).
where:
NFCI= |
Non-Fossil Capacity Construction Increment |
DNFP= |
Desired Non-Fossil Participation |
Y= |
Number of years to achieve the goal |
Total Installed Electric Energy Generation Capacity (TGC) includes the fossil (FGC) and non-fossil (NFGC) accumulated electric energy capacity expected requirements in the planning horizon, measured in Giga-Watts (Equation 5).
Total Electric Energy Generated (TG) is the total electric energy (TeraWh) generated by the fossil (FG) and non-fossil (NFG) installed generation capacity portfolio (Equation 9). FG is a linear function of the fossil installed electric energy generation capacity (FGC) and the fossil electricity generation factor (FGF). NFG is a linear function of the non-fossil installed electric energy generation capacity (NFGC) and the non-fossil (NFGF) electricity generation factor (Equations 6 to 8).
c) The cost values that are used in the model, were the levelized costs of electricity (LCOE) lifetime cost. The LCOE is the unitary cost of generating electricity for a particular technology system over its economic life. It includes all the estimated costs and the amount of electricity generated over its lifetime: capital expenditure or initial investment required to engineer and construct the plant, cost of fuel consumed to generate electricity, fixed operation and maintenance costs (salaries, insurance and others that remain constant irrespective of the electricity generated), variable operation and maintenance cost (materials used or consumed as a function of the electricity generated), carbon emissions cost, decommissioning cost and the cost of capital, based on the discounted cash flow method (AEO 2011; Alonso et al., 2006; OECD, 2010).
The model uses the cost parameters weighted values for the fossil and non-fossil technology participation for each simulated scenario (Equations 9 and 10).
where:
FCj= |
Fossil Levelized Weighted Cost for scenario j |
NFCj= |
Non-Fossil Levelized Weighted Cost for scenario j |
wfij= |
Weight of fossil technology i (conventional thermoelectric, coal and combined cycle) in scenario j |
wnfij= |
Weight of non-fossil technology i (wind, solar photo voltaic, bio, geo, hydroelectric and nuclear) in scenario j |
FLTCi= |
Fossil Levelized Cost for technology i |
NFLTCi= |
Non-Fossil Levelized Cost for technology i |
The Cost Index (CIt) is (Equation 11) the fossil (FCt) and non-fossil (NFCt) total accumulated cost of electricity generation at year t, relative to initial (t = 0 in year 2012) base scenario cost.
Model parameters and output performance measures
Electric Energy Demand Growth Rate (GR), an exogenous variable, is estimated considering a 4 % annual increase, based on Gross National Product (GNP) forecasts (SENER, 2012).
Capacity useful life: for the relative short period of time considered (2012-2028), compared to the useful life of the electricity generation plants, the assumption in the model is that a minimal real decrease occurs in the installed capacity, both for fossil and non-fossil plants. For reference, the useful life for some different generation technologies is: gas 25 years, coal 40 years, nuclear 40 years, photo voltaic solar panels 15 to 30 years and hydro 50-100 years (ONYSC, 2011; Alonso et al. 2006; Jalal and Bodger, 2010).
Generation factor: is the electricity generation divided by the installed capacity for fossil (FGF) and non-fossil (NFGF) primary energy source. The parameters used in the model are based on data from CFE (2010).
Reserve margin: is the difference between the effective installed capacity and the maximum demand of an electric system (CFE, 2011), expressed as a percentage on the maximum demand. It is considered a value of 20 % in the model (Table 2).
Losses: it is expected a loss reduction from 13.6 % in 2012 to 8 % in 2026 (SENER, 2012; CFE, 2010) following the CFE energy saving program.
Table 2: Model parametersa
| Parameter | Value | Units |
| Annual population growth rate | 0.2 | % per year |
| Electricity use (2012) | 1.810 | kWh per capita per year |
| Electricity use (2050) | 7.510 | |
| Reference Reserve Margin | 20 | % |
| Fossil Emission Factor(1) | 609 | CO2 Mtons / GWh |
| Non-Fossil Emission Factor(1) | 16 | |
| Fossil Generation Factor(1) | 6.48 | Generation / Capacity |
| Non-Fossil Generation Factor(1) | 3.21 | |
| Fossil Cost(2) | 0.09 | US Dll/ kWh |
| Non-Fossil Cost(2) | 0.11 | |
| Fossil Capacity Expansion Level(3) | 25 | GW |
| Non-Fossil Capacity Expansion Level(4) | 15 | |
| Fossil Construction Capacity Period | 5 | Years |
| Non-Fossil Construction Capacity Period | 2 |
aNote: 1) Weighted, 2) Levelized Weighted, 3) CC, 4) Renewables
Decision variables
Non-Fossil participation: is the relation of the non-fossil fuelled technology electric energy generated divided by the total electric energy generated per year. It is one objective in the Mexican electric energy policy (SENER, 2012).
Consumption efficiency factor: is the expected change in consumption efficiency derived from the Mexican energy policy: the energy savings program (SENER-PRONASE, 2009), created to foster actions and programs in order to achieve energy savings.
Losses: there are two kinds of energy losses considered in the model: technical and power theft losses, in the transmission and distribution activities.
Model validation
Model outcomes credibility is based on model validation so several procedures were applied in order to do it, considering the assessment of the non-fossil generation capacity investment and timing requirements objective: boundary adequacy, structure verification, dimensional consistency, parameter verification, behavioral sensitivity and extreme conditions (Qudrat & Baek Seo, 2010; Forrester & Senge, 1980; Qudrat, 2008; Oliva, 2003).
The boundary adequacy and structure and parameter verification are appropriate in terms of the inclusion of the important concepts, scenario parameters and the model structure for the policy decisions considerations. The behavioral sensitivity test is evaluated assessing the outputs and the model behavior for alternative parameter values. Scenario results are consistent with SENER (2012, p.158-164) projected scenarios. The extreme conditions assessment was made by changing the parameters values (Table 2) considering their possible real system value ranges. The dimensional consistency test was made by using the unit consistency and syntax test tool provided in the Vensim software. Both units and syntax tests shows positive results, which means that the model does not include any dimension consistency errors.
Policy and scenario analysis
The model simulation time period is from 2012 to 2026. The analysis is based on four scenarios with different goals and policies for 2024. The goals or strategic objectives were defined by the government in 2012 (SENER, 2012; 2016a; Ea Energy Analyses, 2016). Planning assumptions and objectives are based on the visualization of each of these four scenarios (Table 3).
Base Scenario: this scenario is considered in order to have a trend reference of the outputs or the performance measures, understanding system behaviour and giving insight into the elements, parameters, causal relations and drivers of the electrical generation system. This scenario takes the base values of all the parameters of the system in the time horizon considered.
Efficient Scenario: this scenario considers a decrement in transmission and distribution system losses (CFE, 2010: Electric Sector Investment Program), and a final user savings (SENER-PRONASE, 2009: Mexican Government Saving Program).
Green Scenario: this scenario considers a combination of an increment in the non-fossil electricity generation technologies participation (SENER, 2009a), a reduction of the system losses, and a final user savings policy.
Hybrid Scenario: a combination of an increment in the participation of the non-fossil electricity generation technologies (SENER, 2012), a more renewable base technology participation for each non-fossil technology (SENER, 2012), a reduction of the system losses, and a final user savings policy is considered in this scenario.
Table 3: Scenario assumptions and 2024 objectives
| Scenario | |||||
| Base | Efficient | Green | Hybrid | ||
| Desired non-fossil generation participation | 20.3 % | 20.3 % | 35 % | 35 % | |
| Energy losses | 13.6 % | 8 % | 13.6 % | 8 % | |
| Consumption efficiency factor | 0 % | 2 % | 0 % | 2 % | |
| Non-fossil technologies weights participation |
Wind | 14.04 % | 14.04 % | 24.67 % | 24.67 % |
| Solar | 0.09 % | 0.09 % | 0.15 % | 0.15 % | |
| Bio | 13.19 % | 13.19 % | 23.18 % | 23.18 % | |
| Geo | 12.37 % | 12.37 % | 6.86 % | 6.86 % | |
| Hydro | 47.42 % | 47.42 % | 18.86 % | 18.86 % | |
| Nuclear | 12.89 % | 12.89 % | 26.29 % | 26.29 % | |
| Fossil technologies weights | TE | 3.35 % | 3.35 % | 4.15 % | 4.15 % |
| Coal | 16.38 % | 16.38 % | 20.31 % | 20.31 % | |
| CC | 80.27 % | 80.27 % | 75.54 % | 75.54 % | |
Notes: TE: Thermo Electric (Conventional, Internal Combustion, Turbogas; CC: Combined Cycle
Results
As can be seen in Figure 4 to Figure 6, Non-Fossil Energy Generation participations for scenarios Base and Efficient are around 20 %, due to the initial specified objective (Table 4). The Non-Fossil Generation participation in the Green and Hybrid scenarios are higher due to the participation objective in the considered period of time. Only in the Hybrid scenario, Non-Fossil Energy Generation participation (36.16 %) reaches the strategic objective (Table 5) of 35 % between years 2024 and 2025.
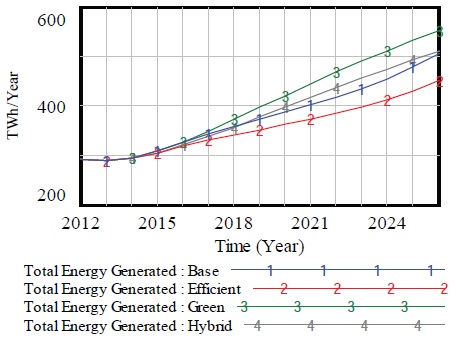
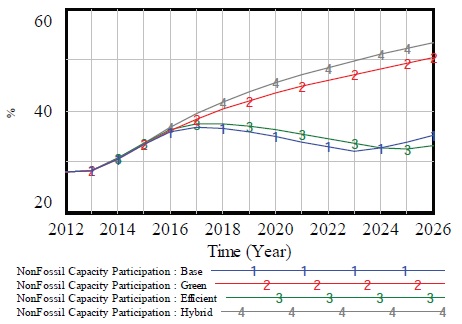
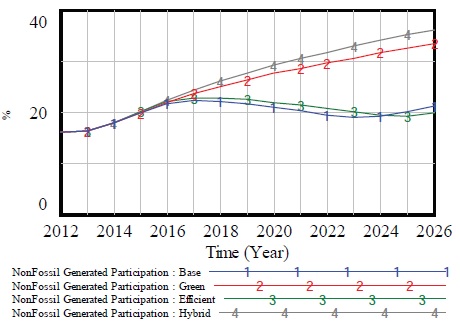
Table 4: Output performance measuresa
| Scenario | ||||
|---|---|---|---|---|
| Base | Efficient | Green | Hybrid | |
| Net energy demand (TWh) | 448.50 | 439.56 | 448.50 | 439.56 |
| Total installed generation capacity (GW) | 94.81 | 83.63 | 114.05 | 107.67 |
| Fossil installed generation capacity (GW) | 61.56 | 55.83 | 56.61 | 50.23 |
| Non-fossil installed generation capacity (GW) | 33.26 | 27.82 | 57.45 | 57.45 |
| Total energy generated (TWh) | 505.67 | 451.03 | 551.23 | 509.89 |
| Fossil energy generated (TWh) | 398.92 | 361.76 | 366.83 | 325.50 |
| Non-fossil energy generated (TWh) | 106.75 | 89.28 | 184.40 | 184.40 |
| Non-fossil generation participation (%) | 21.11 | 19.79 | 33.45 | 36.16 |
| Total cost index | 17.95 | 17.02 | 20.28 | 19.45 |
aNote: Final values, year 2026
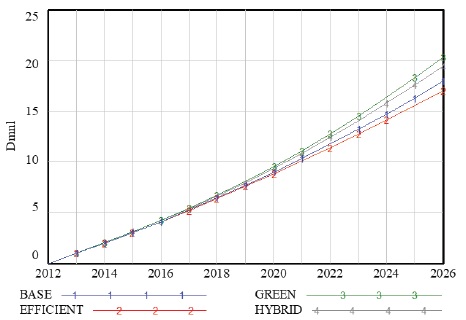
The four scenario simulations show (Table 4 and Figure 7) that the Green Scenario is the most expensive one, due to its energy generation type proportion and the highest required Total Installed Energy Generation Capacity and Non-Fossil Installed Energy Generation Capacity. The cheapest option is the Efficient Scenario, but the Non-Fossil Energy Generation Participation objective (20.3 %) is almost reached in this case (19.79 %). In the Hybrid scenario, the Non-Fossil Installed Energy Generation Capacity objective (35 % in 2024) is reached (36.16 % in 2026) with a lower Total Index Cost than the Green one.
Conclusions and further applications
Electric generation capacity expansion policy makers must face trade-offs in choosing among several power generation technologies, primary fuels, environmental impacts, political situation and regulatory schemes. With strategic objectives settled under certain energy demand associated with ecological, security and economic criteria, the non-fossil/fossil generation mix capacity expansion decisions and its time pacing assessment are crucial, and they have to be considered explicitly in energy policies designs.
Results suggest that the cost differences between scenarios are due mainly to the system losses, consumption efficiency policies (demand difference) and the electricity generation technology used.
The model could be used as a strategic tool to raise awareness in the energy policy decision making community about:
Challenges in electricity generation capacity expansion investment requirements, energy system and final user efficiency policies.
Business opportunities in the non-fossil fueled generation technologies requirements in the next decades in Mexico.
The expected demand of each type of Mexican consumer differences (ie. industrial, domestic and others) could be considered in the model. Model applications could be expanded and parameters adjusted (efficiency, expansion level, construction period, useful life, emission and cost) for each type of generation technology and fossil and non-fossil proportions, in a continuous value ranges.
Finally, the System Dynamics modelling method, presented in this paper, offers an alternative method in energy generation planning and system conceptualizing, defining the main KPIs used in these processes, and identifying the required resources in order to achieve them, considering the time dimension in their development.
Acknowledgements
The completion of this article was supported by the Asociación Mexicana de Cultura, A.C.
Acronyms and terminology
CC: |
Combined Cycle gas-based electricity generating plant |
CFE: |
Comisión Federal de Electricidad. Federal Electricity Commission, the Mexican state-owned electricity monopoly |
CLD: |
Causal Loop Diagram |
IAEA: |
International Atomic Energy Agency |
IEA: |
International Energy Agency |
IPP: |
Independent Power Producer, private owner electricity producer |
KPI: |
Key Performance Indicator |
LAERFTE: |
Ley para el Aprovechamiento de Energías Renovables y el Financiamiento de la Transición Energética. Law for Using Renewable Energy Sources |
LCOE: |
Levelized costs of electricity |
LSPEE: |
Ley del Servicio Público de Energía Eléctrica. Electrical Public Sector Law |
LyF: |
Luz y Fuerza del Centro, the Mexican state-owned electricity company that operated in the central Mexican states. LyF was closed in 2009 |
OECD: |
Organization for Economic Co-operation and Development |
ONYSC: |
Office of the New York State Comptroller |
PPP: |
Private-Public Partnership |
PRONASE: |
Programa Nacional para el Aprovechamiento Sustentable de la Energía. Energy savings program |
SENER: |
Secretaria de Energía, the Mexican Government’s Energy Secretariat |

