


 nueva página del texto (beta)
 Inglés (pdf)
 Artículo en XML
 Referencias del artículo
 Enviar artículo por email
 Citado por SciELO
  Similares en
SciELO
Similares en
SciELO 
 Permalink
Introduction
At the industrial level in today’s food industry, it is common to move granular material (such as salt) to different processing areas through the use of screw conveyor systems. Multiple companies, such as Martin S&G, and FMC Technologies, among other suppliers, have developed these types of conveyor systems based on customer requirements and specifications. However, due to the apparent simplicity in the components, small and medium enterprises opt to make modifications to these based on staff experience. Consequently, diverse mechanical, electrical, and other problems are generated, resulting in economic losses for the company. Among the typical problems in equipment installed on site in a regional company from the state of Sonora, México, is the periodic rupture (every 5 months) of internal supports, as well as fractures in specific sections of the shaft, which cause total production downtimes for periods of up to 8 hours, an increase in the number of spare parts necessary in the warehouse, the machining of critical emergency pieces (increasing fees), and the unnecessary energy expenditure in the rest of the production line. In the current state of the art, different studies can be found for solutions to specific screw conveyor problems at the industrial level. Such is the case presented by Goytisolo et al. (2001), where the constant blockage problem in a recycling company was eliminated based on an analysis of the conveyor capacity of two screw conveyors working together. In addition, Goytisolo et al. (2001) performs the calculation of the power necessary to convey the utilized material. Chakarborthy & Mthta (2016) presents the design of a flexible screw that allows coupling screw conveyors at different angles through the use of kinematic joints, presenting, as in Goytisolo et al. (2001), the power necessary for the required conveyor capacity. Similar expressions are used by Gbasouzor & Owuana (2013) for the design and classification of a piece of equipment for plastics recycling. In addition, due to the configuration of the screw conveyor in the system described in Gbasouzor & Owuana (2013), axial forces are generated along the axis, determined for the appropriate selection of the bearings. Aguilar (1999) develops a better approximation than that obtained by the method proposed in FMC Technologies (2013) for calculating the power necessary to convey material. However, Aguilar (1999) presents no experimental verification or numerical simulation to corroborate the estimated analytical results. In contrast with the aforementioned articles, Yu presents Yu and Arnold’s (1997) mathematical development for determining the necessary torque of a screw conveyor when the feeder size is not negligible, evaluating the results experimentally. Giraldo et al. (2010), present the conveyor system design procedure using the manufacturer’s user manual, including both the power calculation and the simulation analysis with commercial software (SolidWorks®) from one of the paddles installed on the screw conveyor shaft. An analysis similar to that presented in the literature is proposed in the user manuals provided by FMC Technologies (2013). The analysis of completely horizontal equipment is considered in these manuals, while in Goytisolo et al. (2001), the skew of the mechanism is also included.
The mechanical analysis of the screw conveyor is shown in this work, considering, in addition to the power calculation, the reaction force and stress distributions in the mechanism under different operating conditions. The main objective of this development is the analytical and numerical classification of the equipment in order to determine the feasibility of optimizing the conveyor system, or failing that, a redesign of the axis in fault condition.
Analytical model of the screw conveyor
Test system
The test system analyzed consists of a “Salt screw conveyor,” which includes a screw conveyor 7.10 m in length, with an axis diameter of 0.08890 m and an outside diameter of 0.29528 m. The entire system is made of 316 food grade stainless steel. It also has two commercial (SNR®) flange-mounted bearings at both extremes and two intermediate supports, custom manufactured by the company in which the conveyor system is located. An enlarged view of the test system installed in the field is shown in Figure 1.

The southern Sonoran and northern Sinaloan valleys are the entities that produce the greatest quantity of grains on a national level, primarily in wheat, maize, and beans; therefore, the region has different companies for the transport and processing of these products. In regional companies, the use of screw conveyors is common for transporting the product to the different processing stages, as well as in storage and distribution. The particular analysis case was carried out in a salt processing company. However, in these regional companies, it is a common practice to carry out adaptions empirically, making trial-and-error corrections, which would generate unscheduled downtimes when new faults arise, as well as oversizing in the power and transmission systems, which would result in reduced efficiency. During the research into the state of the art, different researchers and commercial manufacturers focused on analyzing the power capacity necessary for these pieces of equipment, considering a negligible feed gradation and not taking into account the stress analysis on the main components, such as the screw conveyor, the supports, and the trough. As regards the area of opportunity, due to the regional power, the need to gain a deeper understanding of the analytical development is clear (power and component stress calculation) to better understand the phenomenon and carry out the redesign of different screw conveyors, knowing a priori how they will affect the mechanical redesign the different parameters of the screw conveyor, such as number of supports, separation between supports, winding pitch of the screw conveyor, external pitch diameter, shaft diameter, support types, materials used, and granular material to transport. The first part of the research is focused exclusively on the analytical study of screw conveyor power and stress. As well, even when there is a wide variety of design of shafts using the Finite Element Method as presented in the research of Xioming & Davis (2001), Engel & Sara (2017) and Kursat et al. (2018), to name a few, the simulation does not allow identifying a priori the degree of affectation in the distribution of stresses and transport capacity of the aforementioned parameters.
Power calculation
Based on the screw conveyor design parameters and the type of material to be conveyed, it is necessary to compare salt conveyor capacity with the information from the company. This is done using the expression presented in Goytisolo et al. (2001):
where
Q |
= conveyor capacity in kg/h |
D |
= outside diameter of the screw conveyor in m |
d |
= Axis diameter in m |
S |
= screw conveyor screw thread in m |
Ω |
= rotational speed of the screw conveyor in rpm |
f |
= adimensional coefficient of the system feeder |
ρ |
= density of the material |
cβ |
= adimensional skew factor of the system |
An expression similar to Equation (1) is presented in Chakarborthy & Mthta (2016)). Determination of salt density was made using the manual presented in FMC Technologies (2013). The field data from Table 1 are used to calculate the conveyor capacity of the test system analyzed.
Table 1: Field data from the test system
| Parameter | Value | Unit |
|---|---|---|
| Engine power | 7.45 | kW |
| Rotational speed of the screw conveyor | 121 | rpm |
| Outside diameter of the screw conveyor | 0.29528 | m |
| Axis diameter | 0.08890 | m |
| Pitch of the screw conveyor | 0.2794 | m |
| Skew | 3 | Degrees (°) |
| Filling coefficient | 0.25 Chakarborthy & Mthta, 2016 | - |
| Skew factor | 0.9359 Chakarborthy & Mthta, 2016 | - |
The data from Table 1 from Chakarborthy & Mthta (2016) were used to determine the skew factor, and the following expression was obtained through a quadratic polynomial adjustment:
with which it was determined that the system’s conveyor capacity is,Q=25 Ton/hr, indicating that the equipment is underutilized, as the experimental maximum capacity estimated by the company is.18 Ton/hr.
In conjunction with the conveyor capacity analysis, Aguilar (1999) proposes considering the rotational speed recommended in order for the system to work safely. The rotational speed analysis is presented by Goytisolo et al. (2001), using the following expression
where it is found that the minimum rotational speed of the system is
Once the speed range for safely operating the system has been determined, an analysis is carried out for the power calculation, implementing the following expressions:
where
P H |
= horizontal conveying capacity, with Q expressed in Ton/hr |
P N |
= power of the unloaded screw conveyor |
P ST |
= power necessary due to the skew of the conveyor |
L |
= length of the axis between bearings |
λ |
= friction coefficient (with a value between 2.5 and 4 for the proposed system) |
The power calculation performed in FMC
Technologies (2013) considers that the screw conveyor is completely
horizontal, and thus, the term
Table 2: Test parameters and powers calculated for the analyzed salt conveyor system
| Parameter | Value | Unit |
|---|---|---|
| L | 7.10 | m |
| λ | 4 | - |
| ϕ | 3 | Degrees (°) |
| PH | 1.9416 | kW |
| PN | 0.1048 | kW |
| PST | 0.0254 | kW |
In this work, the material to be conveyed is salt with excess humidity, and
therefore, λ=4. In addition, the total length of the axis between bearings is
L=7.10mts. From Table 2, it can be seen
that under the proposed working conditions, the total conveyor capacity is
P=2.0718 kW. FMC Technologies (2013)
recommends using a power correction factor of 42% of the calculated power so
that the system can run smoothly
The screw conveyor analyzed has an attached belt drive system and a Model TXT 315
gear speed reducer. Thus, the efficiency of the conveyor system must be
considered (
where it can be seen that ηTrans= ηRedutor ηBandas.
As the transmission consists of a system of helical gears, belts, and pulleys, an efficiency of ηTrans=98.5% is estimated, coinciding with that reported by Richard & Keith (2012). Thus, a recommended power of Preq=2.9867 kW is obtained. It is determined from the estimated power that the power implemented in the test system (see Table 1) is more than double the requirement.
Stress analysis on an axis with four supports
Stress analysis and moment diagram
The free body diagram of the screw conveyor is prepared, as its four supports are in good condition. A hollow shaft of uniform diameter along its entire length is considered for the static analysis, as presented in the following Figure 2.
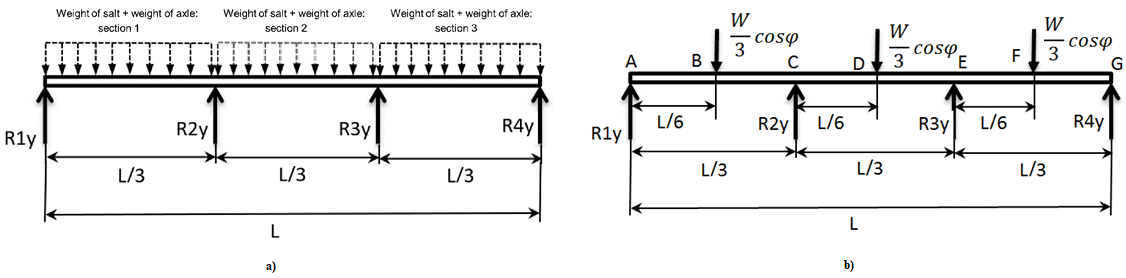
As it is a statically indeterminate system, the three-moment method is used, as presented by Ferdinand & Andrew (1982), to determine the reaction forces on each support, where the moments in the internal supports are given by
where L1=L2= L3L/3, while the reaction forces are given by the following expressions:
Where W = Wsal + Weje represents the total weight, which is numerically is W = 5.7291N. This weight represents the mass of the helix and the shaft (obtained through the use of a CAD tool), as well as the corresponding weight of the salt, considering that the trough has 80% of the capacity total, as recommended in FMC Technologies (2013). This is considered a three-degree skew angle. As the total weight of the screw conveyor is 7.10 m, it is clear that the reaction forces were R1=667.4817, R2y=2.1932E3N, R3y=2.1932E3N , and R4y=667.4817N.
The system shown in Figure 2 was also modeled using ANSYS® Finite Element software, with the aim of validating the analytical process utilized. The Solid186 and Surf154 elements were used for modeling, with a total number of 28,256 elements and 197,952 nodes. This allowed determining that the reaction forces were R1y=712.31N, R2y=2.166E3N, R3y=2.040E3N, and R4y=802.15N, obtaining a respective difference of 6.29%, 1.25%, 7.42% ,and 16.00% for each reaction, compared analytically with the results.
During the operation of the conveyor system, the two most commonly generated faults are 1) the rupture of one or two supports and 2) the rupture of the screw conveyor shaft in the vicinity of the shaft section change (the same as are found near the supports). To determine the moment diagram in each section of the system, the following expressions are used:
which is used to obtain the moment diagram along the screw conveyor, as shown in the following Figure 3.

In Figure 3, it can be seen that the movement values applied to the system are concentrated in the vicinity of the supports. It is important to consider that a hollow constant-diameter shaft is used for the analytical development.
Stress distributions along the axis
To know the integrity of the screw conveyor axis, the stress concentration is determined using rate-distortion theory and the von Mises method presented by Richard & Keith (2012). Considering flat stress-strain and a hollow shaft results in
The analytical calculation has a power of P=2.0719KW and an angular speed of 121 rpm, with which a constant torque of T=163.5139N-m is determined along the axis. The stress-strain diagram is obtained using Equation (19), as shown in Figure 4.
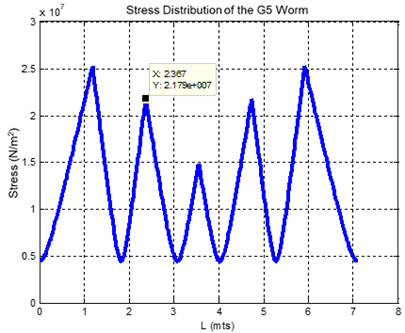
From the results obtained analytically, it is clear that the maximum vibration amplitude does not occur at the junction points where the intermediate supports are located; however, elevated peak stress-strains do occur. Considering 316 stainless steel for this case analysis, it can be seen that the safety factor considering the stress peak is F.S=6.80, while through Finite Element, F.S=6.94, representing a difference of 2.05% between the safety factor found analytically and that found through simulation. With these results, it can be seen that the shaft in these operating conditions presents no problem. Experimentally, however, there are conditions in which the system reaches the critical fault along the axis. In order to know the operating condition that causes the experimental fault, the case study for a fracture in one of the intermediate supports is presented in the following section.
Stress analysis on an axis with three supports
Force analysis, moment diagram, and stress
According to the information provided by the company, the equipment has had only one fault in its intermediate supports in 25 years of functioning. Therefore, the second case study is presented on a fault in one of the two intermediate supports, considering the diagram in Figure 5.
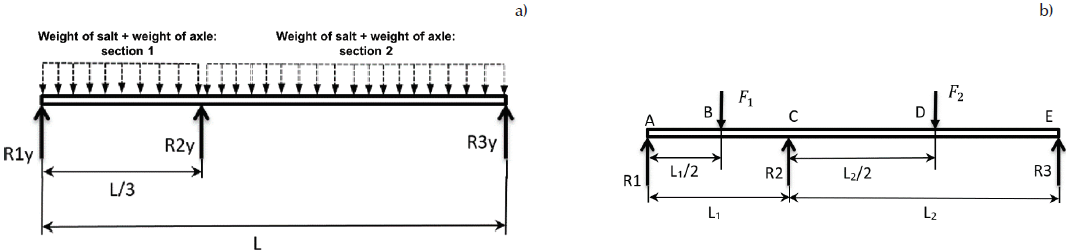
Figure 5: a) Salt distribution with a fracture in the intermediate support, b) diagram of a screw conveyor with three supports
Using the double integration method for the determination of this statically indeterminate system results in
Considering that F1=W/3cosφ, F2=2W/3cosφ, the skew angle is 3 degrees, W=5.7291N, and the total length of the screw conveyor is 7.10 m, the reaction forces obtained are R1=852.30, R2=3038.92N, R3=1856.50N
As with the four-support case, the system shown in Figure 5 was modeled using ANSYS® Finite Element software and Solid 184 and Surface 154 elements, with a total number of 1,027 elements and 6,537 nodes, with the purpose of revalidating the analytical process. For the numerical study, the estimated reaction forces were R1=729.57N, R2=3109.9N, and R3=1881.8N, obtaining a respective deviation of 16.82%, 2.28%, and 1.34% in relation to the results obtained analytically.
On the basis of the results obtained during the analysis, some interesting observations can be made regarding what occurs when one of the supports in the screw conveyor fails, as presented in Figure 5. For the reaction in support R1y, with respect to the first case, there is a 27.69% increase in force and the direction has the same effect as the weight exerted by the salt and the axis. Support R2y shows an increase of 38.56%, while support R3y presents a decrease of 15.35%, considering the results obtained analytically.
The corresponding moment equations for the different sections presented in Figure 5 are shown below:
The moment diagram along the screw conveyor is obtained using Equations (23) to (26), as shown in Figure 6.
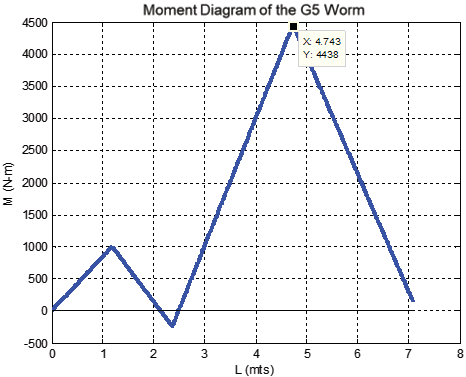
In Figure 6, it can be seen that the maximum moment occurs in the section where the missing support is located. Figure 7 is obtained using Equation (19) to calculate the stress distribution.
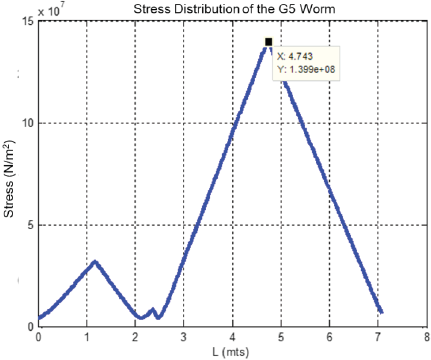
Considering the maximum stress presented in Figure 7, there is a safety factor of F.S.=1.23 at the maximum stress concentration point, which represents a decrease of 81.9% with respect to the safety factor when the screw conveyor works with all four supports. The Finite Element simulation analysis generates a F.S. of 2.49, representing a difference of 102% with respect to the analytical analysis.
With the rupture of one of the internal supports in the screw conveyor axis, there is a 453.10% increase in the stress distributions in the region missing the support, considering the results obtained with the analytical expressions. The previous analysis cases consider a constant diameter hollow shaft when the 4 supports function correctly and the particular case where the rupture appears in one of the intermediate supports. There is no specific documented case of a rupture appearing at either extreme of the supports.
An analytical solution can be obtained in simple structures such as uniform section beams or shafts; however, for complex structures, or in shafts with section changes, the use of numerical solutions such as the Finite Element Method is recommended to identify stress-concentrator areas. Neupane (2014) presents a comparative analysis between the analytical method and various Finite Element tools, such as ANSYS Workbench 15.0, Creo Simulate 2.0, etc. The results from simulations under different classic beam examples present differences ranging from 4 to 16.6%, depending on the Finite Element tool used. A similar study was carried out by Ragbe (2016), which considered a section of uniform diameter tubing subjected to an internal pressure. The analytical results and ANSYS results were compared, obtaining a difference of 2.2%.
However, for the case of interest, in which there is a fault near a section change, analytical development does not allow knowing the stress concentrations in these concentrator areas necessitating the use of Finite Element. For this reason, the study was carried out taking these changes into consideration, as shown in the following Figure 8.

Based on the analytical results shown in Figures 4 and 7, the maximum stresses are found at the bushings. In addition, as can be seen in Figure 8, the section view of the screw conveyor shaft in the field shows a section of solid shaft coupled by welding to hollow sections. This drastic section change presents elevated stress concentrations, a condition that must be analyzed numerically. Figure 8 shows the stress concentration in the critical sections identified.
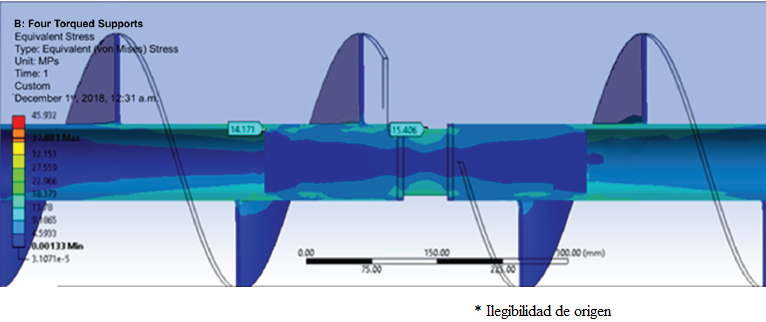
In Figure 9, stress concentrations can be seen in the vicinity of the section change; however, they are below the yield strength of the stainless steel, generating a safety factor of 11.18. Under these working conditions, the equipment presents no operational problems. The need to redesign for mechanical optimization of the equipment can even be established. Likewise, a second operating condition is analyzed numerically when a fault occurs during the operation corresponding to the rupture of one of the intermediate supports (Figure 5), as presented below. For the case shown in Figure 9, the reaction forces obtained are the following: R1y=685.57N,
R2y=2553.20N, R3y=2128.50N, and R4y=653.99N, which represents a difference of 2.63%, 2.66%, 3.03%, and 2.06%, respectively, with respect to the analytical result.

From the results obtained in Figure 10, a considerable increase (315.40%) can be seen in the stress concentration with respect to the behavior in Figure 9. This represents a safety factor of 2.68 - a 77.1% decrease in the F.S. Under this operating condition, there is a possibility of fault due to fatigue in the vicinity of the stress concentration. This condition is consistent with the information provided by the company’s maintenance area regarding the shaft rupture when finding one of the bushings fractured. For the case shown in Figure 10, the reaction forces were the following: R1y=953.35N, R2y=2851.1N and R3y=1942.7N, representing a difference from the analytical result of 10.54%, 6.58%, and 4.43%, respectively.
Discussions
The analytical case study of a hollow constant-diameter shaft presented in Figure 2 shows that when the separation between intermediate supports is the same, the reaction forces at the extremes have the same numerical value, as do the intermediate supports.
However, when performing numerical modeling with the Finite Element tool, this pattern is not preserved. For the case analyzed, a difference of between 16.00 and 1.25% was found, which allows validating the results obtained through simulation for the four-support case.
The second case study corresponds to the reaction force distribution across the supports when considering a fracture in one of the intermediate elements in the ideal screw conveyor. For the simulated case, a difference was found in the range of 16.82-1.34%, validating the procedure utilized for that particular case.
With the numerical modeling validated, the screw conveyor axis was analyzed, considering the screw along the shaft, as well as the variations in diameter along its length. For the corresponding four-support case, a difference of 2.63%, 2.66%, 3.03%, and 2.06%, respectively, was obtained in each reaction, while for the second case study, there was a difference in reactions between the analytical and Finite Element methods of 10.54%, 6.58%, and 4.43%, respectively.
Conclusions
A piece of salt conveying equipment with a 25 ton/hr capacity has presented systematic problems for more than 20 years of operation on a salt production line in a regional company in the southern region of the state of Sonora, Mexico, with an annual capacity of 150,000 tons. This critical equipment generates unscheduled downtimes in the production line for up to 8 hours.
This work presents a methodology for the analytical study of a granular material conveyor system. For this, a mechanical study was carried out on the equipment presenting the greatest problem, conducting an analytical study that allowed determining both the recommended theoretical conveyor capacity and axis speed, as well as the necessary power. The aforementioned analysis is commonly referenced in bibliographies found in the state of the art. However, no study allows identifying the problem presented in the equipment under study. Hence, this procedure is proposed to determine the reaction forces in the supports and the stress distributions along the screw conveyor. The study encompasses the functioning of the equipment immediately after maintenance and with the four supports in good condition, as well as the specific case of the failure of one of the intermediate supports.
However, the current analytical development presents different limitations when considering complex sections during the analysis of a shaft with a non-uniform section, as is the specific case study. In light of the above, a numerical study was carried out, implementing the finite element analysis and obtaining the stress concentration at the critical points along the equipment when working with a full load. Validation of the analytical results through simulation is presented for the cases of screw conveyors with three supports and with four.
From the power analysis, it was found that the necessary power is 60% lower than that currently installed, corresponding to a 7.45 KW electric motor working at a speed of 1,800 rpm. On the other hand, the stress analysis along the axis for four supports (without considering the screw in the screw conveyor shaft) allowed estimating a safety factor of 6.8 in the critical points near the supports. For the numerical case, it was observed that when taking the screw into account, the support load capacity is increased, achieving a safety factor of 11.6. This demonstrates that the screw generates a greater bending load capacity for the screw conveyor. In addition, Finite Element Analysis allows knowing the stress concentration at critical points of interest, such as where the fractures occur, according to information obtained from the company. Through this analysis, significant stress concentrations were found in the joint sections where the numerical intermediate supports with short sections of solid shaft are located, as presented in Figures 9 and 10. For the case with four supports, there was no fracture problem, even in the critical sections where maximum stress concentrations occur.
The equipment analyzed contains three salt mills in the upper part, located in the central part between supports; however, a periodic tapping was observed in the chute and screw conveyor during the field study, due to the presence of considerably large rocks. This intermittent applied force generates sudden elevated stresses, although a safety factor of this magnitude does not represent a problem.
In the case study that considered a fracture in one of the intermediate supports (the section with the abrupt section change), the stress concentration was increased by 341.2% with respect to the same simulation with four supports, obtaining a reduction of 77.3% in the safety factor, which coincides with the fault condition present in the shaft rupture. This allowed finding an elevated correlation between the maximum stress concentration and element fracture, which in turn allowed issuing the recommendation to change the intermediate supports to avoid fracture and eliminate the previously occurring fracture.
Finally, based on the results obtained, it is possible to establish the feasibility of the methodology presented for the analysis of a granular material conveyor system based on the screw conveyor and have it be applicable to the redesign of the different salt conveyors when the feeder in these systems is negligible.

