


 nueva página del texto (beta)
 Inglés (pdf)
 Artículo en XML
 Referencias del artículo
 Enviar artículo por email
 Citado por SciELO
  Similares en
SciELO
Similares en
SciELO 
 Permalink
Introduction
Wind energy is one of the oldest alternative energy sources used by mankind; this energy is mainly used to generate electricity through wind turbines. Being a renewable and clean energy, wind helps to reduce emissions of greenhouse gases by replacing energy sources based on fossil fuels, providing green energy.
The wind turbine market has experienced significant and steady growth in recent years with the construction of high-capacity turbines (Chen, 2009), besides wind turbine operating costs have reduced substantially, the reliability and availability of this equipment have been enhanced, and consequently the installed capacity has been also improved by integrating wind farms (Malinowski et al., 2015).
The economic use of wind resources requires wind farms to be installed in remote sites with high average wind speeds (Ullah, 2005; Kan et al., 2005). The profitability of wind farms depends on many factors, one of the most important is their adequate operation which requires a proper maintenance (Yang et al., 2008a y 2008b; Doguer and Strackeljan, 2009; Hassan et al., 2012; Wang and Jin, 2011).
Diagnosis of incipient faults in mechanical-electrical machines, such as wind turbines, can reduce repair and maintenance costs, as well as the costs associated with unscheduled downtime of the power generation process (Malinowski et al., 2015; Nilsson, 2007; Ye et al., 2009; Lu et al., 2009). In addition, this diagnosis is crucial to maintain and improve the wind turbines efficiency and the power generation process (Baquan, 2011).
The maintenance strategy, reactive, preventive and predictive, in wind turbines aim the continuous improvement of the production system as well as prolonging the equipment life, requiring, among other factors, the constant measurement of mechanical vibrations (Cao et al., 2012; Tavner and Xiang, 2007). It is well-known that most of the problems in wind turbines are provoked by mechanical vibrations (Srinivas, 2004; Zhiqiang et al., 2009; Fitzgerald et al., 2010).
Considering the traditional predictive techniques, those based on vibration analysis are the most commonly used, allowing to know the status of the equipment and control their availability (Wang et al., 2009). Hence, there is diverse equipment available that perform vibration analysis in wind turbines, such as: Analyzer Pro 2130, SFK Preditec Analyzer CMVA 65, Pruftechnik VIBNODE, IDEAR Vibraspec. For instance, VibraSPEC enables remote monitoring and diagnostics because of their ability to enable remote communication, however, it has a high cost and requires specialized users to construe the provided information.
In literature, diverse research papers analyze failures caused by different problems in wind turbines, such as damaged blades, dirt or resonance; the axis also represent problems if it is unbalanced, misaligned, unstable or with curvatures or scratches (Gong and Qiao, 2010).
In Shi (1992) and Liu and Jia, (2004), authors state that the origin of an imbalance can be derived from several causes, such as: material deformation, worn parts, wrong assembly, impacts or detached parts. As for gears and bearings, faults can arise due to defective teeth, misalignment, wear and/or instability. Lubrication, pulsation, cavitation, resonance, design flaws, external noise, and asymmetry of the rotor and stator are other reasons that can cause failures (Srinivas and Arumugam, 2004; Zhang and Wang, 2010).
The dynamic behavior in the wind turbine, due to vibration frequencies of the rotating blades, wind turbine structure and fixed tower, are highly important in the design stage when the machine is under lateral loads (Zhiqiang et al., 2009; Fitzgerald et al., 2010). This is why many researchers have focused on developing methods for predicting the natural frequencies of vibration in order to detect failures in the system (Wang and Wang, 2011; Uys et al., 2007; Malinowski et al., 2015; Wang and Jin, 2011).
In recent years, there has been an important improvement in how turbines crucial parameters are monitored during their operation.
However, it is still common that measurements (usually average values) are transmitted through the SCADA systems to the control room, where engineers are responsible for analyzing the data to determine an abnormal behavior. This monitoring system may be sufficient to detect failures, however, in order to predict failures in real time, data analysis techniques must be used (Swiszcz et al., 2008).
This paper presents a system that analyzes mechanical vibrations, online, to perform the early fault detection and localization in wind turbines. The system performs the mathematical analysis of the vibration signals obtained by a 3-axis vibration sensors array, allowing specifically to determine when and where the failure occurs, besides, the system displays the information in a friendly graphical interface, developed in LabView, allowing non-specialized personal to understand the obtained data.
The system is easy to implement due to the low computational cost required to perform the failure detection tasks. The early fault detection provided by this system can allow users to plan preventive maintenance, extend the life of the wind turbine and improve the system efficiency.
System development
Vibration analysis system
The ability to measure and monitor the vibrations of different systems, such as wind turbines, is important from a research perspective as well as from industrial applications such as adaptive control, monitoring, optimizing processes and quality control (Lita, 2005).
Every rotatory machine deteriorates with its use. This deterioration can be measured and quantified through the vibrations produced by the turbine. Most of the commercial tools used to analyze vibration signals are based in piezoelectric transducers and spectral analysis.
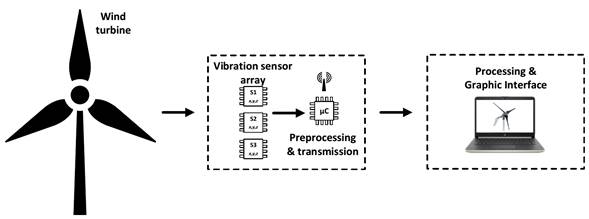
The block diagram of the system used in this research work to analyze mechanical vibration signals is shown in Figure 1. The system was designed in order to detect failures in domestic wind turbines and it is constituted by two main components: acquisition and conditioning hardware (DAQ system) and processing software (Processing & GUI display).
Acquisition and conditioning hardware
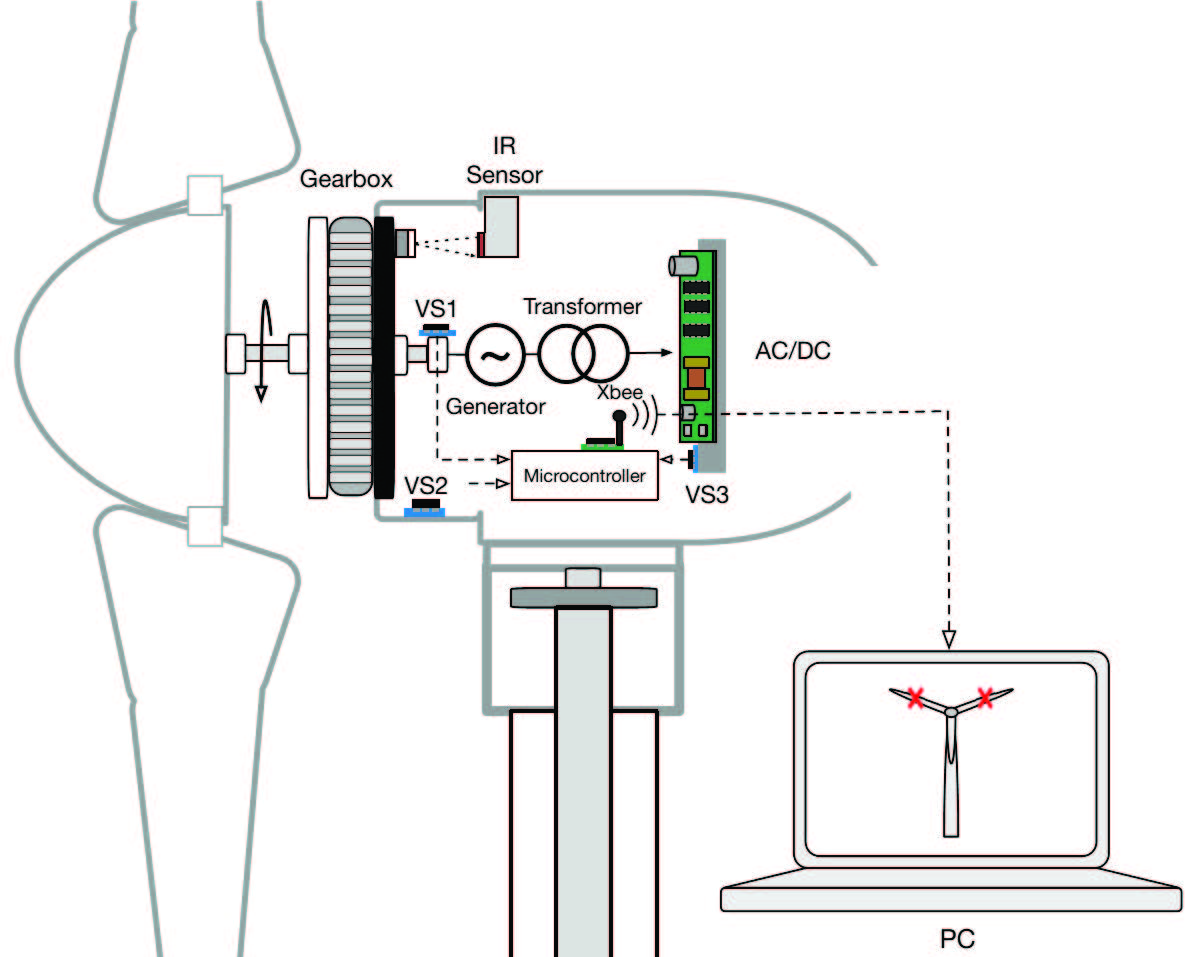
The system hardware, presented in Figure 2, is formed by one retro-reflective sensor, an ADXL 345Z 3-axis vibration-sensor array (3 sensors), XBee transmission and reception modules and an ATmega microprocessor to acquire and condition the different signals required to analyze the wind turbine behavior. The specific wind turbine used in this work is the Air 30 domestic type.
Processing software
The software interface performs different tasks in the system, such as: sam pling of the signals acquired by the hardware stage, data displaying in a graphical user interface (GUI) that allows the user to select between different configuration options through a menu, and signal analysis based on Maltab and LabView processing software.
Hardware implementation
The selected components of the acquisition and conditioning hardware stage provide the system with the advantages of versatility, good performance in vibration analysis and low cost.
The hardware section includes four main parts: acquisition of rotational frequency and generated voltage in the wind turbine, acquisition of the 3-axis vibration signals in three different wind turbine parts and signal conditioning to send data to the GUI.
Rotational frequency and generated voltage acquisition stage
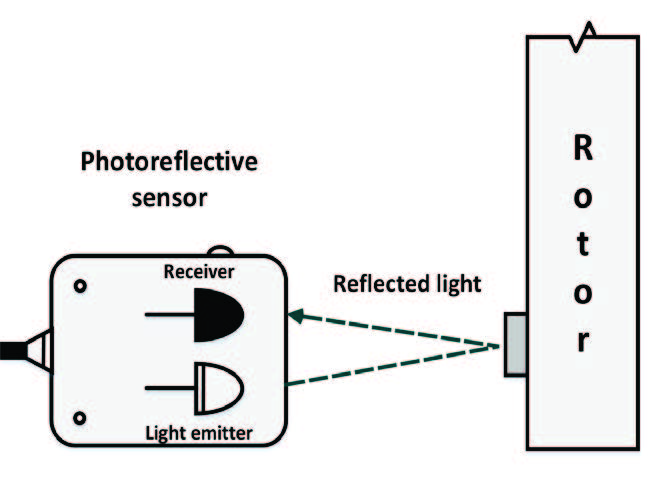
In order to determine how rotational frequency affects the wind turbine vibration behavior, as well as to probe if this frequency is linearly proportional to the voltage generated by the wind turbine, a retro-reflective sensor is used.
The retro-reflective sensor uses an infrared LED and a phototransistor located inside the wind turbine to avoid external light disturbances and obtain an optimum reflection signal (Figure 3). The generated voltage, as well as the frequency signal are acquired through the ATmega microprocessor ADC. A 1 kHz sampling time is selected in order to obtain enough data without exceeding the microprocessor capabilities.
Obtained measurements demonstrate that in the Air 30 domestic wind turbine the frequency is directly proportional to the generated voltage, so a linear relationship is considered in this paper.
3-Axis vibration signal acquisition stage
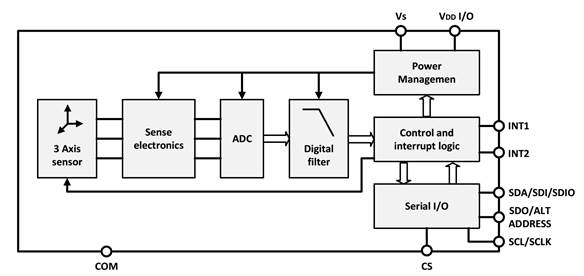
In the signal acquisition stage an ADXL345Z 3-axis vibration-sensor array was used in order to obtain vibration data to be analyzed by the signal processing stage. The ADXL345Z sensor functional diagram is presented in Figure 4.
Three different 3-axis sensors are located in external and internal parts of the wind turbine in order to obtain not only the vibration signal related to the chosen locations, but also the differential correlated signal between sensors.
The selected locations were: sensor 1 (VS1) at the wind turbine CA-CD con verter, sensor 2 (VS2) at the wind turbine housing and sensor 3 (VS3) at the wind turbine rotor, as can be seen in Figure 5 (Figure 2 zoom in).
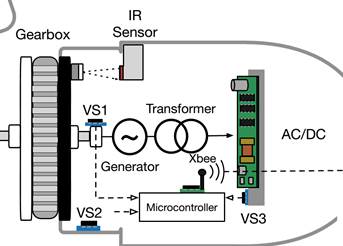
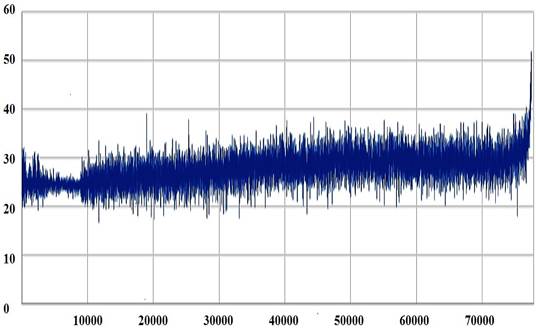
Figure 5 shows, as an example, the vibration signal obtained by sensor 1 in the Z axis.
Signal conditioning and wireless data transmission
The system consists of an ATmega168 microprocessor which collect data from the sensors, gather information and send it through and XBee RF transmitter module to the XBee receiver. The microprocessor also has terminals to connect with the retro-reflective sensor to obtain the rotation frequency, the module has a switch to be turned off in order to save energy.
Software implementation
Software is divided in two main parts developed in MATLAB and NI LabView software: graphical user interface, GUI (graphical display of processed data in a Windows environment) and processing software (acquisition and processing of vibration signals from the wind turbine).
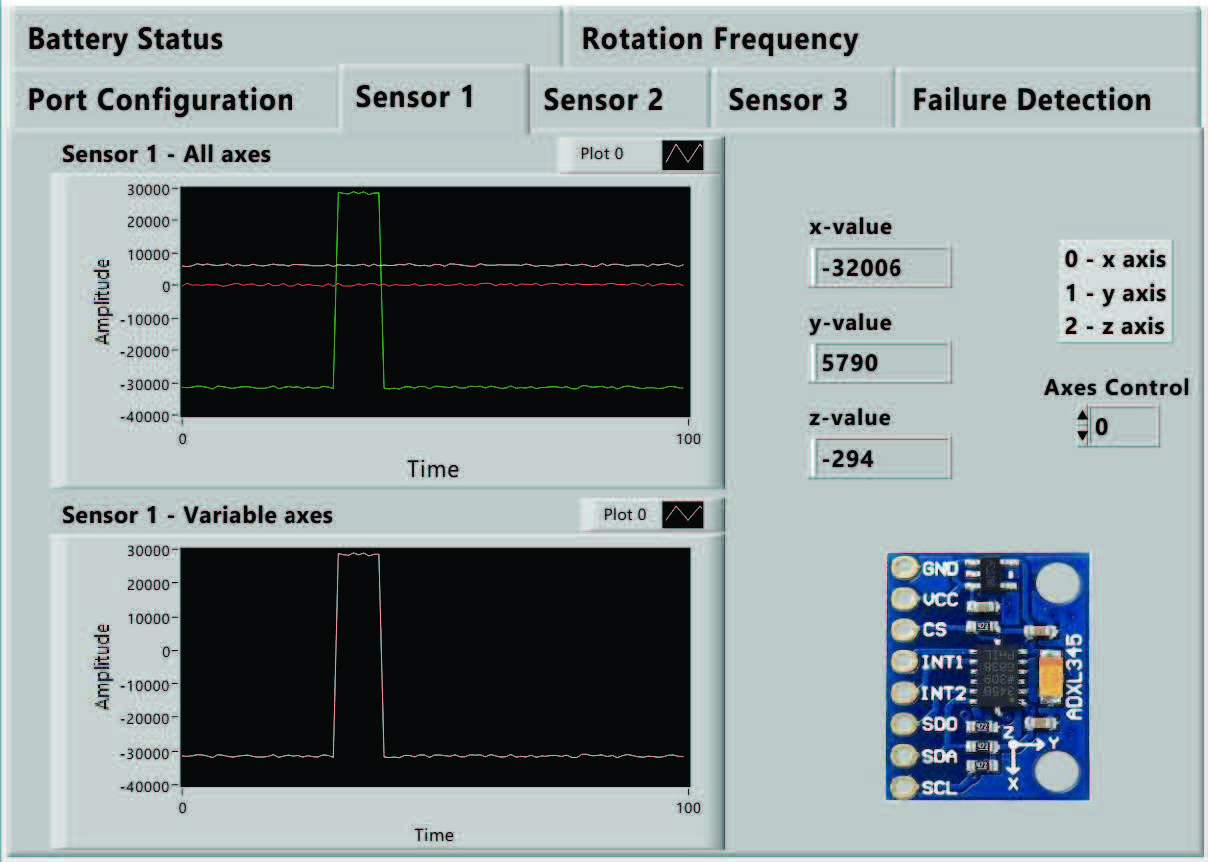
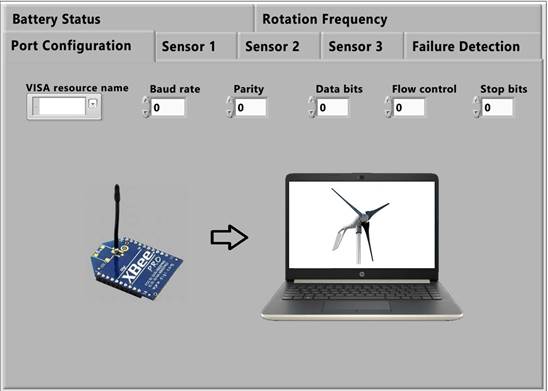
User interface software
The user interface software performs the following functions: Graphical user interface (Figure 7), Options menu (Figure 8) and Fault Detection and Isolation routine (Figure 9). The main part of the developed system corresponds to the Fault Detection and Isolation stage.
Fault Detection and Isolation (FDI) stage
The Fault Detection and Isolation (FDI) stage is responsible for acquiring and processing the vibration, voltage and frequency signals to estimate the vibration amplitude depending on the frequency and the location of the fault.
The processing software was developed in LabView, using C as auxiliary language. The first task of this software is to determine the failure signature in order to have reference values to determine failures. This signature determina tion task is divided into the following stages: Sensor readings and data analysis, frequency ranges determination, average calculation and failure signature determination.
Figure 10 shows the failure signature determination block diagram. This dia gram includes the acquisition of the vibrations signals obtained by the 3-axis sensors. The average values of the vibration measurements are obtained to be compared to a signature reference value in order to determine the presence of a failure.

The failure signature reference value is obtained by analyzing data in order to obtain specific frequency ranges and specific 3-axis vibration magnitudes correlated to specific failures.
In order to guarantee the adequate processing of the vibration data a total of 770,000 samples were acquired during a whole day in order to observe the magnitude changes in the vibrations signals with respect to temperature changes on the day, as well as changes in humidity and thereby variations in the air density.
There was a clear variation in the air density and humidity during the day, these changes consequently affect the air density. Accordingly, there are changes in the magnitude of the vibration signals corresponding to density and humidity air changes. The adequate operating range of the developed system was determined at 40-42% air humidity and 1.17-1.159 air density.
In order to determine the best processing signal method for this case of study, three different methods were analyzed: statistical, FFT (Fast Fourier Transform) and Wavelets.
Statistical method
The statistical analysis was developed by considering the following frequency ranges in RPS: 3 - 3.2, 3.3 - 3.6, 3.7 - 3.9, 4 - 4.2, 4.3 - 4.6, 4.7 - 4.9, 5 - 5.2, 5.3 - 5.6, 5.7 - 5.9. These ranges were determined by analyzing the best failure dis crimination ranges as well as the total frequency range where the vibrations signals are affected by failures.
Different failures were emulated in the wind turbine in order to obtain the corresponding vibration response: broken blade, damaged blade, loose blade, front cover without left bolt, front cover without upper bolt, front cover without right bolt, front cover without left and right bolts, front cover without left and upper bolts, front cover without upper and right bolts, front cover without bolt, base without bolts and different combination of these failures. These failures were selected because these are the ones that most affect the wind turbine mechanical vibration.
Through the statistical analysis the average values corresponding the vibra tion magnitude of these failures were obtained. The average value, also known as arithmetic mean, AM, is obtained by (1).
where N is the total number of samples of the vibration magnitudes, h k , measured by the system.
As an example, Table 1 presents and extract of the data corresponding to the vibrations magnitudes measured in the 3 - 3.2, 3.3 - 3.6 and 3.7 - 3.9 RPS frequency ranges, by sensor 3 under the broken blade failure.
Table 1: Sensor 3. Average vibration magnitude corresponding the broken blade failure. Frequency ranges: 3 − 3.2, 3.3 − 3.6, 3.7 − 3.9 RPS
| Frequency (RPS) | ||||||||
|---|---|---|---|---|---|---|---|---|
| 3-3.2 | 3.3-3.6 | 3.7-3.9 | ||||||
| x2 | y1 | z1 | x2 | y2 | z2 | x3 | y3 | z3 |
| 93.21 | 196.46 | -117.93 | 94.04 | 195.27 | -117.71 | 93.94 | 196.58 | -117.06 |
| 93.44 | 194.76 | -117.96 | 93.93 | 195.37 | -117.66 | 93.47 | 196.17 | -116.83 |
| 93.36 | 195.02 | -117.82 | 93.86 | 195.54 | -117.42 | 93.25 | 196.02 | -116.76 |
| 93.49 | 194.96 | -117.48 | 93.87 | 195.55 | -117.36 | 93.42 | 195.92 | -117.01 |
| 93.48 | 194.71 | -117.38 | 93.92 | 195.59 | -117.33 | 93.31 | 195.58 | -117.11 |
| 93.50 | 194.87 | -117.33 | 93.94 | 195.09 | -117.18 | 93.31 | 195.68 | -117.11 |
| 93.50 | 194.97 | -117.36 | 93.92 | 194.98 | -117.20 | 93.38 | 195.52 | -117.07 |
| 93.57 | 195.12 | -117.20 | 93.81 | 195.09 | -117.33 | 93.47 | 195.63 | -117.15 |
| 93.60 | 195.14 | -117.24 | 93.79 | 195.02 | -117.20 | 93.53 | 195.68 | -116.96 |
| 93.66 | 194.67 | -117.24 | 93.63 | 195.18 | -117.24 | 93.53 | 195.72 | -116.96 |
FFT (Fast Fourier Transform)
A physical process can be described either in the time domain, by the values of some quantity h as a function of time t, e.g., h(t), or else in the frequency domain, where the process is specified by giving its amplitude H as a function of frequency f, that is H(f), with - ( < f < (. Both representations are related by means of the Fourier Transform equations, shown in (2).
Considering a discrete time, the Fourier transform is calculated through a summation of the discrete function h k and denominated discrete Fourier transform of the N points h k . The DFT is expressed as (3).
The DFT calculation can be optimized by considering W as the complex number defined by (4).
Resulting in the Fast Fourier Transform defined as (5).
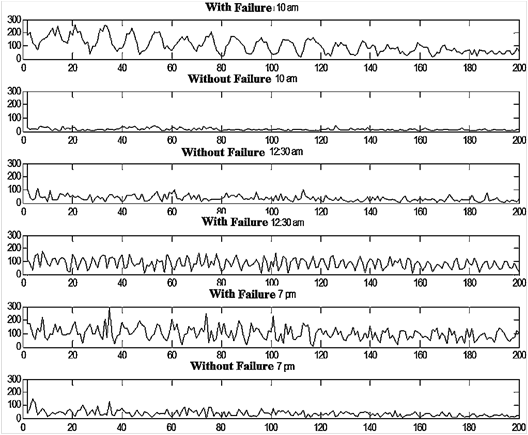
In this method, the MATLAB FFT tool was used to analyze the data, sam ples were obtained with and without failure at three different hours of the day to demonstrate the magnitude variations in the vibration signals due to the faults, as well as its dependency on the environmental conditions.
As can be seen in Figure 11, there are magnitude differences between the vibration signals with and without failures, however it is hard to notice a correlation among the fault signals during different times of the day, i.e., the FFT allows to see the magnitude variations in the vibration signals, but it is difficult to identify failures and obtain a failure signature.
Wavelets
The wavelet transform is similar to the Fourier transform (especially to the windowed Fourier transform), the main difference is that Fourier transform de composes the signal into sines and cosines, located in Fourier space, whilst the wavelet transform uses functions located in both, real and Fourier space. The wavelet transform is expressed in (6).
where * is the complex conjugate and ψ is a function chosen arbitrarily to fullfil certain rules.
In this method, the MATLAB wavelet tool was used, with this tool several tests were performed, at different hours in the day, to evaluate if the variations in the vibrations are present.
Figure 12 and Figure13 show that this method obtains similar results to the statistical method, i.e., not only the variations in the vibration signal magnitude due to the environmental conditions are appreciated, but also there are significant differences due to the failures existence.
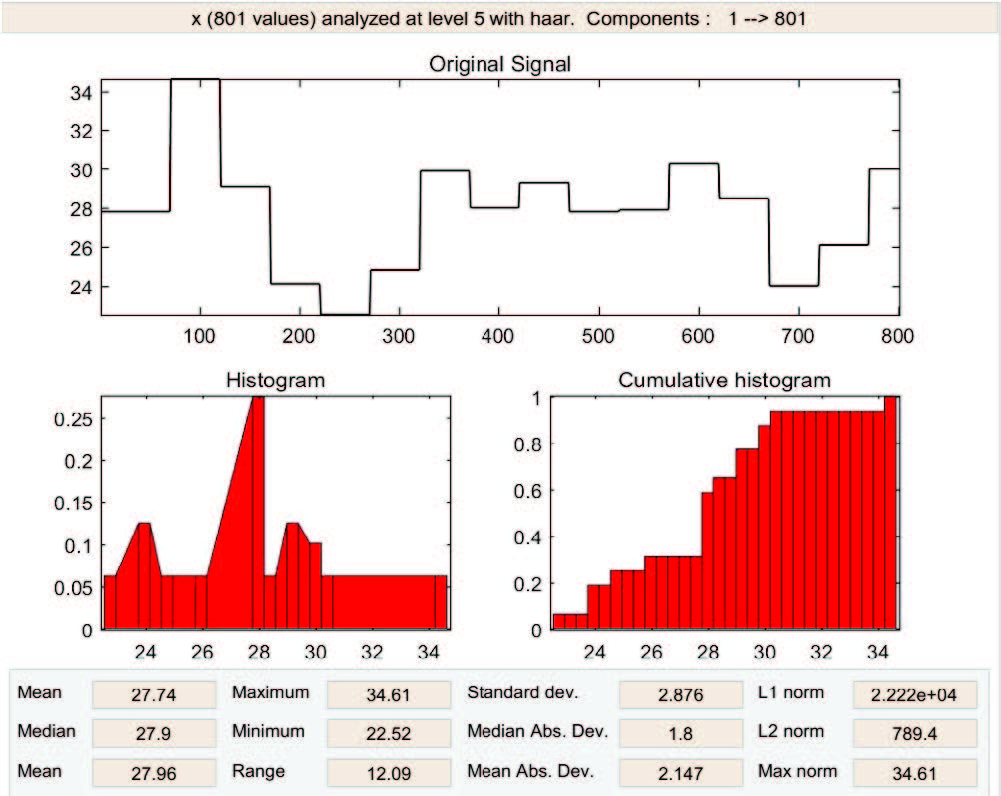
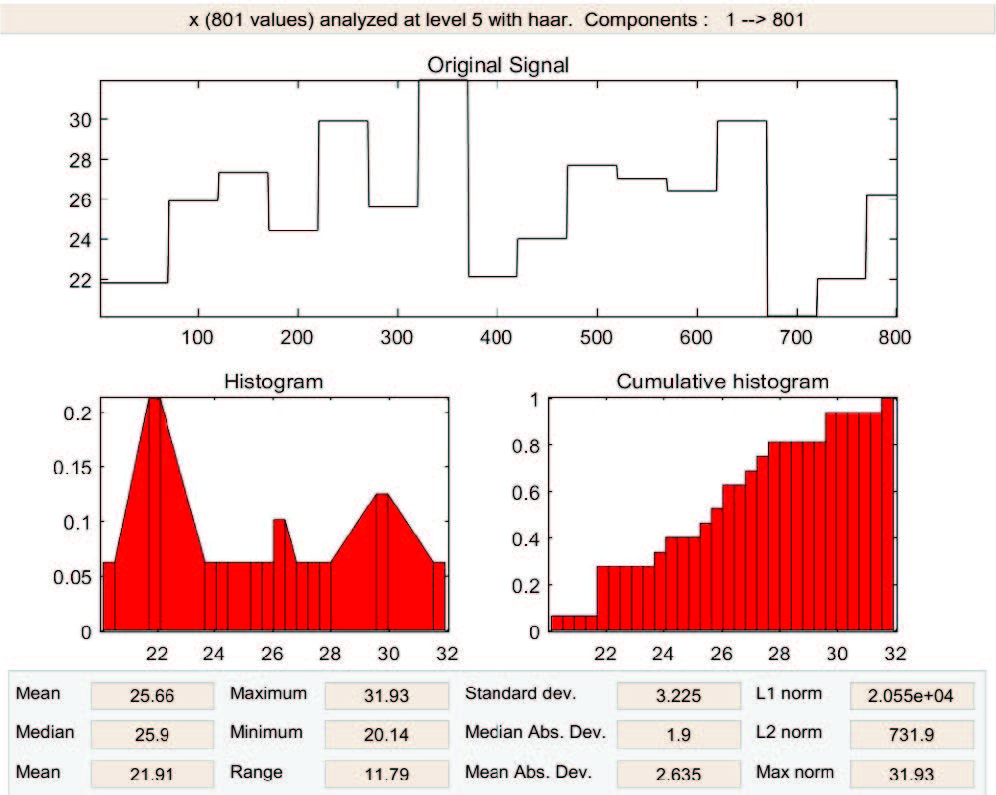
The conclusion is that changing weather conditions produce a significant change in the vibrations of the wind turbine. Considering the 3 different methods used, the statistic is the more convenient, due to its easy implementation and rapid interpretation of data to obtain the failure signature. The FFT method is more difficult to implement and the location of the fault is not accurate or may not be possible. Finally, the wavelets transform method has significant similarity to the statistic method, however, given the complexity of the algorithms, this process is reserved for offline testing only.
Results and discussion
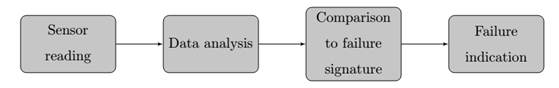
In order to validate the system, the following steps were developed: sensor readings, data analysis and characterization, comparison stage to failure signa ture and failure indication. (Figure 14).
The reference value is obtained from a bank that contains information of the average values of the vibration magnitudes relative to different failures existing in specific frequency ranges (Failure signature).
Online testing uses the tool developed in LabView, considering variations in the magnitudes of the wind turbine mechanical vibrations, delimiting the operation under the indicated environmental conditions.
To validate the system online, when a failure is detected, by comparing the measured and the reference values, if they correspond to a specific failure signature, this is indicated in the graphical interface, showing the specific location of the detected failure. Also, the system is capable to determine the magnitude of the failure according the magnitude of the vibration signal, if the failure is not critical it is indicated by a yellow LED in the graphical interface, otherwise, the LED is red.
The failures used to validate the system were emulated in the wind turbine without implying any physical damage. A total of 11 individual failures and four failure combinations were emulated. Only these four combinations were analyzed because they can be unequivocally distinguished and indicated by the developed system.
In this section the results are obtained by the analysis of the measured values and displayed in the graphical interface. Several test were performed in order to validate the system, as a performance demonstration two tests under different failure conditions are presented in this paper.
One failure detection
In this test the failure corresponding to one damaged blade is emulated. As explained before, the system calculates, online and at the specified frequency ranges, the average of the vibration magnitudes measured by the sensors and compares them to the failure signature.
As can be seen in Figure 15, the system detects the failure adequately and the interface shows that this failure corresponds to a damaged blade.

As the system also determines the magnitude of the failure, in this case the indicating LED is yellow, which means that the fault is not critical but it is necessary to check and evaluate the importance of the failure in the blade. Thus, in order to help the user, in the GUI displays a suggestion, in this case the message “Check”, therefore the user can evaluate and decide if it is necessary to replace or repair the blade.
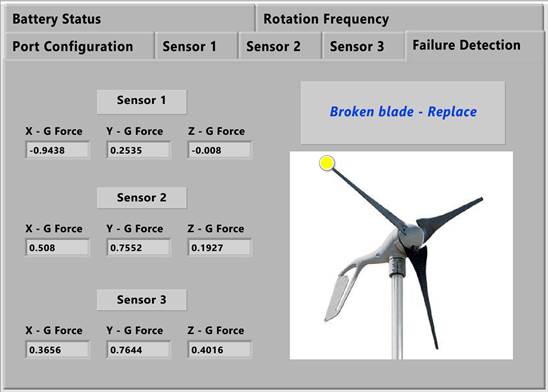
Multiple and simultaneous failures detection
In this case, three different failures are emulated: upper and left bolts loose and breakage in one blade. As shown in Figure 16, the system detects adequately multiple failures, even if they exist simultaneously. The graphical interface shows that the upper and left cover screws are loose and that one blade is broken.
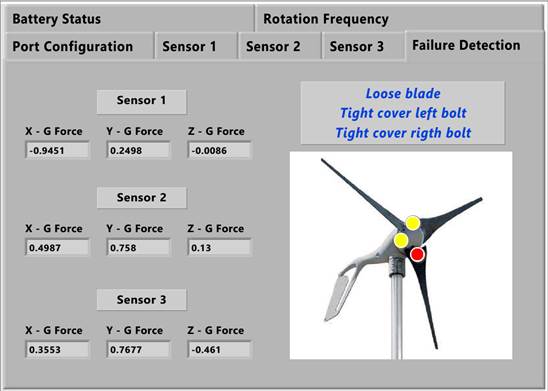
In this case the LED indicator light up according to their severity, indicating that the fault corresponding the red LED is critical and the user must take the necessary corrective actions. The suggestions displayed by the system are: tightening the bolts that hold the blade, tighten the top and left bolts holding the cover to the dome of the wind turbine and replace the broken blade.
Conclusions
Based on the field research data, it is verified the influence of climatic conditions on the mechanical vibrations generated in a domestic wind turbine.
In this work, a system that integrates an analysis tool with practical applications using commercial elements of hardware and software, such as sensors, micro-controllers, PC and programming language is developed.
The developed system fulfills the main objective of providing an option to perform effective faults diagnosis and isolation through a mechanical vibration analysis in wind turbines.
According to the obtained results in different tests, the system presents a good performance to determine failures due to mechanical vibrations on do mestic wind turbines, even at variable frequencies and significant frequency variations, making it a useful tool for analyzing accelerated processes. Also, it is a versatile tool, as it features software and hardware easily modified by the user depending on the application.
The graphical interface provides enough information to perform further analysis if necessary for troubleshooting. This project integrates a statistical algo rithm for detecting faults in a wind turbine by processing mechanical vibration signals, allowing the user to know the functionality of this technique and suggest specific tasks according to the detected failure.

