


 nova página do texto(beta)
 Inglês (pdf)
 Artigo em XML
 Referências do artigo
 Enviar este artigo por email
 Citado por SciELO
  Similares em
SciELO
Similares em
SciELO 
 Permalink
Introduction
Pineapple (Ananas comosus L.) is the leading edible member of the family Bromeliaceae with about 2,000 species, mostly epiphytic and many strikingly ornamental. It is a terrestrial herb from 0.75 to 1.5 m high with a ramification of 0.9 to 1.2 m; it has a very short stout stem and a rosette of waxy formed by sharp-pointed leaves from 50 to 180 cm long; the fruit has up-curved spines on its surface. Pineapples develop from the flowers joining together forming a cone shaped, juicy, fleshy fruit at least 30 cm height, Pineapple is usually treated in order to conserve the fruit by sugar syrup pre-treatment.
Thailand is located in the tropical region of Southeast Asia having annual average daily solar radiation of 18.2 MJ m-2 day-1 (Janjai et al., 2006). Thus, the use of solar energy to produce high quality dried pineapple is in theory viable. Several studies about pineapple drying have been reported (Hossain et al., 2001; Talla et al., 2005; Simal et al., 2007; Kingsly et al., 2009; Ramallo and Mascheroni 2012; Agarry et al., 2013 and Olanipekun et al., 2014), but none of these has researched about solar dryer greenhouse type.
The design of an optimal solar drying system requires setting up particular drying requirements depending on the specific product to treat. Basic parameters including temperature, relative humidity, dimensions and airflow rate should be investigated. The prediction of performance of solar dryer, can be done using simulation models, which have been investigated by John and Sangamithra (2014).
In the current study, the thin layer drying behavior of pineapple in a greenhouse-type solar dryer for village-scale is investigated. Furthermore, the mathematical models that describe the thin layer drying curves are determined by non-linear regression analysis. A large scale greenhouse developed at Silpakorn University, Nakhon Pathom, Thailand was used to dry 1 cm width slices in a temperature range between 25-60 °C with relative humidity between 50-90 %. The purpose of this paper is to provide guidelines to preserve pineapple adequately by solar drying. The mathematical models can be applied in countries that have tropical climate.
Materials and methods
Drying experiments
Experimental set up
Greenhouse-type solar dryer for village-scale is designed and built at Silpakorn University, Nakhon Pathom, Thailand with a parabolic roof structure made from polycarbonate plate, established on a concrete floor: This dryer was used to carry out the experiments of pineapple drying. This is located at 14°01’ 42.5’’ N latitude and 99° 58’ 12.1’’E longitude. The product was placed in a thin layer with a total of three trays arrays. These were placed on single level platforms above floor with enough space in between for loading and unloading the product inside the dryer. A similar solar dryer for village-scale is fully described by Janjai et al.(2009). With three DC fans, operated by a 50-W PV-module, the air is ventilated from the greenhouse in order to remove humidity. Greenhouse solar dryer structure characteristics and dimension, as well as, sensors at correct position to measure temperature, relative humidity and samples weights are showed in Figure 1.

Experimental procedure
Two experiments of pineapple drying were carried out during the month of November 2014. The conditions were the same for both experiments with the exception of the operational days. Pineapple was dried in order to get drying data that were required in fitting mathematical models in order to understand better and then to be capable of improving the solar drying process of pineapple in a greenhouse.
Thermocouples (K type, accuracy ± 2%) were used to measure air temperature in the dryer at different locations. The thermocouple positions both for temperature and relative humidity are shown in Figure 1. Ambient air relativity humidity and drying air flow were measured using hygrometers (Electronik, model EE23, accuracy ± 2%). Solar radiation was measured by a pyranometer (Kipp and Zonen CM 11, accuracy ± 0.5%). A multi-channel data logger (Yokogawa, model DC100) was used to record every 10 minutes a signal voltage from the pyranometer, hygrometers and thermocouples. The pyranometer and hygrometers were appropriately calibrated.
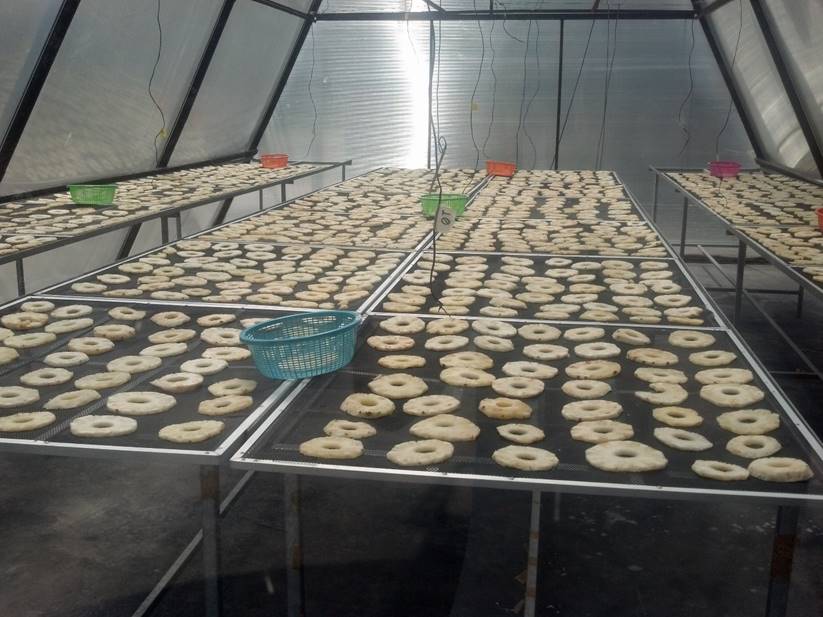
Pineapples utilized in this study were purchased in a local fruit market of Nakhon Pathom Province (Thailand). For each experiment a sample of 100 kg of pineapple was used, placed in the platforms early described in the greenhouse. Good quality fruits were selected to conduct a standardized solar drying experiment. For each fruit, the flesh was separated from the core and sliced into samples of 10 mm thick using an electrical slicer. These slices were uniformly laid out on the trays of the to perform the following solar drying process as seen in Figure 2. Experiment took place from 8:00 h to 18:00 h. Since the main objective was to reach the desire moisture content the drying process followed up during several days. At each one-hour interval, the samples were placed in several locations, which each of them were weighed using a digital balance (Kern, model 474-42, accuracy ± 0.1 g). The exact dry solid weight for each sample was obtained by oven method (105°C for 24 hours, accuracy ± 0.5 %).
Moisture content
It was determined the moisture content (
Where m w (kg) is the mass of water and m material (kg) the mass of the dry material, respectively.
The moisture present in the material originates, in general, from three sources: external water, internal liquid water and water vapor content in the surrounding air. Gravimetric determination is a direct method and the best and most absolute method for determining the average moisture content, i.e. to measure the sample weight before and after drying (Erich and Pel, 2011).
Weight difference between wet and dry sample is used for determination of the absolute moisture content (
Where m wet (kg) is the mass of the wet material and m dry (kg) the mass of the dry material.
Mathematical modeling
Calculation of moisture ratio
Data obtained at different drying temperatures were transformed to the moisture ratio (MR) and is expressed as:
where: MR is the dimensionless moisture content ratio; and
Drying models
Drying curves were generated by data collected from the greenhouse-type solar dryer; once they were developed they were fitted with nine empirical and semi theoretical thin-layer drying expressions (Table 1) taken from Ertekin and Firat (2015) because they represented an appropriate fitting for this type of drying experiments (Togrul and Pehlivan, 2002; Koua et al., 2009 and Janjai et al., 2012).
Table 1 Thin-layer drying models
| Equation | Name |
|---|---|
| 1. |
Diffusion Approximation |
| 2. |
Haghi and Angiz - III |
| 3. |
Haghi and Angiz - IV |
| 4. |
Hasibuan and Daud |
| 5. |
Hii |
| 6. |
Logistic |
| 7. |
Modified Midilli - I |
| 8. |
Page |
| 9. |
Sripinyowanich and Noomhorm |
The equations were selected after evaluating nine and discarding the one with the highest Root Mean Squared Error (RMSE). The estimation of the parameters and RMSE with nonlinear regression was performed using the Optimization Toolbox of MatLab® (Version R2013b), this tool let us perform design optimization tasks, including parameter estimation, component selection and parameter tuning. The fitting results of logarithmic model were not adequate. Even though, Kingsly et al. (2009) argued that this model type produced a good prediction of the drying pineapple process.
Statistical evaluation
The RMSE was one of the main criteria in order to select the best fitting equation. RMSE should be low and it is defined as it follows:
Where M pre,i and M obs,i are the predicted and observed dimensionless moisture ratio respectively and N is the number of measurements. The Root Mean-Square Error (RMSE) is a kind of generalized standard deviation.
Another criterion for model selection was the mean absolute error (MAE), which was calculated as the difference between locations that are known and locations that have been interpolated or digitized; the MAE is a statistical measure of how far estimates or predicted values are from actual values. It avoids compensation between under- and over-prediction and it is given by:
Where f
i
is the prediction and
Where
Equilibrium moisture content
In these experiments, equilibrium moisture content of pineapple slices was assumed when the mass became constant after a large period of time, temperature and relative humidity. The moisture content (M i , db, %) of each pineapple sample was determined by means of its dry weight using Equation 7.
where the terms mi i (g) and mf (g) refer to the initial mass and final dry mass respectively; MCf (%,db) refer to final moisture content.
Results and discussion
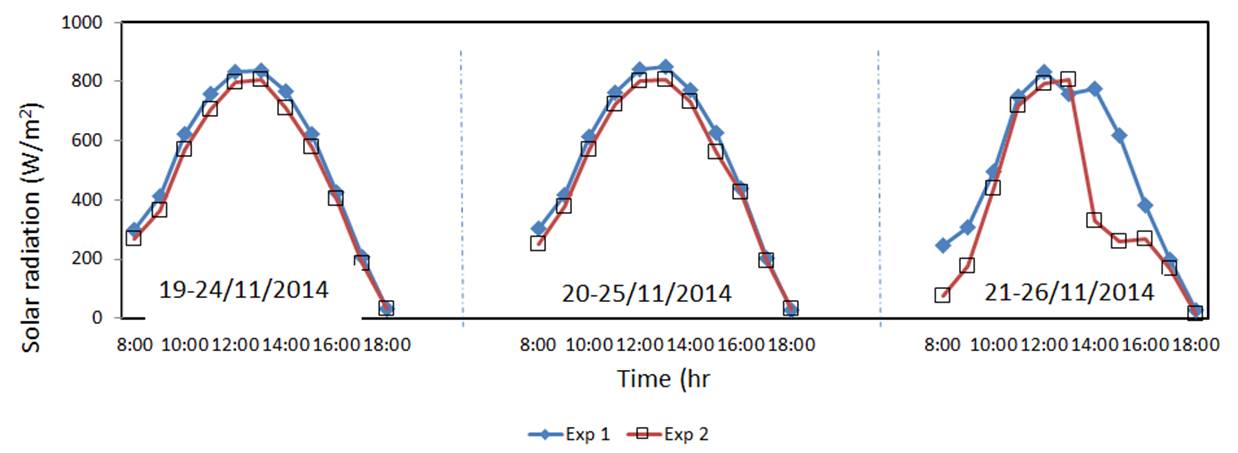
Two different pineapple greenhouse solar drying experiments were carried out: The first one took place from 19 to 21 November 2014 and the second one was from 24 to 26 November the same year. During the three days of pineapple drying, solar radiation was higher from 8:00 to 18:00 h. Solar radiation variation during the experimental run can be observed in Figure 3.
The internal and central temperature profiles in the greenhouse dryer type and the outside temperature are showed in Figure 4. It can be seen that the temperatures varied in a narrow band with exception of outside temperature where the differences were more significant. In the case of Figure 5, the behavior of the relative humidity of the inlet, outlet and surroundings can be seen. From this figure, it is clear that both conditions of experiment one (November 19, 20 and 21) and experiment two (November 24, 25 and 26) were similar.
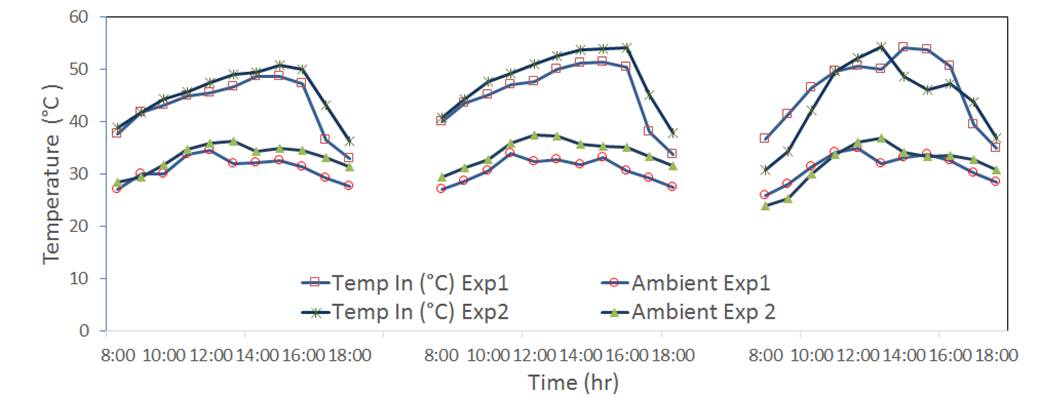
Figure 4 Behavior of temperature inside the greenhouse solar dryer (Temp In) and ambient temperature of pineapple in experiments one and two
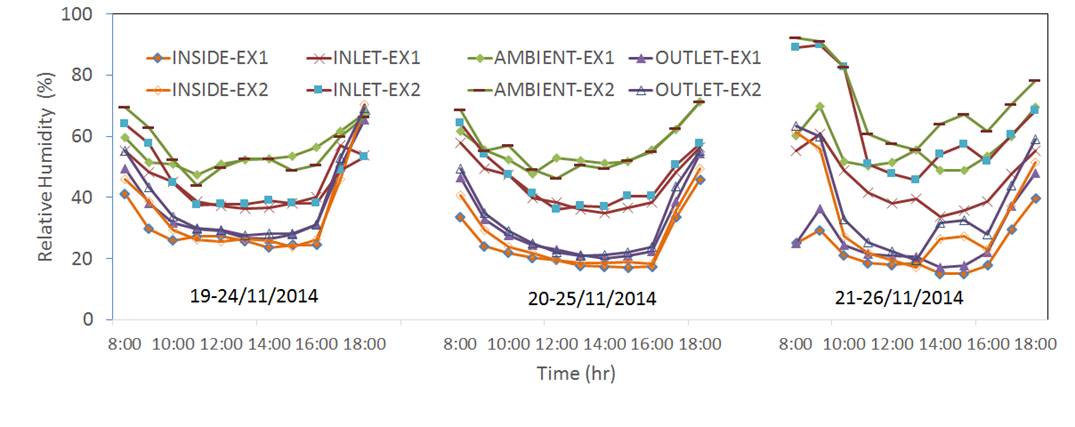
Figure 5 Profiles of ambient relative humidity as well as at the dryer inlet, interior, and outlet of the greenhouse solar dryer for experiments one and two
Drying kinetics
Final moisture content of pineapple reached 22 db% (reached when three consecutive weight reading were constant during drying) in the greenhouse solar dryer type after three days of drying. The changes of moisture content for the two experiments are showed in Figure 6 and Figure 7. As can be observed a total of nine samples (MC1, MC2… MC9) were used to measure the mass of the product at each hour inside the greenhouse solar dryer type. Location of the sample inside the greenhouse dryer turned out not to be significant for the rate of drying, as can be seen in the results of Figure 6 and Figure 7.
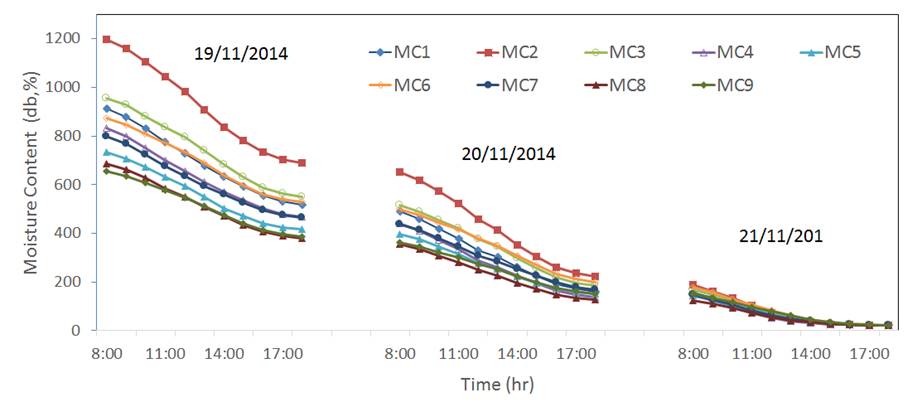
Figure 6 Behavior of the drying process of pineapple in the greenhouse solar dryer with sunny days in experiment one

Drying behavior of pineapple
It can be observed that higher solar radiation allowed faster moisture desorption in comparison with lower radiation. Higher initial moisture removal rate can be observed at the first day in comparison with the removal rate during the following days. This is a typical moisture desorption behavior of food material, which has been reported by Olanipekun et al. (2014) as a short drying period constant rate and a steep declining rate period.
Modelling of thin-layer drying
Moisture ratios of dried pineapples at different temperatures and air flows were fitted to nine thin layer models. Statistics values, RMSE, MAE and EF are shown in Table 2 for all them. Hasibuan and Daud model was the best followed by Sripinyowanich and Noomhorm and Modified Midilli. For these three cases the value of RMSE was less than 13.17% which means that an acceptable fitting was reached. The average value of RMSE for the Hasibuan and Daud model was 11.89%, the MAE was 8.53 and EF= 0.96.
Table 2 Modelling of moisture content according to drying time for pineapple
| Models | Exp. | a0 (h-1) | a (-) | b (-) | c (-) | d (-) | g (h-1) | k (-) | m (-) | n (-) | RMSE (%) | MAE | EF |
|---|---|---|---|---|---|---|---|---|---|---|---|---|---|
| Diffusion Approximation | 1 | -58,68 | 0,987 | 0,134 | 27,041 | 21,616 | 0,736 | ||||||
| 2 | -31,12 | 0,973 | 0,193 | 14,658 | 9,771 | 0,952 | |||||||
| Haghi and Angiz-III | 1 | 0,998 | -0,032 | 0,014 | 0,001 | 14,602 | 11,578 | 0,927 | |||||
| 2 | 0,994 | -0,032 | 0,003 | 0,007 | 15,676 | 10,957 | 0,940 | ||||||
| Haghi and Angiz-IV | 1 | 1,133 | -8,516 | 15,730 | 18,534 | 15,471 | 0,866 | ||||||
| 2 | 1,264 | -8,053 | 12,030 | 12,173 | 9,290 | 0,958 | |||||||
| Hasibuan and Daud | 1 | 0,056 | 4,386E-07 | 3,784 | 0,887 | 12,661 | 9,695 | 0,949 | |||||
| 2 | 0,045 | 0,051 | 0,987 | 1,333 | 11,119 | 7,371 | 0,973 | ||||||
| Hii | 1 | 0,245 | 0,738 | 0,002 | 0,045 | 2,229 | 10,269 | 8,283 | 0,963 | ||||
| 2 | -56,03 | 57,120 | 0,167 | 0,169 | 0,989 | 26,634 | 19,325 | 0,810 | |||||
| Logistic | 1 | 1,27 | 0,308 | 0,139 | 20,757 | 17,258 | 0,833 | ||||||
| 2 | 1,396 | 0,392 | 0,183 | 12,189 | 8,538 | 0,964 | |||||||
| Modified Midilli | 1 | -0,075 | -0,026 | 1,011 | 12,986 | 10,453 | 0,940 | ||||||
| 2 | 0,000 | 0,037 | 1,399 | 13,093 | 8,642 | 0,963 | |||||||
| Page | 1 | 0,025 | 1,378 | 24,799 | 20,892 | 0,763 | |||||||
| 2 | 0,037 | 1,396 | 12,883 | 8,728 | 0,962 | ||||||||
| Sripinyowanich and Noomhorm | 1 | -0,071 | 0,006 | -0,019 | 1,082 | 13,171 | 10,349 | 0,942 | |||||
| 2 | 0,001 | -0,016 | 0,036 | 1,435 | 12,861 | 8,459 | 0,964 |
Evaluation of drying models
Nine thin-layer drying models were fitted to the experimental data of moisture ratio obtained in two different experiments, changing temperature, relative humidity and air velocity over time. Models are shown in Table 1. The parameter values, RMSE, MAE and EFF of the models are depicted in Table 2. The Hasibuan and Daud model was found to be the best, followed by the Sripinyowanich and Modified Midilli.
Comparisons between the predicted and experimental data of thin-layer drying for Hasibuan and Daud, Sripinyowanich and Modified Midilli can be seen in Figure 8. The agreement between the prediction and measured values of these models is fair. In contrast, using a high-precision dryer type allowed environmental variables to be controlled so that drying behavior can be determined under constant conditions, (Janjai et al. 2011; López et al., 2018); in case of the experiments which were carried under large-scale dryer conditions, it could not determine a relationship between the parameters of the models and environmental variables because they were not constant.

Validation of the best fitting model for Hasibuan and Daud was made by comparing the predicted moisture content with the experimental moisture content in any particular experiment of greenhouse solar dryer. The performance of the model is illustrated in Figure 9-10. For experiment one RMSE was equal to 12.13 and for experiment two RMSE was 10.72. The predicted data generally band around 1:1 straight line representing experimental data, which indicated the suitability of the Hasibuan and Daud mathematical model in describing drying behavior of pineapple applicable between the prediction and measured values. With these results, it is possible to make a recommendation regarding the use of the models to optimize the pineapple drying in other locations with similar temperature, relative humidity and air velocity using a greenhouse dryer like the one used in this research.

Figure 9 Comparison of predicted and observed moisture content of pineapple in experiment one from Hasibuan and Daud model

Conclusions
Two pineapple drying experiments were carried out at Silpakorn University during sunny days. Similar data for solar radiation, temperature and relative humidity were obtained for both experiments. During the third day in the second experiment were present some cloudy hours. The results were drawn from the pineapple drying kinetics in a greenhouse-type solar dryer as a basis. Drying curves obtained from experiments showed that the constant drying and the falling drying rate periods exist.
Nine thin-layer drying models were fitted to two experimental data in order to describe the drying characteristics of pineapple. The parameter values, root mean square error (RMSE), mean absolute error (MAE) and modelling efficiency (EFF) of the nine models were calculated. The Hasibuan and Daud model was found to be the best fitting followed by the Sripinyowanich and Modified Midilli. The suitability of the Hasibuan and Daud model was applicable between the prediction and measured values.

