


 text new page (beta)
 English (pdf)
 Article in xml format
 Article references
 Send this article by e-mail
 Cited by SciELO
  Similars in
SciELO
Similars in
SciELO 
 Permalink
Introduction
The impacts of porewater pressure (PWP) buildup, soil softening, and potential liquefaction on ground motions and the resulting response spectra are not yet well understood, and the actual ability to predict and/or compute these effects is not particularly precise. In sites susceptible to large PWP increase, most practitioners address those questions performing site response analysis as a two-step process:
The most widely used approach for estimating liquefaction potential at a site is applying the cyclic stress method proposed by Seed and his co-workers (e.g., Seed and Idriss (1971); Seed et al. (1985)) and more recently updated by Youd et al. (2001); Cetin et al. (2004); and Idriss and Boulanger (2008). The cyclic stress method addresses the triggering of liquefaction but does not provide an estimate of the corresponding surface accelerations if PWP increases and liquefaction is triggered. Site-specific response analysis using one-dimensional (1D) wave propagation is the most common approach for evaluating ground surface shaking due to wave propagation in a soil column. The equivalent linear (EL) total stress analysis is the first approach to analyze problems that involves site response analysis using 1D wave propagation, but this approach (Schnabel et al., 1972) is not suitable for conditions where the soil response is highly nonlinear and the level of shaking is strong-conditions commonly associated with PWP buildup and liquefaction. However, nonlinear (NL) analysis codes are available to better represent soil nonlinear response. These codes often employ a total stress approach, ignoring PWP generation due to cyclic loading of the soil.
The effects of PWP generation in site response analysis can be accounted performing a NL effective stress analysis using a new quasi-coupled constitutive model proposed inhere. The quasi-coupled constitutive model is introduced in a simplified hyperbolic constitutive model termed MRDF+u (
The considered case history corresponds to Port Island and represents a specific problem with respect to the intensity of ground shaking, configuration of the liquefiable sand layers within the profile, dynamic properties of the different soil layers, observed surface manifestations, and availability of acceleration and PWP records during the seismic event. It is important to remark that the MRDF+u effective stress constitutive model can be used in any soil profile susceptible to liquefaction, and the Port Island case history was selected because the site is one of the most representative examples where liquefaction causes great damage.
Simplified quasi-coupled hyperbolic stress-strain constitutive model: MRDF+u
Based on the work by Hardin and Drnevich (1972); Matasovic (1993) proposed two degradation indices, which introduce excess PWP-induced softening into a simplified hyperbolic soil constitutive model: the modulus degradation index (δG) and stress degradation index (δτ). These indices reduce the shear stress mobilized during the loading-unloading process as a result of PWP increase (Matasovic, 1993), and are defined as
where ru = excess PWP/σ’vo or ∆u/σ’vo; and 𝜗 = dimensionless exponent generally equal to 3.5 (Matasovic, 1993) obtained of matching the stress-strain hysteresis loops over a wide range of ru-values for Santa Monica Beach sand, Wildlife Site sands A and B, Heber Road point bar (PB) and channel fill (CF) sands. The advantage of the degradation indices is that they can use ru values defined by any PWP generation model.
The modified hyperbolic model MRDF+D (
Loading
Unloading - Reloading
where
G0 |
= initial shear modulus |
δG |
= modulus degradation index |
ϒc |
= given shear strain |
β’ |
= dimensionless factor |
δ𝜏 |
= stress degradation index |
ϒr |
= reference shear strain |
𝜏 |
= dimensionless exponent |
F(ϒm) |
= reduction factor |
ϒrev |
= reversal shear strain |
ϒmax |
= maximum shear strain |
𝜏rev |
= reversal shear stress |
Moreno (2012) evaluated four available PWP generation models and concluded that those proposed by Dobry et al. (1982, 1985) (termed the Dobry model), by Green et al. (2000); Green (2001) and Polito et al. (2008) (termed the GMP model) best predicted PWP generation for a large database of cyclic triaxial and cyclic simple shear tests. In addition, those tests were used to verify the validity of the quasi-coupled constitutive model with the evaluation of the stress-strain behavior incorporating the Dobry and GMP models. In general, the two models reasonably predict stress-strain and rustrain behavior in loose to dense specimens for shear strains (ϒc) less than 5%. As expected, the models more poorly predict stress-strain and ru-strain behavior when dilation becomes more pronounced (ϒ c > 5% and ru > 0.65) and significant modulus degradation occurs.
These PWP generation models, described by Moreno (2012), were implemented in DEEPSOIL (Hashash, 2011) for use NL effective stress site response analysis quasicoupled with the MRDF+u constitutive model. For the Dobry model, Moreno (2012) proposed the correlations presented in Table 1 to estimate the required model parameters, p, F, and s for stress- and strain-controlled loading.
Table 1 Correlations for Dobry Model (Moreno, 2012)
| Loading method | P | F | s |
|---|---|---|---|
| Stress- controlled | 1.38 | 0.16 | 0.35 for Dr < -10%1 |
| (all Dr) | (all Dr) | 0.32 - 0.28Dr | |
| (-10% < Dr < 100%)1 | |||
| Strain- controlled | 1.0 | 3.0 (Dr < 18%) | 2.0 (Dr < 20%) |
| (all Dr) | 3.75 - 4.4Dr | 2.88 - 4.18Dr | |
| (20% < Dr < 80%) | (20% < Dr < 45%) | ||
| 0.16 (Dr > 80%) | 1.0 (Dr > 45%) |
1 For relative density (Dr), Dr <0 % applies to laboratory specimens
In addition, Moreno (2012) confirmed the model parameter correlations reported by Polito et al. (2008) for the GMP model. Equation (5) presents the corresponding correlation.
Port island case
Site description and soil profile characteristic
The Port Island Site, located close to the city of Kobe (Japan), was constructed in a land reclaimed from the sea by filling parts of Osaka Bay. Two major islands (Port Island and Rokko Island) were constructed by barging granular soil excavated from nearby mountains and dumping the soil into Osaka bay. Only a few localities were well-compacted during post-fill process to make the granular soil denser to prevent liquefaction. As a result, liquefaction was widespread and devastating in much of the filled area during the 1995 Kobe earthquake (Youd and Carter, 2003). The Port Island Site is 25 km northeast of the epicenter of the 1995 Hyogoken-Nanbu earthquake (Surface wave magnitude, Ms, 7.2) (Figure 1 (Iwasaki et al., 1996)).
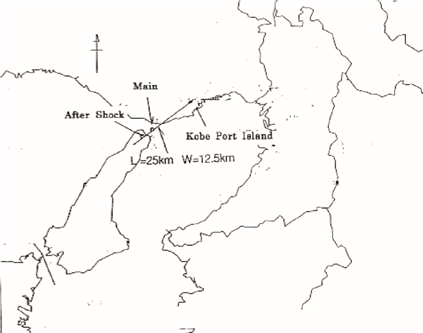
Figure 1 Port Island-Location Map and the epicenters of the major and aftershock earthquakes in the area (Iwasaki and Tai, 1996)
The soil profile and instrumentation installed before 1995 at the Port Island Site are presented in Figure 2. The soil profile was defined on the basis of the standard penetration test (SPT), geophysical measurements, and laboratory tests (Ishihara at al., 1996). The analysis of the field data presents a soil profile that includes the uppermost 17.5 m thick layer of liquefiable sand fill, 10.5 m of silty clay and 9 m of layers of gravel and sand. Sand boils consisting of reclaimed fill were observed following the earthquake, indicating that this layer liquefied during shaking. The horizontal components of the acceleration records used as input motion in the present work were recorded at 32 m downhole by the SM3 accelerometer (Figure 3) and the horizontal ground surface component was recorded by the accelerometer SM1. Inagaki (Inagaki et al., 1996) constructed a 1/17-scale quay wall model to simulate the conditions at the Port Island Site. This model was tested on a shake table and PWP measurements were recorded. In this paper, the PWP measurements of the model-scale are compared to the PWP predictions from the site response analyses conducted based on new quasi-coupled constitutive model considering Dobry and GMP PWP models.
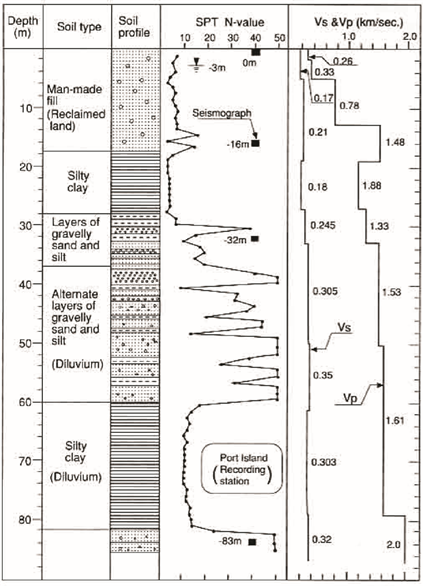
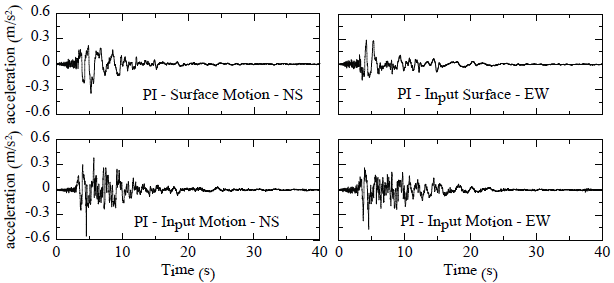
Figure 3 Input and Surface acceleration time history records during the 1995 Kobe Earthquake (Ishihara et al., 1996)
The analytical soil profile used for modeling purposes is shown in Figure 4. The soil is represented by 18 layers with different stiffness and strength characteristics. The shear wave velocity profile is based on interpretation of standard penetration resistance, SPT profiles, and direct measurement of shear wave velocity. As shown in Table 2 (Profile input variables), the upper boundary of layer 3 coincides with the groundwater table (GWT). The bottom boundary condition is represented by a rigid halfspace boundary where the accelerometer SM3 was placed. The modulus reduction and damping curves were obtained using the curves measured by Ishihara et al. (1996) for sand fill, alluvial clay, and sand. The measured modulus reduction and damping curves were corrected to account for implied soil strength at large strain and adjusted using the MRDFUIUC model (Hashash et al., 2010) and Table 3 shows the shear stress-shear strain input variables.
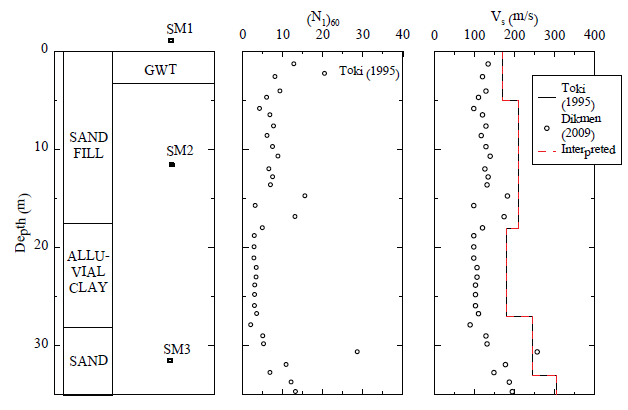
Table 2 Port Island Site-Analytical Soil Profile
| Material type | Layer number | Thickness (m) | Unit weight | Vs (m/s) | Soil parameters | |
|---|---|---|---|---|---|---|
| (kN/m3) | ||||||
| Sand fill | 1 | 1.5 | 17.7 | 170 | ||
| 2 | 1.5 | 17.7 | 170 | GWT = 3 m | ||
| 3 | 2.0 | 17.7 | 170 | |||
| 4 | 2.0 | 17.7 | 210 | |||
| 5 | 2.0 | 17.7 | 210 | PI = 0%, ϕ’ = 31o, Ko | ||
| 6 | 1.7 | 17.7 | 210 | =0.485 | ||
| 7 | 1.7 | 17.7 | 210 | |||
| 8 | 1.7 | 17.7 | 210 | |||
| 9 | 1.7 | 17.7 | 210 | |||
| 10 | 1.7 | 17.7 | 210 | |||
| Alluvial Clay | 11 | 1.5 | 14.8 | 210 | ||
| 12 | 2.6 | 14.8 | 180 | Su (kPa) = 56-95, | ||
| 13 | 2.8 | 14.8 | 180 | PI = 60%, ϕ’ = 25, OCR = | ||
| 14 | 2.6 | 14.8 | 180 | 1.7, Ko = 0.624 | ||
| 15 | 1.0 | 14.8 | 245 | |||
| Sand | 16 | 1.5 | 18.2 | 245 | ||
| 17 | 1.0 | 18.2 | 245 | PI = 0%, ϕ’ = 33o, | ||
| 18 | 1.5 | 18.2 | 245 | Ko =0.455 | ||
| Rigid Base |
Table 3 Port Island Site - MRDF + u and PWP Model Parameters
| MRDF+u MODEL | DOBRY MODEL | GMP MODEL | |||||||||||||||||||
|---|---|---|---|---|---|---|---|---|---|---|---|---|---|---|---|---|---|---|---|---|---|
| Material | Layer | Thick. | Damping | Reference | Reference | 𝛽 | t | f | p | F | s | γtvp | 𝜐 | OCR | r | A | B | C | D | Dr(%) | FC |
| type | No. | (m) | Ratio (%) | Strain (%) | Stress | (%) | (%) | ||||||||||||||
| (MPa) | |||||||||||||||||||||
| Sand fill | 1 | 1.5 | 0.086 | 0.034 | 0.18 | 1.29 | 1.08 | 1.2 | 1.05 | 2.8 | 1.8 | 0.025 | 3.8 | 1 | - | - | - | - | - | 36 | 20 |
| 2 | 1.5 | 0.082 | 0.056 | 0.18 | 1.245 | 0.96 | 1.2 | 1.05 | 2.8 | 1.8 | 0.025 | 3.8 | 1 | - | - | - | - | - | 36 | 20 | |
| 3 | 2.0 | 0.073 | 0.074 | 0.18 | 1.485 | 0.915 | 1.2 | 1.05 | 2.8 | 1.8 | 0.025 | 3.8 | 1 | - | - | - | - | - | 36 | 20 | |
| 4 | 2.0 | 0.074 | 0.046 | 0.18 | 1.02 | 0.945 | 1.2 | 1.05 | 2.8 | 1.8 | 0.025 | 3.8 | 1 | - | - | - | - | - | 36 | 20 | |
| 5 | 2.0 | 0.073 | 0.033 | 0.18 | 0.735 | 0.915 | 1.2 | 1.05 | 2.8 | 1.8 | 0.025 | 3.8 | 1 | - | - | - | - | - | 36 | 20 | |
| 6 | 1.7 | 0.069 | 0.078 | 0.18 | 1.455 | 0.885 | 1.2 | 1.05 | 2.8 | 1.8 | 0.025 | 3.8 | 1 | - | - | - | - | - | 36 | 20 | |
| 7 | 1.7 | 0.069 | 0.077 | 0.18 | 1.365 | 0.885 | 1.2 | 1.05 | 2.8 | 1.8 | 0.025 | 3.8 | 1 | - | - | - | - | - | 36 | 20 | |
| 8 | 1.7 | 0.059 | 0.06 | 0.18 | 0.915 | 0.825 | 1.2 | 1.05 | 2.8 | 1.8 | 0.025 | 3.8 | 1 | - | - | - | - | - | 36 | 20 | |
| 9 | 1.7 | 0.06 | 0.12 | 0.18 | 1.455 | 0.825 | 1.2 | 1.05 | 2.8 | 1.8 | 0.025 | 3.8 | 1 | - | - | - | - | - | 36 | 20 | |
| 10 | 1.7 | 0.045 | 0.13 | 0.18 | 1.38 | 0.78 | 1.2 | 1.05 | 2.8 | 1.8 | 0.025 | 3.8 | 1 | - | - | - | - | - | 36 | 20 | |
| Alluvial clay | 11 | 1.5 | 2.455 | 0.224 | 0.18 | 1.545 | 0.96 | 1.2 | - | - | 0.05 | 0.1 | - | 1.7 | 0.48 | 12.9 | -26.3 | 15.3 | -1.99 | - | - |
| 12 | 2.6 | 2.455 | 0.224 | 0.18 | 1.545 | 0.96 | 1.2 | - | - | 0.05 | 0.1 | - | 1.7 | 0.48 | 12.9 | -26.3 | 15.3 | -1.99 | - | - | |
| 13 | 2.8 | 2.455 | 0.206 | 0.18 | 1.38 | 0.96 | 1.2 | - | - | 0.05 | 0.1 | - | 1.7 | 0.48 | 12.9 | -26.3 | 15.3 | -1.99 | - | - | |
| 14 | 2.6 | 2.456 | 0.243 | 0.18 | 1.545 | 0.96 | 1.2 | - | - | 0.05 | 0.1 | - | 1.7 | 0.48 | 12.9 | -26.3 | 15.3 | -1.99 | - | - | |
| 15 | 1.0 | 2.456 | 0.231 | 0.18 | 1.38 | 0.96 | 1.2 | - | - | 0.05 | 0.1 | - | 1.7 | 0.48 | 12.9 | -26.3 | 15.3 | -1.99 | - | - | |
| Sand | 16 | 1.5 | 2.122 | 0.051 | 0.18 | 0.615 | 0.885 | 1.2 | 1.05 | 2.8 | 1.8 | 0.025 | 3.8 | 1 | - | - | - | - | - | 50 | - |
| 17 | 1.0 | 2.122 | 0.051 | 0.18 | 0.615 | 0.885 | 1.2 | 1.05 | 2.8 | 1.8 | 0.025 | 3.8 | 1 | - | - | - | - | - | 50 | 0 | |
| 18 | 1.5 | 2.119 | 0.051 | 0.18 | 0.615 | 0.87 | 1.2 | 1.05 | 2.8 | 1.8 | 0.025 | 3.8 | 1 | - | - | - | - | - | 50 | 0 | |
| Rigid base | |||||||||||||||||||||
Dobry’s PWP model parameters (p, F, and s) were assigned to submerged layers 3 to 18 using again the correlations developed by Moreno (2012). For the clayey material, the PWP parameters proposed by Matasovic (1993) were used in the analysis. In addition, practical values of the volumetric threshold shear strain, ϒ vp, equal to 0.02% for sand and 0.2% for clay were selected for the layers below the GWT following recommendations from Vucetic (1986) and Matasovic (1993). The Equation (5) was applied to calculate the corresponding PEC value for the GMP-PWP model and Table 3 shows the PWP input variables.
Analysis and results
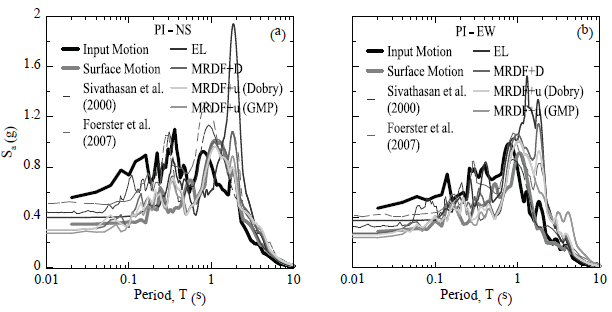
Figure 5 shows the spectral acceleration, S a , for North - South (NS) and East - West (EW) directions on surface. For these directions, the comparison of the actual and calculated spectra for EL, MRDF+D, and MRDF+u indicates that EL and MRDF+D constitutive models are overpredicting the response and MRDF+u (Dobry and GMP) reasonable describes the response at all periods. The period at the maximum spectral acceleration is captured by all constitutive models. MRDF+u constitutive model in comparison with Sivathasan et al. (2000) and Foerster et al. (2007) presents better prediction of spectral accelerations. Both researches performed effective stress analysis differentiating one to each other in the constitutive model used; Sivathasan et al. (2000) considered a hypo-plastic constitutive model and Foerster et al. (2007) considered an elasto-plastic constitutive model. The current analysis is closer in prediction, because the constitutive models used by Sivathasan at al. (2000) and Foerster et al. (2007) need sophisticated procedures to obtain the soil properties that the model uses. This sophistication could introduce some errors in the interpretation of the soil properties that could affect the final result. However, a careful basic selection of the soil parameters could lead to gain in accuracy of the final result of response spectrum using the MRDF+u effective stresses constitutive model. Again, the period at the maximum spectral acceleration, Sa-max is not presenting any shifting between total stress/effective stress analysis and actual values of Sa, the only visible change is in the magnitude of the Sa. The decent response of the model could be attributed to a good interpretation of the soil properties.
As shown in Figure 6, the profiles of maximum shear strain (ϒmax), peak ground acceleration (PGA), shear stress ratio (𝜏/𝜎’𝝎o) and excess of PWP ratio (ru) present that the major increment on PWP occurs at 10 m below ground level. In addition, the calculations capture the PWP buildup in most of the piezometers reported in Inagaki’s scale model (1996), but liquefaction was not reached, even when field evidence indicate that liquefaction occurred at the site. The maximum shear strains calculated by all constitutive models are in the range of 3.5% to 6%. PGA profiles start in agreement with the actual (measured in field) input motion PGA and then all the models (total and effective stress analysis) decrease in a narrow band to the ground level capturing the PGA actual value. However, at 16 m below the ground surface, the PGA is not captured. The calculated PGA data show slight amplification of the motion between 16 m and 32 m that is expected in a relatively competent clay layer, but the predicted results indicate that this clay layer is relatively soft, with shear strains of about 3%, relatively high PWP and significant deamplification of the motion. Therefore, the predicted results are in agreement with the measured shear wave velocity which is Vs ~150 m/s and the corrected (i.e., by overburden pressure) standard penetration resistance is (N1)60 ~ 2 blows/feet suggesting a soft clay layer. The observed high PWP values in the clay layer are attributed to the lack of knowledge of the clay parameter for the PWP model available. The parameter value used was suggested by Matasovic (1993), who obtained the parameter using a clay at different preconsolidation pressure.
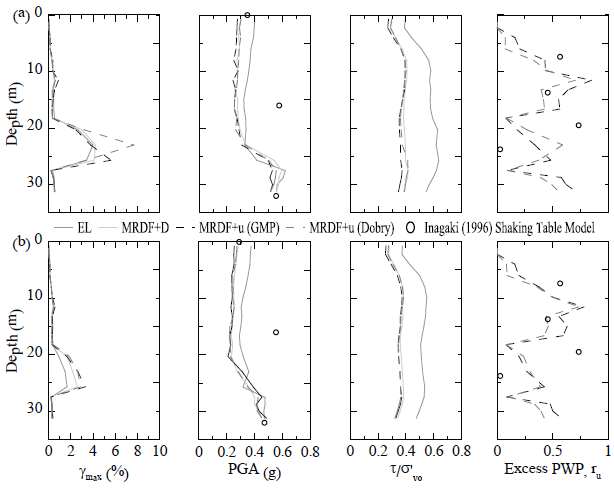
Figure 6 ϒmax, PGA, 𝜏/𝜎’vo and ru profiles for: a) north-south motion and b) eastwest motion at Port Island
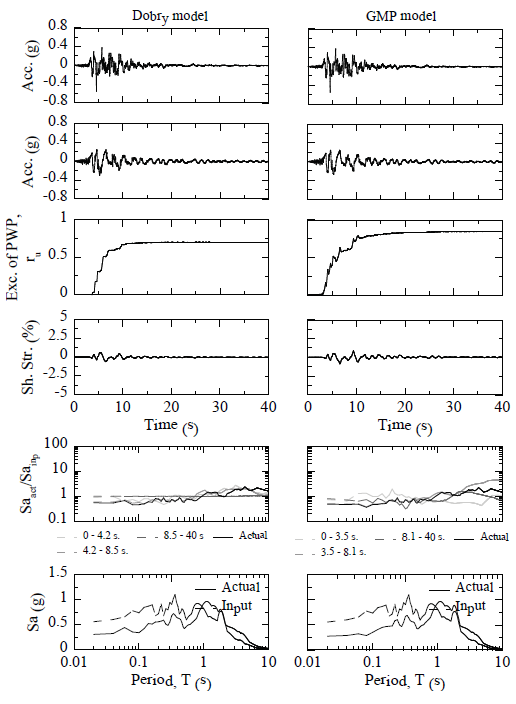
Figure 7 presents the complete set of time histories of input motion, surface motion, excess of PWP ratio (ru), shear strain (ϒc), time windows response spectra ratio (Saact/Sainp), and the response spectra (Sa) at the surface and input. The time windows analysis shows that there is some deamplification of the motion at short periods during the generation of PWP, while at the same time, there is moderate amplification of the motion at longer periods. Once the soil liquefies, there is little amplification or deamplification at any period, because the soil cannot transmit energy to the surface, which is in concordance with the observations presented by Moreno (2012). The important amplifications occurred later during shaking- after significant modulus reduction had already occurred- and amplification or deamplification occurred after ru > 0.9.
Conclusions
In this paper, a new quasi-coupled constitutive model, termed MRDF+u, is introduced. This constitutive model was used to conduct site response analysis considering a specific history case (i.e., Port Island, Japan) to evaluate its performance. This evaluation showed an appropriate description of the spectral acceleration, Sa, and that the whole spectrum of frequency content can be capture when the soil properties are fully measured.
The quasi-coupled MRDF+u constitutive model can capture the time history PWP behavior at different levels, which is a major success of this constitutive model compared with other similar constitutive models.
Given the ability of the modified hyperbolic constitutive MRDF+u model (i.e., Dobry- and GMP-PWP generation) to reasonably predict the response spectrum and the PWP generation in the history case analyzed, the MRDF+u model is recommended for application in engineering practice of site response analysis where the soil profile is susceptible to liquefaction (loose sands). Further research should focus on improving the model to account for softening the soil faster to get the liquefaction stage in.

