


 text new page (beta)
 English (pdf)
 Article in xml format
 Article references
 Send this article by e-mail
 Cited by SciELO
  Similars in
SciELO
Similars in
SciELO 
 Permalink
Introduction
The energy crisis taking place during the last few decades, the increase in fuel prices and the environmental problems due to of by-products in particular from of fossil fuels, has led to the study of clean, renewable energy sources such as hydrogen. Hydrogen is already recognized as an alternative energy source, because it has a high energy level, and at the same time it does not producing greenhouse gases during its combustion, then it is offering so a great potential to reduce CO2 emissions. This is why it considered as renewable energy source that can progressively replace the use of fossil fuels (Penteado et al., 2013).
Hydrogen is produced from different methods. Some of them are water electrolysis, thermo catalytic reform of carbon-rich organic compounds and biological processes. The latter is the one of most interest due to its low energetic cost, since the raw material are liquid and solid wastes easily available. Hydrogen production by dark fermentation has advantages over other processes due to its capacity to produce hydrogen in a continuous manner, by using diverse raw materials, and because it does not depend from solar light (Cavalcante et al., 2009; Fontes et al., 2013). Strictly anaerobic bacteria, generally spore-forming named Clostridium or, facultative anaerobic bacteria like the Bacillus and Enterobacter genre can intervene in this process. Estimation of the maximum theoretical production of hydrogen from glucose fermentation is 4 H2 mol per mole of glucose consumed, this amount occurs when acetic acid is the only one produced (Blanco and Chaparro, 2012).
Reported information about on dark fermentation has grown significantly in the last few years. In 2008 there was a noticeable change, when literature about on the production of hydrogen in anaerobic reactors tripled, and it has been grown progressively from that year, reaching its maximum values between the in 2011-2014 period, representing 64% of the literature. Within the bibliographic production 69% belongs to the Asian continent mainly from where China, India and Taiwan; and a 20% belonging to the American continent with the highest index of bibliographic production in the United States and Canada with a 73% and Mexico and Brazil with 27%. Likewise, several substrates have been assessed to this type of process, including use of waste water from different industries these reports with 67% and synthetic waters based on sucrose and glucose with 33%.
Hydrogen production in anaerobic fixed-bed reactors is affected by several factors such as temperature, design, hydraulic retention time, pH, type of inoculation and substrate concentration. Different substrates may be used for hydrogen production such as carbohydrates being these the main source, and therefore residues and sugar-rich biomass are considered good raw materials. However, there are several criteria that must be taken into account to select substrates like in the production of bio hydrogen through fermentation processes such as availability, cost and biodegradability (Show et al., 2012). Research conducted by Fontes et al. (2013) in which substrates like sucrose and glucose were used as carbohydrate the source found good performance for the production of hydrogen. For instance, instability was observed during the process by obtaining high values in production, which decreased later to low values and even to null values at the end of the operation. On the other hand, better stability was observed using glucose throughout the whole process with a light decrease of biogas; therefore, the authors concluded that the use of several substrates may lead to different metabolic paths due to the differential growth of microbial population in each one of the reactors.
Fixed-be reactors show high hydrogen production performance mainly because of their high capacity to retain biomass. Several factors must be taken into account for their conception and design especially in choosing the supporting materials. Cavalcante et al. (2009) points out that factors such as shape, density of particles, porosity and the superficial area must be taken into account as these factors contribute to high hydrogen production performance.
Currently, fixed-bed anaerobic reactors have shown better performance in hydrogen production as higher accumulation of biomass is fostered in the supporting material interstices, resulting in high porosity values, which at the same time affects the hydrodynamics of the reactor as a consequence of the process.
Research by Carminato (2013) on the production of hydrogen in structured fixed-bed reactors, using polyethylene cylinders equidistantly placed in a pentagon shape inside the reactor as support have shown values close to 60% of hydrogen of the total biogas volume. This means that the higher the porosity in the fixed bed, the higher the production of hydrogen. This is backed up by Lee et al. (2003) who assessed three different porosities 70, 80 and 90% in fixed-bed reactors with active coal, finding hydrogen in 7.4 L h-1 L-1 for the highest porosity, with a hydraulic retention time of 0.5 h.
There is also research involving different supporting materials in anaerobic fixed-bed reactors such as the one by Chang et al. (2002) who evaluated three supporting materials to guarantee the retention of hydrogen producing bacteria based on sucrose with 20 g.COD.L.-1 concentrations. It was observed that the vegetal sponge was insufficient to immobilize biomass in comparison to expanded clay and activated carbon that showed values of 0.415 L.h-1.L-1 with an HRT of 2h and 1.32 L.h-1.L-1 with an HRT =1 h, respectively. Biogas produced by the reactors showed H2 values between 25- 35% and a methane production lower to 0.1%. In the maximum hydrogen production values, butyric acid obtained the highest concentration.
Lee et al. (2003) used bed bioreactors packed with activate coal as a supporting material with 20 g COD.L-1 sucrose, varying HRT between 0.5 - 4h, finding a maximum hydrogen optimum production of 7.41 L.h-1.L-1 with an HRT of 0.5 h. They also observed that around 30-40% of the biogas produced corresponded to H2.
Barros et al. (2010) assessed the production of hydrogen in fluidized bed reactors using polystyrene and expanded clay as supporting materials. Glucose was used carbon source. These authors observed H2 throughput of 1.29 mol H2.mol-1 of glucose for polystyrene and 2.59 mol H2.mol-1 of glucose for expanded clay with an HRT of 2 h. The highest production speed rates were 0.95 and 1.21 L.h-1.L-1 with an HRT of 1 h for polystyrene and expanded clay, respectively. No methane production resulted during the process.
Fontes et al. (2013) used recycled low density polyethylene with a superficial area of approximately 7.9 m2 g-1 in fixed-bed reactors with porosity of 60%. They also tried two types of substrate, glucose and sucrose. Maximum hydrogen throughput was 1.51 mol H2. mol-1 glucose and 3.22 H2 mol-1 sucrose. Main biogas compounds were hydrogen and carbon dioxide, and the intermediaries were acetic acid, butyric acid and ethanol. Penteado et al. (2013) analyzed anaerobic fixed-bed reactors using low density recycled polyethylene cylinders as supporting material and synthetic sucrose-based water. They evaluated several inoculation pre-treatment finding the maximum output for the thermal shock with a value of 6.9 mol H2.mol sucrose-1 and an HRT of 2h.
There is no consensus about which specific configuration or a means we can choose to improve hydrogen production throughput. However, we can conclude that fixed-bed reactors using synthetic materials as supporting means can improve stability. Nevertheless, we have to be careful with problems caused by biomass accumulation clogging the reactors. In this regard, the purpose of this paper was to evaluate the effect of the organic loading rate in two upflow anaerobic fixed-bed reactors by using two different supporting means, one using crumb rubber from recycled tires and the other one using filtering Biomedia - Biomax PFC1 materials fed with synthetic waste water and sucrose as carbon source.
Materials and methods
Substrate
Reactors were fed with synthetic waste water prepared according Peixoto (2008). Sucrose concentration varied using 6000 mg L-1, 12000 mg L-1 and 18000 mg L-1 values as recommended by Hafez et al. (2010), so that the organic loading rate was affected. The initial concentration of micro and macro nutrients (in mg L -1) was: CH4N2O (20), NiSO4*6H2O (0.5), FeSO4*7 H2O (2.5), FeCL3*6H2O (0.25), CaCL2 (2.06), COCL2*6H2O (0.04), SEO2 (0.036), KH2PO4 (5.36), K2HPO4 (1.30), NaHPO4*2H2O (2.76) and NaHCO3 Buffer (500) as solution. These concentrations were proportionally increased by increasing sucrose concentrations. An HCl 10N solution was used to adjust the pH of influent to 5.5.
Reactors and support materials
This research was conducted in two upflow anaerobic fixed-bed reactors at the same time, built in Poly (methyl methacrylate) acrylic, PMMA) with useful volume of 2.92 L and L/d (length/diameter) 10 ratio, during the process they were kept in a thermo-controlled booth at 35°C. HRT was 8.9 ± 1 hours controlled by Masterflex L/S peristaltic pumps. Reactors worked non-stop for 120 days. The process was divided in three stages corresponding to each one of the loading rate values: 11.26 g COD. L-1. d-1 (E1), 26.31 g COD. L-1. d (E2) y 39.04 g COD. L-1. d-1 (E3). Each stage lasted 40 days. This duration was selected because stability in production of hydrogen was observed around the 40th day in the first set-up so it was decided to keep this observation time for the other two conditions.
Each one of the reactors used different supporting material to immobilize the biomass. Reactor 1 (R1) used crumb rubber (mainly a styrene-butadiene mix) obtained from the tire disposal deposits in Bogotá, Colombia, and reactor 2 (R2) used Biomax PFC-1, made with high density polyethylene. R1’s porosity was 47% and its uniformity coefficient was 1.8; 965 g of tire rubber were used to complete its useful volume. Biopack (Biomax PFC-1) in R2 had a specific superficial area of 950 m2.m-3 and 684 units located in an orderly fashion to complete the useful volume of the reactor. As a result, a porosity of 82.30% was obtained. Figure 1 shows a scheme of the reactors.
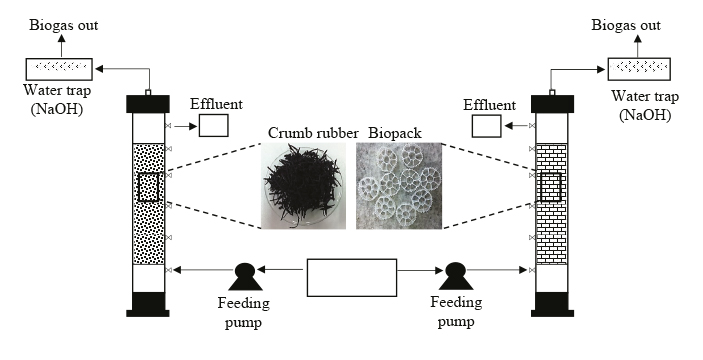
Tire crumb was selected as supporting means for research based on the need to use waste tires since they are improperly disposed of in most Latin American cities. It is worth mentioning that these waste tires are the common source of fires and occupy large spaces that could be used in a more efficient manner. On the other hand, Biomax PFC-1 was considered as proper material to be used due to its high specific surface.
Inoculation
Inoculation of R1 and R2 reactors was made with the natural fermentation method. This process consists on keeping the residual water at room temperature and in contact with air during a specific time. For this study it was left as such for five days, then, this water was recirculated through each one of the reactors for eight more days. The inoculation process was developed in order to obtain the anaerobic microorganisms and to facilitate their adherence to the support media (Carminato, 2013).
Analytical methods
In order to assess performance and stability of the reactors, the samples were taken from the influent and from the two effluents, three times a week. We performed total volatile acid assays on these samples according to Ripley et al. (1986), alkalinity, total suspended solids, total dissolved solids, total solids, chemical oxygen demand, sugars and pH measurement, according to APHA (2005).
Biogas composition (hydrogen, carbon dioxide and methane) was determined by gas chromatography, using an Agilent 7890A device equipped with a Carboxen 1010 plot capillary column, with a length of 30 m, 0.32 mm of internal diameter and 25 µm of stationary phase internal layer, injector temperature 200°C, furnace temperature 230°C, injection volume 0.5 mL; Argon was used as carrier gas with a flow of 1.5 mL/minute and the approximate time of each injection was 23 minutes. It has three ramps that elevate the furnace temperature to 60°C with a rate of 5°C/minute, followed by an increase to 95°C with a rate of 25°C/minute and finishing at 230°C with a rate of 24°C/minute. A Luer-gas tight system syringe of 0.5 mL was used to take the samples from each reactor with the same frequency as the other assays. All assays were made in duplicate for statistical analysis using the ORIGIN PRO 8.0 software.
Calculation of the parameters
Equations (1) to (11) were used to calculate the parameters used to evaluate reactor performance and hydrogen production. Each one of the equations below has its corresponding measurement units.
Reactor flow rate
where V is the reactor work volume (L) and HRTt (h) is the theoretical hydraulic retention time.
Sucrose conversion percentage
where S0 is the affluent Sucrose concentration and SF is the effluent Sucrose concentration.
Fatty volatile acids production percentage
where VFA0 is the affluent fatty volatile acids concentration and VFAf (mg.L-1) is the concentration of fatty volatile acids in the effluent.
Biogas composition
where nH2, nCO2 and nCH4 correspond to the mole number of each one of the gases in the biogas. The value of n corresponds to the number of total moles in the sample of injected gas and it was calculated using the ideal gases equation (Eq. 7).
P value is gas pressure (atm); Vi is the injected gas volume. R is the universal gas constant, and T is temperature (°K).
Biomass balance
Total biomass generated in the system
For which carrier biomass is Eq. (9) and withheld biomass Eq (10).
VSS correspond to the concentration of volatile suspended solids (mg L-1), t is time and Q is the reactor feeding flow rate.
To calculate the biomass withheld in the support material, approximately 23 g of crumb tire and 9 g of biopack extracted from the reactor were washed at the end of the operation with 100 mL of distilled water. The washed material was taken to the furnace for 4 hours and then the mass of the material was measured. Total solids assay was performed to the rinsing water following APHA (2005).
The value of Battached corresponds to the concentration of volatile suspended solids adhered to the support material, Msupport is the total support material mass in the reactor, Vdrain and VSdrain correspond to the liquid and volatile solids volume, respectively, in the sample drained from the reactor at the end of the operation days.
Organic loading rates
ANOVA statistical analysis
ANOVA was applied to the values of hydrogen production in each one of the reactors to evaluate the influence of the material and the effect of the organic loading rate. The test was performed with the ORIGIN PRO 8.0 software using Tukey’s test to compare the measurements with a significance level of p <0.05.
Results and discussion
Hydrogen production and sucrose conversion
It is well known and widely quoted the literature that one sucrose mole produces 8 hydrogen moles through and an aerobic way. However, until now such theoretical production has not been reached, mainly due to all the factors that intervene in the process. Figure 2a and 2b show the hydrogen production in each one of the reactors during the 120 days of continuous operation. The results show that the hydrogen production in reactor R1 (crumb tire) varied between 39% and 55% for loading rate E1 19%, 52% for loading rate E2 and 7% and 54% for E3 loading rate. In the case of R2 reactor, results were similar: between 49% and 62% for E1 loading rate, between 23% and 57% for E2 loading rate and values between 17% and 56% for E3. This shows that there is a maximum loading rate value that can be supported by the system and hydrogen production does not improve after that value (Shida et al. 2014). For this particular case, despite the fact of having continuous production of hydrogen, the highest process stability for both reactors was observed during the 11.26 g COD.L-1.d-1 ORL period. These results are similar to those in the literature related to the fact that increasing the loading rate will not favor an increase in the hydrogen production. In a fixed bed reactor and using low density polystyrene support and varying the concentration of 2200 mg/liter, 8600 mg/liter and 17,100 mg/liter of glucose, Ferraz et al. (2014) obtained average values of 2.1, 1.9 and 1.0 moles H2.mole glucose-1 a reduction in hydrogen throughput with a loading rate increase; the maximum hydrogen concentration value in the biogas was 43.2%. Likewise, Hafez et al. (2010) reported that with a loading rate variation of 6.5 to 206 g COD.L-1.d-1 the hydrogen percentage decreased from 73% to 39% with increased loading rates; sucrose conversion was also affected, showing values that varied between 99.9% and 40.5% being the latter for the highest loading rate evaluated.
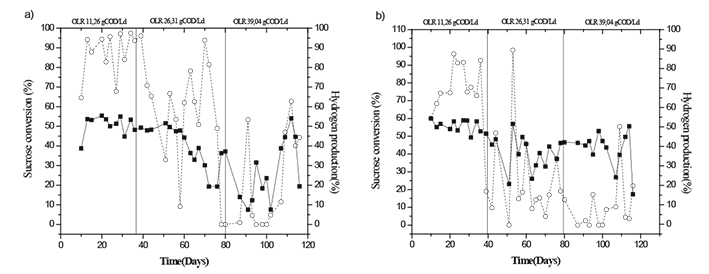
Figure 2 Temporal variation of the hydrogen production (■) and the conversion of sucrose (- ○ -) in R1a and R2b
Lin et al. (2006) also observed that the hydrogen production did not have significant results when varying the loading rate in a reactor fluidized with sucrose as carbon source and a Hydraulic Retention Time of 8.9 hours. They found that for 5 gCOD.L-1 10 gCOD.L-1 and 20 gCOD.L-1 and 40 gCOD.L-1 loading rates, production values were 47.2%, 43.4%, 43.3%, and 47.1% respectively and the sucrose conversion in the same case was 99.3%, 99.2%, 86.6% and 84.7%. Gavala et al. (2006) obtained hydrogen values of 43.7% and 56% in glucose conversion efficiency by treating glucose-based synthetic waters (5000 mg.L-1) in a reactor of continuous mix with a HRT of 8 hours. In this particular, study it was observed that an increase of about 133% in the initial loading rate represented approximately a 11% reduction in hydrogen production in both reactors, as we can see in the second case where the loading rate was increased by 48%, from 26.31 gCOD.L-1 to 39.04 gCOD.L-1, and then hydrogen production dropped by 34% for R1 and increased 4% for R2.
The same behavior was seen with sucrose conversion. Figure 2a and 2b show not only a drop in sucrose, but also absence of stability during E2 and E3 loading rates (from day 40 to day 120 of operation). This makes more difficult the comparison of hydrogen production for this case. Something different happened in E1 when the behavior was more stable showing an average value of 88.0% for R1 and 74.4% for R2. This shows once again that increasing the loading rate does not favor the system stability, sucrose conversion or H2 production. On the contrary it harms the process, regardless of the type of material used as support (Shida et al., 2012; Ferraz et al., 2014).
Other research that has evaluated the support material and its effect in hydrogen production in anaerobic reactors have reported that on short hydraulic retention times, sucrose conversion falls or remains constant and hydrogen production increases. For example Barros et al. (2011) studied crumb tire and pet as support materials with hydraulic retention times between 1 and 8 hours, reporting hydrogen production higher than 60% with HRT of 1 hour and the lowest values around 10% after 6 hours; these values were similar for the two support materials. On the other hand the sucrose conversion percentage yielded values of 60% and 90% for HRTs of 1 and 8 hours respectively. This results can be compared with Shida et al. (2012) who evaluated expanded clay in HRT from 1 to 8 hours; observing values of 40% and 11% in the hydrogen production and 90% in sucrose conversion for the two conditions.
Hydrogen production through anaerobic process from sucrose generates other types of gases as reported by Fontes et al. (2013) who evaluated biogas composition indicating values of 39% of carbon dioxide, 55% of hydrogen and absence of methane. This study reports the same composition of biogas previously mentioned for both reactors, which is consistent with the literature on hydrogen production in anaerobic conditions (Shida et al., 2012; Barros et al., 2011; Zhang et al., 2007).
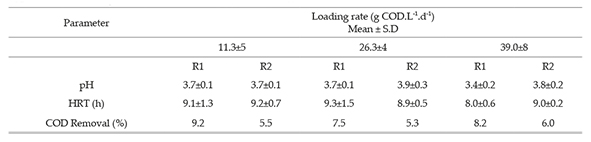
COD removal and pH
Table 1 shows pH and COD results and the hydraulic retention time. As we can see pH of the effluent for the two reactors varied between 3.4 and 3.9. The pH of the affluent was generally maintained at 5.5.
According to Wei et al. (2010) the optimum pH is between 5.5 and 6.5, the pH, being 6.5 the pH generating the highest hydrogen production with a value of 286 ml/g starch, and producing final pH values between 3.3 and 3.9. Likewise, Shida et al. (2009) observed effluent pH values between 3.5 and 4.3 at input pH of 6 in an anaerobic fluidized bed reactor, with similar behaviors to the findings obtained in this study. Investigations show the positive influence of an acidic environment (pH range 5.5 - 6), which restricts the methanogenic communities and facilitates the production of hydrogen-producer microorganisms (Hafez et al., 2010; Mohan et al., 2008).
Opposite results to those already mentioned were observed by Zhao & Yu (2008) who reported that at a pH of 9, high values can be obtained in hydrogen production, mainly as a result of bacteria such as multiforme Eubacterium and Paenibacillus polymyxa that can grow in an environment with pH from 9.0 to 9.5, but are inhibited below a 6.0 pH. These results justify the need for more research. The results show that the initial pH influences the speed of chemical reactions and thus hydrogen production.
In anaerobic process as wastewater treatment, chemical oxygen demand is reduced due to the transformation of intermediary products to methane by methanogenic microorganisms (2010), therefore in the production of hydrogen there is not COD removal due to the Inhibition of these microorganisms. COD removal is an indication to evaluate whether the process is in the acidogenic phase as shown in this study, where average values of 8.3% were obtained for R1 reactor and of 5.6% for R2 reactor. These values are comparable with or Shida et al. (2009) and Sreethawong et al. (2010), who obtained 20% to 60% for COD removal and hydrogen production value of 21% and 38% respectively.
VFAs production
In the anaerobic process there are intermediaries as a result of the production of volatile fatty acids (VFA); by being present in the medium they allow the microorganisms to use them and generate hydrogen. Authors such as Ferraz et al. (2014) indicate that hydrogen production is favored when products such as acetic acid and butyric acid in are generated in the metabolic pathway. However, generating a large proportion of VFA does not guarantee higher hydrogen production as it proven by Intanoo et al. (2012) who observed an increase of 8000mg.L-1 to 13300 mg, L-1/ generating toxicity of microbial activity, suggesting that there is a maximum level of tolerance that guarantees the best condition for the production of hydrogen.
In this study, increasing the loading rate of 11.26 gCOD.L-1 .d-1 to 26.31 gCOD .L-1/.d-1, 133% increase, and subsequently from gCOD 26.31. L-1.d-1 to 39.04 gCOD. L.-1d-1, which represents a 48% increase, generated instability in the production of acids. This is reflected in their percentages, which were 94 ± 4% in the first loading rate, 90 ± 10% in the second loading rate and 70 ± 28% in the third loading rate for R1. For R2 variations were 88 ± 11% 78 ± 18%, and 63 ± 35% in the three loading rates (Figure 3). The highest instability occurs in the third stage which is evident trough the high values of the standard deviation in both reactors.
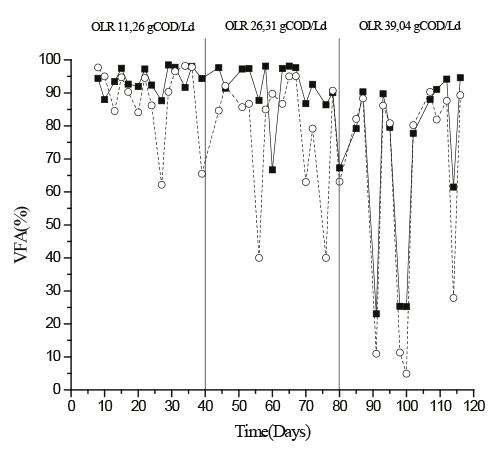
Figure 3 Percentage of volatile fatty acids (VFA) during reactors operation (■) crumb rubber (- ○ -) Biopack®
Similar results were observed by Shida et al. (2012) who investigated the production of hydrogen varying the loading rate values between 20 gCOD.L-1.d-1 and 140 gCOD. L-1.d-1 for 90 days. They found that the maximum yield was with a 84.3 gCOD.L-1.d-1 loading rate. From this moment to the end of the operation a decrease in VFA and hydrogen production was observed. In particular, a high production of VFA was obtained, being R1 more stable for E1 and E2 loading rates. In E3 there was instability in both reactors as shown in Figure 3. This is supported with the findings by Intanoo et al. (2012) who observed a reduction of approximately 75% in the hydrogen production rate, due to the accumulation of acids. Therefore it is possible to say that there is an optimum loading rate which maximizes the production of hydrogen which is close to the one which would produce a system overloading rate due to substrate accumulation. For this study the optimal loading rate would be between 11.26 gCOD.L-1.d-1 and 26.31 gCOD.L-1.d-1. It is worth mentioning that the use of sucrose as substrate allows for growth of different anaerobic microorganisms, resulting in the production of various intermediary products. Although sucrose has a theoretical capacity of 8 mol H2/1 mol of sucrose, this yielding is not possible due to the different acids produced and this would only be possible if the acetic acid were present; therefore using this carbon source generated instability as proven by Fontes et al. (2013). Similarly, instability of the reactors can be explained by the growth of homoacetogen microorganisms taking the Wood-Ljungdahl pathway.
Biomass
The mass balance showed that retained biomass was 35 kg and 6.5kg in reactor R1 and in reactor R2 respectively and the removed biomass was 54 kg and 73 kg, which resulted in the generation of 89kg and 80kg of biomass respectively for each reactor. According to the results it may be considered that the crumb tire rubber with loading rate values of 11.26 gCOD.L-1.d-1 is a suitable material for hydrogen production because the material allows good adhesion as noted by Barros et al. (2011). In the case of Biopack despite its low retained biomass value, it showed higher tolerance to the variation of loading rates; this was evidenced by a more constant hydrogen production throughout the operation. In this case we could say that the porosity influenced this behavior as indicated by Carminato (2013) and Lee et al. (2003) who state that the higher the porosity, the greater volume of void spaces, which favor the creation of spots for microorganism growth, which benefits the biomass quality and renewal.
ANOVA Test
ANOVA test showed that there is statistically significant influence both for the effect of the loading rate as for the type of support material in the production of hydrogen. This was found with values of F = 17.17>Fcritical = 3.23 for R1 and F = 13.07> = 3.23 Fcritical for R2 varying the loading rate. And a value of F = 7.65> Fcritical = 3.96 comparing the type of material.
This study showed that natural fermentation as a method to generate inoculum is very favorable, it does not only reduce the costs generated with the usual pretreatments (e.g. thermal shock, acidic and basic conditions of the environment, aeration, freezing and chloroform) but it generates indigenous organisms well acclimatized to the environment. This was proven by the absence of methane throughout the experiment. Likewise, the support materials used and their distribution proved to be adequate for the production of hydrogen.
Conclusion
The effect of loading rate in hydrogen production and sucrose conversion with two different support materials was evaluated in this study. The results showed statistically significant influence of the support medium and the loading rate value in the production of hydrogen. However, the values are close for the two reactors, as is the case of a 11.26 g COD.L-1.d-1 loading rate which resulted in a production of 50.9% for reactor R1 and 56.1% for reactor R2, and sucrose conversion of 88% and 74.4%. It is worth mentioning that with the other loading rate values a decrease in hydrogen production and instability in the conversion of sucrose was observed. From this study we can say that the production of total volatile acids is not always an indicator of hydrogen production, in fact we observed that the higher the loading rate, the greater the instability in VFA concentration.

