


 text new page (beta)
 English (pdf)
 Article in xml format
 Article references
 Send this article by e-mail
 Cited by SciELO
  Similars in
SciELO
Similars in
SciELO 
 Permalink
Introduction
The removal of CO2 from gas streams can be achieved by a number of separation techniques including absorption into a liquid solvent, adsorption into a solid, cryogenic separation, permeation through membranes, and chemical conversion. Among these techniques, absorption into a liquid solvent is the most suitable process for removing CO2 from high-volume flue gas streams.
The commonly used solvents are aqueous solutions of alkanolamines, such as monoethanolamine (MEA), diethanolamine (DEA), diisopropanolamine (DIPA), and methyldiethanolamine (MDEA) (Maddox, 1984; Kohl and Nielsen, 1997). Among these solvents, MEA is the most widely used because it has a faster rate of reaction with CO2, which allows absorption to take place in a shorter column.
This work focuses on MEA, running both, experiments and simulations, for simulations was used the Aspen HYSYS software which has an estimation method to estimate the Murphree efficiencies in plate columns based on pseudo first order conditions. The estimation method is based on the work of Tomcej et al., (1987), modified later by Rangwala et al., (1992). In a plate column, an efficiency value is estimated for each plate, in a packed column, a packing height of e.g. 1 meter can be defined as one stage with a Murphree efficiency.
Mofarahi et al. (2008) have simulated an atmospheric CO2 absorption and desorption process for the amines MEA, DEA, MDEA and diglycolamine (DGA) using Matlab with a Kent- Eisenberg equilibrium model. In their calculations, a Murphree efficiency was specified to 35% for each tray, and this is regarded as very optimistic, other authors as Øi, Lars Erik (Øi, 2011) used 10-28% Murphree efficiency for 1 meter of structured packing compared to 35% which was regarded as optimistic in earlier calculations, 15% is a value between typical top and bottom conditions.
In the present work, the disagreement found between experiments and simulations were attributed mainly to the Murphree Efficiency (EM), since in the first simulations was used a constant EM value of 24%. Therefore, the objective of this work, was to calculate de EM from the experiments and used these values in the simulations, achieving a better agreement between them.
Experimental
Bench scale absorption unit
The absorber is made of borosilicate glass Duran 3.3, with internal diameter of 4” and height of 1.70 m, the packing used was 5/8” polypropylene pall ring; the total height of the packing is 1.20 m. There is a tank holding the MEA solution where is pumped to the top of the column, the flow rate of the solution was calibrated manually with a stopwatch and volumetric flask using frequency converter for the pump. There is a Horiba gas analyzer Model ES510. Figure 1 shows a schematic diagram of the absorption unit. The experiments were carried out at Normal conditions of Temperature and Pressure, Normal Liters (NL).

To start the experiments, the gas was fed from the bottom of the column at 22°C and 34.47 mbag and its composition was measured using the Horiba gas analyzer at the outlet on the top with a temperature of 40°C. The MEA solution is added to the column from the top with a temperature of 28°C and it is leaving the absorber with a temperature of 50°C.
Results and discussion
Several experiments were carried out using three different gas flow rates (41.5, 104 and 184 NL/min) with different concentration of air/CO2. For each gas flow rate, was used a MEA solution 25%wt at different flow rates. At the same time simulations of the experiments were conducted to compare the results. The simulations were done in Aspen Hysys V7.3 using the 'Kent Eisenberg' thermodynamic package of the Amines Property Package, as suggests (Kent and Eisenberg, 1976; Aspen Technology, 2011). Table 1, 2 and 3 show the parameters used during the experiments and the results obtained from the experiment and simulation.
Table 1 Experiments with gas flow rate of 41.6 NL/min
| %CO2 | MEA, ml/min | Mol CO2 | Mol MEA | %CO2 out exp | %CO2 out sim |
|---|---|---|---|---|---|
| 55.55 | 0.0 | 1 | 0.0 | 55.55 | 55.55 |
| 55.55 | 490.0 | 1 | 1.97 | 12.6 | 5.0 |
| 55.55 | 594.0 | 1 | 2.40 | 7.0 | 4.3 |
| 55.55 | 755.0 | 1 | 3.00 | 5.1 | 4.0 |
| 55.55 | 874.0 | 1 | 3.50 | 3.5 | 4.0 |
| 55.55 | 1072.0 | 1 | 4.30 | 1.0 | 4.0 |
Table 2 Experiments with gas flow rate of 104 NL/min
| %CO2 | MEA, ml/min | Mol CO2 | Mol MEA | %CO2 out exp | %CO2 out sim |
|---|---|---|---|---|---|
| 12.5 | 0.0 | 0.57 | 0.0 | 12.5 | 12.5 |
| 12.5 | 238.0 | 0.57 | 1.0 | 6.0 | 1.50 |
| 12.5 | 295.0 | 0.57 | 1.2 | 4.8 | 0.55 |
| 12.0 | 410.0 | 0.56 | 1.7 | 2.9 | 0.60 |
| 12.5 | 476.0 | 0.57 | 1.9 | 3.0 | 0.55 |
| 12.0 | 675.0 | 0.56 | 2.8 | 2.2 | 1.00 |
Table 3 Experiments with gas flow rate of 184 NL/min
| %CO2 | MEA, ml/min | Mol CO2 | Mol MEA | %CO2 out exp | %CO2 out sim |
|---|---|---|---|---|---|
| 12.5 | 0.0 | 1.0 | 0.0 | 12.5 | 12.5 |
| 12.5 | 374.0 | 1.0 | 1.5 | 5.0 | 2.10 |
| 12.2 | 479.0 | 1.0 | 2.0 | 4.4 | 0.93 |
| 12.5 | 607.0 | 1.0 | 2.5 | 4.4 | 0.73 |
| 12.5 | 715.0 | 1.0 | 3.0 | 4.0 | 0.68 |
| 12.5 | 715.0 | 1.0 | 3.0 | 3.8 | 0.68 |
| 12.2 | 715.0 | 1.0 | 3.0 | 4.0 | 0.68 |
| 12.2 | 1231.0 | 1.0 | 5.1 | 3.2 | 1.21 |
From the results it is possible to see how the %CO2 drops dramatically when the MEA solution is added and continuous dropping with the increment of MEA solution, as it is expected. However, the results obtained in the simulations do not match with those from the experiments. Looking for an answer for these differences, it was found that the software use efficiency for the structure packing of 24% and it remains always the same being it independent of the flow and concentration used.
Considering that the efficiency varies with the flow rate and the concentration, the efficiency was calculated for each experiment using the Murphree equation, eq. 1
 (1)
(1)
where

EM |
= Murphree efficiency |
y |
= molar gas composition |
x |
= molar líquid composition |
K |
= equilibrium constant líquid-gas |
The Murphree efficiency (EM) values obtained for each experiment were then used in the simulations, giving closer results with those for the experiments.
On the other hand, the absorption eficiency was also calculated, for these case, the next equation was used, eq. 2
 (2)
(2)
where
ηA |
= absorption efficiency |
yOut |
= exit gas molar composition |
yIn |
= input gas molar composition |
The results obtained using the Murphree efficiency in the simulations as well as the absorption efficiency of the experiments are now shown in Tables 4, 5 and 6.
Table 4 Experiments with gas flow rate of 41.6 NL/min
| %CO2 in | MEA, ml/min | Mol CO 2 | Mol MEA | %CO 2 out exp | %CO 2 out sim | % η A | % E M | %CO 2 sim. with E M |
|---|---|---|---|---|---|---|---|---|
| 55.55 | 490.0 | 1 | 1.97 | 12.6 | 5.0 | 88.44 | 18.3 | 10.30 |
| 55.55 | 594.0 | 1 | 2.40 | 7.0 | 4.3 | 93.96 | 22.4 | 5.75 |
| 55.55 | 755.0 | 1 | 3.00 | 5.1 | 4.0 | 95.69 | 23.4 | 4.64 |
| 55.55 | 874.0 | 1 | 3.50 | 3.5 | 4.0 | 97.09 | 25.7 | 3.32 |
| 55.55 | 1072.0 | 1 | 4.30 | 1.0 | 4.0 | 99.19 | 33.8 | 0.83 |
Table 5 Experiments with gas flow rate of 104 NL/min
| %CO 2 in | MEA, ml/min | Mol CO 2 | Mol MEA | %CO 2 out exp | %CO 2 out sim | % η A | % E M | %CO 2 sim. with E M |
|---|---|---|---|---|---|---|---|---|
| 12.5 | 238.0 | 0.57 | 1.0 | 6.0 | 1.50 | 56.9 | 9.50 | 4.1 |
| 12.5 | 295.0 | 0.57 | 1.2 | 4.8 | 0.55 | 65.5 | 11.00 | 3.7 |
| 12.0 | 410.0 | 0.56 | 1.7 | 2.9 | 0.60 | 78.0 | 14.60 | 1.8 |
| 12.5 | 476.0 | 0.57 | 1.9 | 3.0 | 0.55 | 78.4 | 16.00 | 1.9 |
| 12.0 | 675.0 | 0.56 | 2.8 | 2.2 | 1.00 | 83.5 | 18.20 | 1.1 |
Table 6 Experiments with gas flow rate of 184 NL/min
| %CO 2 in | MEA, ml/min | Mol CO 2 | Mol MEA | %CO 2 out exp | %CO 2 out sim | % η A | % E M | %CO 2 sim. with E M |
|---|---|---|---|---|---|---|---|---|
| 12.5 | 374.0 | 1.0 | 1.5 | 5.0 | 2.10 | 62.12 | 10.00 | 3.4 |
| 12.2 | 479.0 | 1.0 | 2.0 | 4.4 | 0.93 | 66.88 | 10.28 | 3.3 |
| 12.5 | 607.0 | 1.0 | 2.5 | 4.4 | 0.73 | 67.78 | 11.20 | 3.2 |
| 12.5 | 715.0 | 1.0 | 3.0 | 4.0 | 0.68 | 70.83 | 11.80 | 3.0 |
| 12.5 | 715.0 | 1.0 | 3.0 | 3.8 | 0.68 | 72.34 | 11.80 | 3.0 |
| 12.2 | 715.0 | 1.0 | 3.0 | 4.0 | 0.68 | 70.00 | 11.45 | 2.9 |
| 12.2 | 1231.0 | 1.0 | 5.1 | 3.2 | 1.21 | 76.20 | 15.25 | 1.8 |
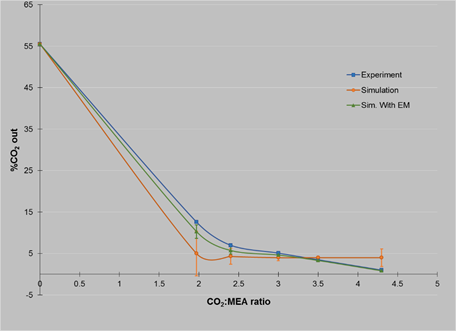
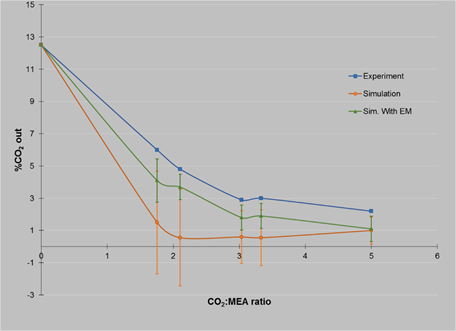
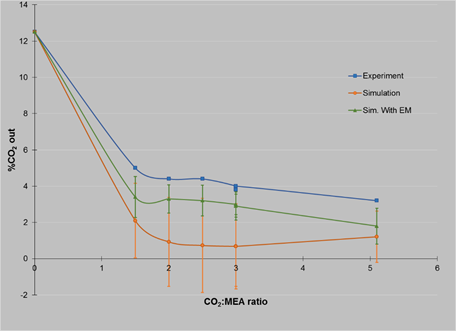
The results for the comparison between the percent CO2 from the outside for experiments and simulations are best understood in Figures 2, 3 and 4, where it is possible to see how the standard deviation decrease with simulations using efficiency calculated with Murphree Efficiency.
Conclusion
From the results it is possible to see how the values matches better between experiments and simulations using in the software the experimental values of efficiency calculated with Murphree Efficiency. However, there is still a gap between them, but this is only about 1%.
It can be seen that there are better results when the gas flow rate is low (41.6 NL/min) and the concentration of CO2 is high (55.5%), in these experiments, the percentage of absorption was up to 99% for a CO2: MEA ratio of 1:4.3 and 88.4% for a ratio of 1:2.
For the case of a gas flow rate of 104 NL/min with CO2 concentration of 12.5 %, it was possible to have an absorption of 83.5% with a CO2: MEA ratio of 1:5 and 65.5% for a ratio of 1:2. These values are similar to those obtained using a gas flow rate of 184 NL/min with CO2 concentration of 12.5%, where the percentage of absorption was 76.2 for a CO2: MEA ratio of 1:5 and 66.88% for a ratio of 1:2.

