


 nova página do texto(beta)
 Inglês (pdf)
 Artigo em XML
 Referências do artigo
 Enviar este artigo por email
 Citado por SciELO
  Similares em
SciELO
Similares em
SciELO 
 Permalink
Introduction
In 1987 the Brundtland Report defined sustainable development (SD) as a development that can meet the needs of the present without endangering the ability of future generations to meet their own needs (WCED, 1987). This sort of development lies on a harmonious relationship between three main dimensions, namely: Economic, social and environmental.
From an energy point of view, SD demands the access to clean, safe, reliable and affordable energy sources (Vera et al., 2005). Renewable energy sources (RES) can help achieve energy sustainability objectives as they offer benefits for energy security, greenhouse gases (GHG) mitigation, job creation, rural development and energy access (REN21, 2012). It is estimated that RES supplied 16.7% of global final energy consumption in 2010, most of which through some form of biomass energy (REN21, 2012). Biomass consists of different types of non-fossil organic matter that can be used directly for energy production (traditional biomass) or processed to solid, liquid or gaseous fuels (modern biomass). One of the latter is biogas, a byproduct of anaerobic degradation (AD) composed of methane (CH4), carbon dioxide (CO2) and traces of other gases.
In the developing world, deployment of biogas technology has taken place mainly in rural locations by means of small-scale units fed by animal manure and the biogas being used for domestic applications (Bond and Templeton, 2011). One of the major uses of biogas is as cooking fuel having the advantage of a cleaner and more efficient combustion than traditional biomass fuels (Smith et al., 2000; Zhang et al., 2000). Biogas also favors sustainable energy use in rural settlements by reducing the overexploitation of forest resources for fuel wood extraction, the incidence of health problems derived form the use of low quality fuels and the workload for fuel wood collection (Gosens et al., 2013).
In Mexico in 2010 there were 721 biogas projects across the country, nearly half of which (354) were under construction, mainly for treating manure from large hog farms (FIRCO, 2011). To further boost biogas technology dissemination within the country, other locations, scales and feedstocks should be explored. The organic fraction of municipal solid waste (OFMSW) emerges as one of the most attractive alternative substrates for biogas production (Müller, 2007; Khalid et al., 2011; Curry and Pillay, 2012). Mexico City alone generates approximately 12,500 t/day of municipal solid waste (MSW) of which 49.5% corresponds to organic materials (Duran-Moreno et al., 2013).
Due to its amount and composition, the OFMSW requires an adequate management to avoid negative impacts on the environment and human health. Unfortunately, main cities in developing countries regularly manage their MSW in an unsuitable way. For instance, 32% (7,800 t/day) of the MSW transported to the 13 transfer stations in operation in Mexico City was directly sent to final deposition as well as more than 85% of the input waste of the three selection plants in the city (SEDEMA, 2012). As a result, final deposition capacity runs out rapidly (Curry and Pillay, 2012). The use of OFMSW for biogas production constitutes an approach to reduce the waste stream sent to final deposition sites and to give a proper treatment for this enormous volume of residual biomass.
Decentralized production of biogas from OFMSW implies the deployment of biogas technology in the urban scenario where specific energy sustainability issues converge. The influence of biogas on such issues may be expressed in terms of its impact on energy sustainability concerns. A set of indicators related to SD dimensions can then be formulated to measure the effect of biogas on such sustainability aspects.
Work has been done dealing with biogas sustainability assessment. Sustainability of biogas systems commonly used in Kenya was evaluated by Nzila et al. (2012) considering indicators in the economic, environmental and technical sustainability dimensions. In the rural China context, Gosens et al. (2013) assessed the contribution of domestic biogas digesters to sustainability objectives using indicators relative to human health, environment and poverty alleviation applied to a sample of households with and without digesters.
Cited works, however, evaluate biogas contributions in the context of rural communities. Decentralized use of biogas technology in urban areas requires similar analyses but taking into account the economic, social, environmental and energy particularities of these settlements. Aside from the potential benefits to MSW management, the possible change on commercial fossil fuel consumption patterns should also be weighted. For example, it is calculated that 96% of Mexican urban households uses liquefied petroleum gas (LPG) for cooking (INECC, 2009) contributing to place the country as the world's second larger per capita LPG user (65 kg per inhabitant) (SENER, 2012).
The aim of this paper is to formulate a set of energy sustainability indicators for the economic, social and environmental dimensions to assess the impact of a small-scale biogas plant on the energy sustainability of a restaurant located in Mexico City. The biogas plant is fed by mixed food waste (MFW) from the restaurant and biogas is used as cooking fuel at the restaurant.
The features of the restaurant relevant to this work are detailed in Section 2. Section 3 describes biogas plant components and operating principle. Section 4 focuses on the formulation and calculation of the energy sustainability indicators. Section 5 presents and discusses the results, and Section 6 is devoted to the conclusions.
Restaurant
Restaurant is located in Ciudad Universitaria, central campus of the National Autonomous University of Mexico in Mexico City, Mexico. The restaurant operates six days a week (Monday to Saturday), serves on average 600 dishes per day and its incomes are around MXN 63,000 per week, according to restaurant's manager. The establishment generates on average 40.5 kg per day of MFW. Note that to date none fee is paid by the restaurant for the collection and deposition of its solid wastes.
Restaurant uses LPG as main fuel for cooking with an estimated consumption level of 264.5 kg per week, i.e. about 12,122 MJ considering a heating value of 45.8 MJ/kg. Since it was assumed that LPG is exclusively used for cooking, the 12,122 MJ was taken as the restaurant's weekly final energy demand for cooking.
Biogas plant
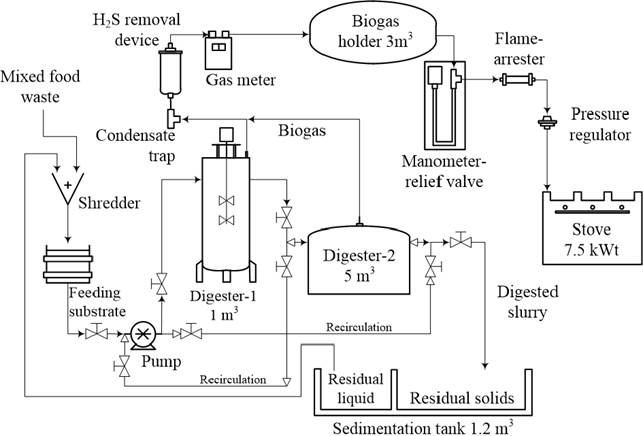
The biogas plant was installed right next to the restaurant which provides the MFW used as feedstock. Physicochemical characteristics of MFW were experimentally determined previously (Table 1). The plant is daily fed by 40.5 kg of MFW that is put into a shredder where water is added for adjusting solids concentration to meet wet digestion standards (Figure 1). A pump transfers the substrate to the first anaerobic digester (D-1), a 1m3 CSTR type, where the first stages of AD take place. Pre-digested substrate flows from D-1 to the second anaerobic digester (D-2), an adapted HDPE tank of 5m3. The substrate in D-2 is homogenized by pump-aided external recirculation. Once both anaerobic digesters are full and D-1 is fed by fresh substrate, D-2 is automatically fed by pre-digested effluent from D-1 while a similar volume of digested sludge leaves D-2 and is put in the sedimentation tank to separate residual liquid and solids. The plant operates at ambient temperature with an organic loading rate of 1.9 kgTVS/m3d and a hydraulic retention time of 86 days. The stove that uses biogas has three burners of 2.5 kWth each one whose injector orifice and flame ports were resized to correctly operate with biogas.
Table 1 Physicochemical characteristics of restaurant mixed food waste
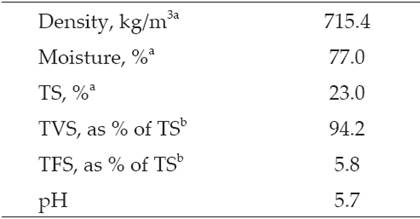
a On a wet basis
b On a dry basis
Based on the above operating conditions, biogas plant production amounts to 6.1 m3 of biogas per day with a CH4 content of 56% by vol. corresponding to a heating value close to 20 MJ/m3. As a result, biogas energy contribution accounts for 122 MJ per day or 732 MJ per week.
Methodology
Construction of scenarios
For assessing the impact of the biogas plant on restaurant's energy sustainability, two scenarios were stated. The first scenario, named base scenario, portrays the restaurant before biogas plant installation so that final energy demand for cooking is entirely covered with LPG bought to a commercial supplier at a price of 11.5 MXN/kg. The second scenario, named biogas scenario, consists of the restaurant after biogas plant installation and biogas being used as supplementary fuel for cooking at the restaurant. For both scenarios, the restaurant's final energy demand for cooking was assumed to remain constant at 12,122 MJ per week.
Energy sustainability indicators
A set of indicators relative to the economic, social and environmental sustainability dimensions was developed. Sustainability aspects examined by the indicators were intended to be relevant for the restaurant's energy sustainability. Previous works on energy sustainability indicators (Salgado and Altomonte, 2001; CEPAL et al., 2003; IAEA et al., 2005; Vera et al., 2005) were reviewed to help define those aspects. Indicators were calculated for each of the abovementioned scenarios and then compared to see the impact of biogas on the restaurant's energy sustainability. For comparative purposes, indicators were linearly normalized taking a value between 0 and 1, corresponding to a growing degree of energy sustainability.
Economic dimension indicators
The first indicator was named cooking energy cost (CEC) and quantifies the unit cost of final energy for cooking in MXN/MJ as follows
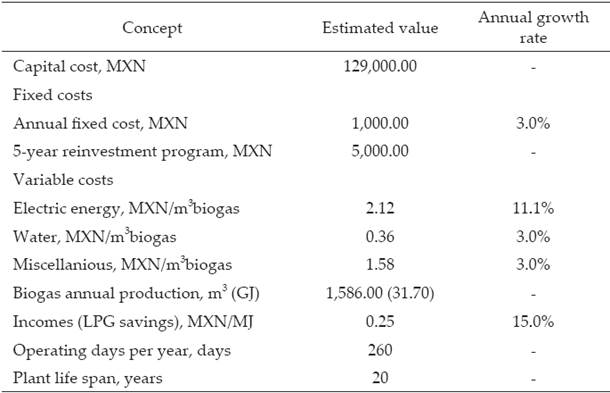
Where LUCi and Ei denote the levelized unit cost in MXN/MJ and the weekly energy contribution of cooking fuel i in MJ, respectively, and TEDC is the restaurant's weekly final energy demand for cooking in MJ. In case of LPG, LUC was estimated considering a price of 11.5 MXN/kg of LPG (0.25 MXN/MJ) and a price annual growth rate of 15%. In case of biogas, LUC was calculated based on the biogas plant techno-economical features (Table 2). In both cases, a time frame of 20 years and a minimum accepted rate of return (MARR) of 6% were set. This indicator was normalized assuming that since Mexico is a developing country a lower energy cost corresponds to a higher level of energy sustainability as it would propel energy access. However, it is difficult to determine to what extent energy cost should be reduced. Therefore, normalization criterion arbitrarily states that zero and one correspond to a cooking energy cost 30% higher and 30% lower than that for the base scenario, respectively.
Aside from the price of energy, it is important to examine to what extent meeting energy needs might affect the economical ability to satisfy other needs. For this reason, it was formulated the indicator share of restaurant income spent on energy for cooking (SISEC) computed as follows
Where LUCi and Ei are the levelized unit cost in MXN/ MJ and the weekly energy contribution of cooking fuel i in MJ, respectively, and Income denotes the levelized value of restaurant incomes per week in MXN. The latter was calculated using a MARR of 6%, a time frame of 20 years and an incomes growing rate of 3% per year. For normalizing the indicator, zero and one were associated to the SISEC calculated considering a cooking energy cost 30% higher and 30% lower than that for the base scenario, respectively.
The last indicator for this dimension relates to the topic of reliability of energy supply and was named certainty on cooking energy availability (CCEA). It was computed as below
Where Ci and Ei are, respectively, the certainty on the availability and the weekly energy contribution in MJ of cooking fuel i, and TEDC is the restaurant's weekly final energy demand for cooking in MJ. In case of LPG, it was assumed that CLPG is equal to 1 (100%) since timely fuel provision is virtually assure given the large number of suppliers in the Mexico City market. With respect to biogas, different factors influence AD performance (Khalid et al., 2011) affecting biogas production and its composition. In the light of this, the following expression was defined to estimate the Cbiogas
Where c.v.biogas is the coefficient of variation of biogas production, i.e. the standard deviation divided by the mean of biogas generation records over a given period. It was proposed as a roughly estimate of biogas production fluctuation. In their study, Nzila et al. (2012) use a similar indicator named operational reliability that quantifies the digesters supplying biogas without requiring extensive refurbishment. However, it could be argued that aside from an uninterrupted supply, a stable composition and production level are also decisive for biogas system reliability. Consequently, the indicator in the present work was explicitly linked to the stabilization on biogas production which at the same time entails a regular supply. Given that the biogas plant was recently put into operation, reliable production records are still missing. So, the Cbiogas was estimated based on biogas production data reported in Viswanath et al. (1992). Note that this indicator is normalized directly.
Social dimension indicators
A primary topic in the social dimension has to do with the effects of energy use on human health. Therefore, an indicator called urban air quality (UAQ) was proposed. It measures the emissions of the following air pollutants from cooking fuel use: Carbon monoxide (CO), total non-methane organic compounds (TNMOC) and total suspended particles (TSP). These air pollutants are byproducts of incomplete combustion and have detrimental effects on human health (Fernandez, 2011). Cooking fuel emissions comprise many other pollutants, although in this case only those whose emission factors were found in the literature were considered. Note that the indicator is not related to indoor air quality since biogas stove is outside the restaurant building so emissions are dispersed in the outdoor environment. Emissions of air pollutant i (APi) were estimated as below
Where EFij is the emission factor of air pollutant i for cooking fuel j in g/MJ, and Ej is the weekly energy contribution of cooking fuel j in MJ. In view of the characteristics of the restaurant's stove, emission factors reported by Smith et al. (2000) were used (Table 3). For each air pollutant, emissions were normalized under de following criterion: One equals to nil emissions while zero corresponds to emissions computed with the higher emission factors for the examined pollutants as reported in Smith et al. (2000). These emission factors are: 10.700 g/MJ for CO (measured for charcoal), 2.694 g/MJ for TNMOC (animal dung), and 1.187 g/MJ for TSP (rice straw). The simple average of normalized emissions in each scenario was taken as the UAQ indicator.
Table 3 Ultimate emission factors of selected air pollutants for LPG and biogas. Source: Smith et al. (2000)
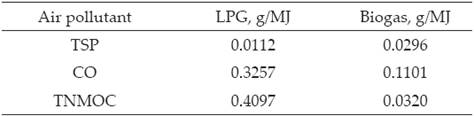
TSP: total suspended particles
TNMOC: total non-methane organic compounds
Energy independence (EI) was the second indicator for the social dimension. It relates to the share of restaurant's final energy demand for cooking that is not covered by external energy supply. Authors such as Nzila et al. (2012) also dealt with this aspect, but from and economic point of view coupling the respective indicator to monetary savings arising from fossil fuel substitution for biogas. However, it could be said that the energy independence notion is more accessible in the way it was defined here, i.e. as the portion of energy that is produced by one's own means. From the restaurant perspective, LPG represents an external energy flow because the fuel is bought to a commercial supplier. In contrast, biogas is produced right next to the restaurant using its MFW as feedstock. The indicator was determined by the following equation
Where Ebiogas is the weekly energy contribution of biogas in MJ and TEDC is the restaurant's weekly final energy demand for cooking in MJ. The indicator is normalized directly. Note that the term Ebiogas refers to energy that is produced in the same site where it is consumed. So other decentralized energy technologies such as solar PV or wind might be included in this term.
The third indicator for this dimension was useful energy for cooking (UEC). It measures the useful energy obtained from final energy for cooking per served dish. Useful energy depends on the efficiency of energy conversion processes and it can be considered the part of energy that translates into social wellbeing. The indicator was computed as follows
Where ηi and Ei denote the conversion efficiency and the weekly energy contribution of cooking fuel i in MJ, respectively, and Dishes is the average of dishes served by the restaurant over a week. Global thermal efficiencies for LPG and biogas as reported by Smith et al. (2000) were used (i.e. 53.6% for the former and 57.3% for the latter). Criterion for normalizing the indicator stated that zero and one equal to the useful energy obtained with a conversion efficiency of 8.2%, i.e. the lower reported by Smith et al. (2000), and 80%, i.e. the typical value for electricity.
Environmental dimension indicators
Since carbon dioxide (CO2) is the most important anthropogenic GHG and its main source is fossil fuel consumption (IPCC, 2007), an indicator named carbon intensity (CI) was formulated. It quantifies the average CO2 emissions from cooking fuel consumption only per served dish. The indicator was calculated as below
Where CO2EFi is the CO2 emission factor of cooking fuel i in gCO2/MJ, Ei is the weekly energy contribution of cooking fuel i in MJ, and Dishes is the average of dishes served by the restaurant over a week. For LPG, the CO2 emission factor used was 67.3 gCO2/MJ (Smith et al., 2000). For biogas, it was assumed that its combustion is CO2 neutral. As biogas proceeds from non-fossil biomass which restitution, presuming that it occurs in a sustainable way, implies the absorption of CO2 from the atmosphere in a similar amount than that released from its combustion (Akella et al., 2009). Normalization was carried out equaling one to a CI of 0.0 gCO2/dish and zero to a CI obtained with an emission factor of 141.2 gCO2/MJ, i.e. the higher within the group of nonbiomass cooking fuels examined by Zhang et al. (2000).
To observe the effect on direct GHG (CO2, CH4 and N2O) emissions, an indicator called global warming mitigation (GWM) was proposed. In this case, emissions in terms of kgCO2 equivalent (kgCO2e) from both cooking fuel consumption and MFW anaerobic decomposition were quantified. The former was estimated as below
Where
EFij = emission factor of GHG i for cooking fuel j in g/MJ (Table 4)
Table 4 Ultimate emission factors of CO2, CH4 and N2O for LPG and biogas. Source: Smith et al. (2000)
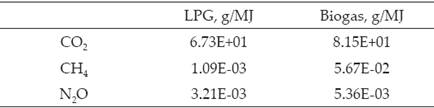
Ej = weekly energy contribution of cooking fuel j in MJ
GWPi = global warming potential of GHG i according to IPCC (2007) (CO2=1, CH4=25, N2O=298).
Again, biogas combustion was assumed to be CO2-neutral.
In the base scenario, it was assumed that the MFW is not properly managed to prevent the release to the atmosphere of the CH4 from anaerobic decomposition. For simplicity, it was assumed that the released volume of CH4 is the same to that produced by the biogas plant, i.e. 20.5 m3CH4 per week. This volume was multiplied by the CH4 density (0.67 kg/m3 @20°C and 1 atm) and then by the CH4 GWP to obtain its equivalent in kgCO2e. The result was added to the GHG emissions from LPG use. In the biogas scenario, avoided GHG emissions from both LPG savings and CH4 destruction were taken into account. Fugitive emissions were omitted in both scenarios.
Emission reduction from base scenario to biogas scenario was determined by the following equation
Where GHGbase and GHGbiogas denote the direct GHG emissions in the base and biogas scenarios, respectively. Note that the indicator is normalized directly.
The last indicator for this dimension was named solid waste management (SWM). It quantifies the share of restaurant's solid waste that avoids final deposition. Although waste management is not explicitly related to energy sustainability, it is relevant to SD due to the environmental and health problems derived from an inadequate collection, treatment and disposal of wastes. The indicator was determined as below
Where SWtreated refers to the daily amount in kilograms of MFW used for feeding the biogas plant and SWtotal is the total amount in kilograms of solid waste produced at the restaurant per day. The latter was estimated based on bibliographic data since only MFW generation was recorded during fieldwork. According to DSM (2002) and CDM (2010), food scraps account for around 60% (by weight) of restaurant solid waste stream. Then, it was established that MFW represents 60% of restaurant's total solid waste production. In addition, it was assumed that before biogas plant installation all solid waste produced at the restaurant was sent to final deposition. Note that the indicator is normalized directly.
Finally, total scores for each dimension and scenario were calculated as the simple average of corresponding normalized indicators.
Results and discussion
Economic dimension indicators averaged 0.67 in the base scenario and 0.68 in the biogas scenario (Table 5). Despite LUC of biogas (0.82 MNX/MJ) was lower than that for LPG (1.00 MXN/MJ), its positive effect on the CEC indicator was diluted due to the modest contribution of biogas energy so the indicator showed a marginal change. For the same reason, the SISEC indicator registered a positive but modest variation. In contrast, the CCEA indicator decreased in the biogas scenario because of the uncertainty on biogas availability (Cbiogas=0.79). However, the indicator remained high since in the biogas scenario LPG continues meeting the major part of the restaurant's final energy demand for cooking. In spite of that, in the long-term the availability of LPG is likely to reduce because of growing scarcity of fossil resources. These results indicate that the impact of the biogas plant on the economic dimension was marginal as reported by analogous studies (Gosens et al., 2013).
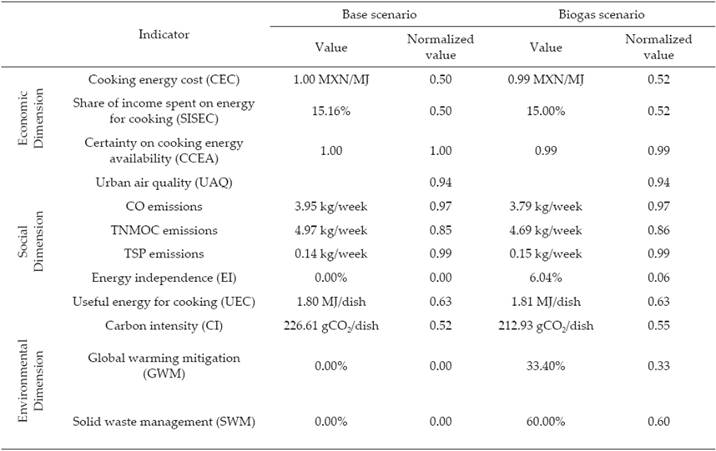
Social dimension indicators averaged 0.52 in the base scenario slightly increasing in the biogas scenario to 0.54. The UAQ indicator in the biogas scenario reported a reduction in TNMOC and, to a lesser extent, CO emissions, but an increase in those of TSP. Nevertheless, the indicator was unaffected by these changes and maintained the same value in both scenarios. It is worth mentioning that the observed reductions respond only to the effect of fuel substitution since additional modifications in the stove for controlling air pollutant emissions were not considered. The improvement in the EI indicator means that the restaurant is 6% less dependent on the external supply of energy for cooking. By comparison, in rural households biogas might represent 8-22% of their energy balance (Gosens et al., 2013). The values of EI and CCEA indicators in the base scenario might seem contradictory. Despite both indicators relate to cooking energy availability, the former measures only the energy generated in situ, whereas the latter accounts for the energy that is ready to be used by the restaurant regardless its origin. With respect to the UEC indicator, the little difference between conversion efficiencies of biogas and LPG along with the modest energy contribution of the former, caused that the indicator remained the same in both scenarios.
The most significant changes were seen on the environmental dimension indicators. In the base scenario their average score was 0.17, whereas in the biogas scenario it rose to 0.49. The minor change was observed on the CI indicator since CO2 emissions per served dish just decreased 6%. The GWM indicator experienced the major positive change owing to the reduction of direct GHG emissions from 1,171.11 kgCO2e/week in the base scenario to 779.96 kgCO2e/ week in the biogas scenario, which means a 33.4% drop. The main cause of this reduction was the capture and destruction of the CH4 from MFW anaerobic decomposition (-343.38 kgCO2e/week). Emissions avoided from LPG substitution were of lesser magnitude because LPG is a modern fuel with low carbon content. What is more, CH4 and N2O emissions from cooking fuel use augmented in the biogas scenario, 0.33 to 1.35 kgCO2e/week and 11.60 to 12.06 kgCO2e/ week, respectively, although their effect was canceled by avoided CH4 emissions form MFW treatment. The study carried out by Gosens et al. (2013) reports larger GHG reductions from fuel substitution as biogas replaces for low quality solid fuels for cooking. The SWM indicator also experienced a dramatic progress which in some way points to the potential contribution that biogas technology can make to a proper solid waste management in the cities of developing countries. It is worth mentioning that Gosens et al. (2013) also report the most relevant benefits of biogas on aspects related to the environmental dimension of sustainability.
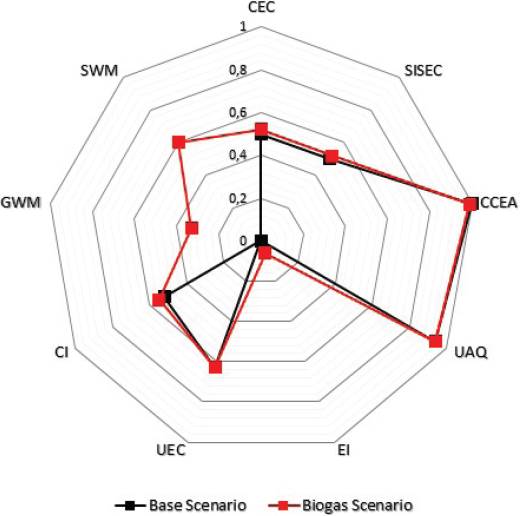
In overall terms, the average score of all indicators in the base scenario was 0.45 while that in the biogas scenario was 0.57. The aforementioned result can be seen graphically as the area formed by the normalized values of indicators in the biogas scenario is larger than that formed by the indicators corresponding to the base scenario (Figure 2), that indicates a higher level of energy sustainability.
Conclusions
Biogas technology has aided in mitigating some sustainability problems in rural locations in the developing world and may also contribute to lessen those prevailing in urban settings. In the present work a set of nine indicators in the economic, social and environmental sustainability dimensions was built for assessing the impact of a small-scale biogas plant on the energy sustainability of a restaurant in Mexico City.
In the light of sustainability items examined by the indicators, the biogas plant improves restaurant's energy sustainability in all the three aforementioned dimensions with economic and social dimension indicators experiencing the less significant changes. Limited effect of the biogas plant on this subgroup of indicators is due in part to the availability of commercial fossil fuels at affordable prices in large cities like Mexico City, a situation that overshadows economic and social benefits of alternative energy sources.
Environmental dimension indicators, on the other hand, register the most dramatic positive changes. In the view of this, biogas technology promotion in cities of developing countries should highlight these potential environmental contributions such as improved solid waste management and GHG mitigation.
The modest share of biogas energy on restaurant's cooking energy requirements leads to a weak impact on most of the energy sustainability indicators. However, site specific conditions, for example, fuel supply and prices, energy consumption patterns as well as income level of population, are also important in assessing the impact of an alternative energy technology on sustainability concerns.
Generation of first-hand information to replace data taken from bibliography could be carried out as a future work along with extending system boundaries to get a more accurate evaluation of the biogas plant sustainability impact.
Indicators may be applied, directly or with modifications, for evaluating other energy technologies. Likewise, they could complement to indicators proposed by other authors to create a more robust instrument for sustainability evaluation. The identification and measuring of potential benefits of biogas technology on energy sustainability in cities of developing nations provide objective elements to encourage the implementation of this technology as an element for constructing a sustainable development pathway for such human settlements.

