


Servicios Personalizados
Revista
Articulo
 Inglés (pdf)
 Artículo en XML
 Referencias del artículo
 Enviar artículo por email
Indicadores
-
 Citado por SciELO
 -
 Accesos
Links relacionados
-
 Similares en
SciELO
Similares en
SciELO
Compartir

 Permalink
Ingeniería, investigación y tecnología
versión On-line ISSN 2594-0732versión impresa ISSN 1405-7743
Ing. invest. y tecnol. vol.14 no.1 Ciudad de México ene./mar. 2013
Optimization of Power Train and Control Strategy of a Hybrid Electric Vehicle for Maximum Energy Economy
Optimización del tren de potencia y la estrategia de control de un vehículo eléctrico híbrido para máxima economía de energía
Osornio-Correa C.1, Villarreal-Calva R.C.2, Molina-Cristóbal A.3, Estavillo-Galsworthy J.4 y Santillán-Gutiérrez S.D.5
1 Departamento de Ingenierías División de Ciencia, Arte y Tecnología Universidad Iberoamericana. E-mail: cuitlahuac.osornio@uia.mx
2 Departamento de Ingenierías División de Ciencia, Arte y Tecnología Universidad Iberoamericana. E-mail: carlos.calva@gmail.com
3 Department of Engineering Engineering Design Centre University of Cambridge. E-mail:am664@cam.ac.uk
4 Departamento de Ingenierías División de Ciencia, Arte y Tecnología Universidad Iberoamericana. E-mail: joshua.estavillo.galsworthy@gmail.com
5 División de Ingeniería Mecánica e Industrial Facultad de Ingeniería Universidad Nacional Autónoma de México. E-mail: saulsan@unam.mx
Information on the article: received: October 2010.
Reevaluated: February 2011.
Accepted: April 2012.
Abstract
A solution to increase fuel economy in Hybrid Electric Vehicles derived from physical characteristics of the vehicle, the powertrain and the control strategy is presented. A heuristic Control Map is created to analyze the restrictions and benefits of using either of the onboard power plants under different driving conditions. The control strategy follows the Control Map with a logic that responds to the Battery State of Charge. Finally, a case study demonstrates the increase in fuel economy and charge sustainability; here, the variables studied are submitted to a Multi-Objective Genetic Algorithm Optimization.
Keywords: Hybrid Electric Vehicle, control strategy, multi-objective optimization, heuristic optimization.
Resumen
Se presenta una solución para incrementar la economía de combustible en Vehículos Eléctricos Híbridos derivada de las características físicas del vehículo, el tren de potencia y la estrategia de control. Se crea un mapa de control heurístico para analizar los beneficios y restricciones al utilizar las plantas de potencia instaladas en diferentes condiciones de manejo. La estrategia de control utiliza el Mapa de Control asociado a una lógica que responde al estado de carga de las baterías. Finalmente, en un estudio de caso se demuestra el incremento en la economía de combustible y la sustentabilidad en la carga de las baterías; aquí, las variables estudiadas se someten a un algoritmo de optimización multi-objetivo.
Descriptores: Vehículo Eléctrico Híbrido, estrategia de control, optimización heurística, optimización multi-objetivo.
Introduction
Hybrid Electric Vehicles (HEVs) have emerged as an alternative to reduce fuel consumption and pollutant emissions while maintaining vehicle performance. The first attempts to optimize HEV's performance focused on proper selection of the Powertrain (PT) components, such as the Internal Combustion Engine (ICE), Electric Motor (EM), battery pack and transmission (Liang et al., 2000). Recent work also improves the Control Strategy which regulates the energy flow between prime movers, transmission, batteries and wheels to accomplish driver demand (Morteza et al., 2006; Amr et al., 2006; Kyoungcheol et al., 2007; Pezzini et al., 2000).
In this paper a Control Strategy for a parallel HEV is proposed. This strategy uses a control map and a set of conditions that respond to the Battery State of Charge (SOC) to improve fuel efficiency. The main input control variables are power demanded, vehicle's speed and the battery SOC. The control map is based on the Basic Engine Operating Line (BEOL) and transmission kinematics (Koichiro et al., 2004). The novelty of this control map is that it clearly identifies important considerations, among others, in which cases the ICE must operate in low efficiency conditions without being substituted by the EM or when the capacity to charge the battery is restricted. All of these happen while fuel consumption is minimized, vehicle's performance is kept and charge sustainability is guaranteed.
This work is composed of the following sections:
□ The section on the flexible transmission presents the hardware configuration of the PT outlining the transmission.
□ The section about control strategy describes the novel Control Map developed with velocity and power as coordinate axes. Each area of the Control Map corresponds to a specific HEV operating mode with its own energy flow characteristics.
□ The section on the electric system presents its main characteristics and introduces the strategies to achieve charge sustainability, with battery life expectancy in mind.
□ The section on optimization is a case study, where dynamic characteristics of a commercial vehicle are used with the PT parameters and Control Strategy variables submitted to a Multi-Objective Genetic Algorithm (MOGA).
Characterization of the flexible transmission
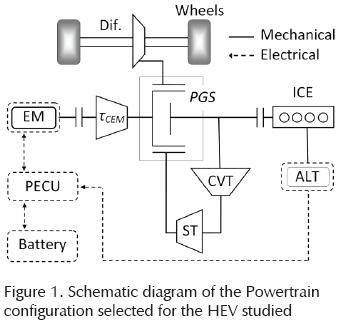
The PT of a HEV must be capable of managing energy from two power sources and deliver it to the wheels; the selected configuration analyzed in this study is shown in Figure 1.
Operation modes of the flexible transmission with the PT
This transmission is composed of a Planetary Gear Set (PGS), a Continuous Variable Transmission (CVT) and a Simple Train (ST). The ST has an idle gear to make the ICE, the sun and the ring spin in the same direction. This PT configuration was selected because it allows each power source to work independently or together. Additionally, this configuration also permits the recovery of energy from the wheels; therefore this HEV is capable of operating in conventional, electric, series hybrid or parallel hybrid mode (Anderson, 1999).
□ Conventional: In conventional mode the EM is not used. The ICE supplies all required power to accomplish the drive cycle demand and all excess energy generated is sent to charge the batteries as defined by the control strategy (Salmasi, 2007). The mechanical energy flow goes as follows: the ICE is engaged to the CVT, the energy passes to the ring of the PGS through the ST and the ring of the PGS is connected to the differential which distributes the energy to the wheels.
□ Electric: In electric mode the power to move the vehicle is provided by the batteries through the EM. The mechanical energy flow goes as follows: The EM is engaged to the carrier with a mechanical reduction, its energy is split to the sun and the ring gears of the PGS. The energy that goes to the sun is also transmitted to the ring through the CVT and the ST. The energy transmitted to the ring passes to the wheels through the differential. While in regenerative breaking the energy flow inverts and the EM works as a generator sending back part of the vehicle's kinetic energy to the batteries.
□ Series hybrid: In series hybrid mode, the vehicle works as in electric mode, but instead of using the battery energy, the ICE, through the alternator, provides electrical energy to the EM and recharges the batteries. This mode works when the rotational speed of the ICE is below the adequate efficiency to be connected to the wheels; hence it is used to increase the Battery State of Charge (SOC).
□ Parallel hybrid: In parallel hybrid mode, the ICE and EM work together. The ICE is connected to the shaft of the sun gear and defines the rotational speed of the ring gear through the CVT and the ST. As the ICE sets two degrees of freedom for the PGS, the rotational speed of the arm is defined, and therefore, the angular velocity of the EM and the rotational speed of the wheels. In this mode, the EM adds torque to accomplish the drive cycle demands.
Analysis of the PT parameters in energy transformations
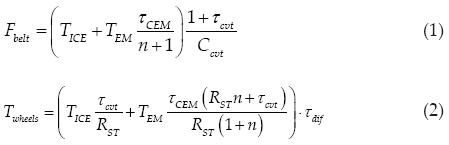
The mechanical energy transformation from the power sources to the wheels is characterized by equations 1, 2, 3 and 4. These are derived from: equilibrium equations
of the PGS, the Willis equation (Santoro, 2000) and the kinematic relationship between ωcarrier and ωsun through the CVT and the ST which force the carrier and the sun to spin in the same direction; see (appendix 1, 2) appendix 3 for a detailed explanation. Table 1 shows the definitions for each of their variables.
While ICE is coupled to the Wheels,
When the ICE is not coupled to the wheels,
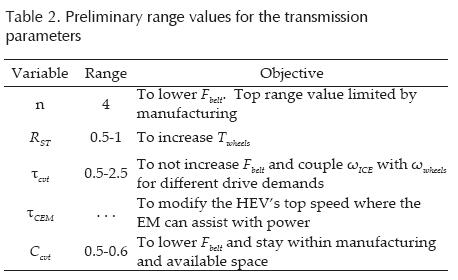
Due to the CVTs belt force limitations it is a design priority to minimize the strength to which it is submitted (Gomez et al., 2004). Equation 1 shows an inverse relationship among Fbelt, n and Ccvt alike. It can also be observed that an increase in τcvt, causes an increase in Fbelt.
Therefore, to protect the belt it is necessary to select a CVT with high overdrive and limited underdrive (0.5 < τcvt < 2.5). Concerning n, the highest possible value must be selected. Finally, a CVT with the greatest Ccvt permitted by space and manufacturing must be selected.
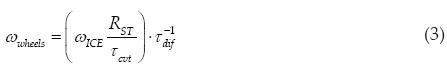
Equation 2 shows that it is not easy to evaluate the influence of τcvt, RST and n in torque transformation from power sources to the wheels. As it has been established the n must be increased as much as possible. To do this an algorithm in Matlab® that evaluates the torque transformation from the power source to the wheels in tentative range within values for τcvt and RST is used.
For the analysis, the following ranges of values are used: TEM = 100 Nm, TICE = 100 Nm, τdif = 3, τCEM = 1, n = 4, 07 < τcvt < 4 and 0.7 < RST < 1.3. Figure 2 is obtained from this analysis.
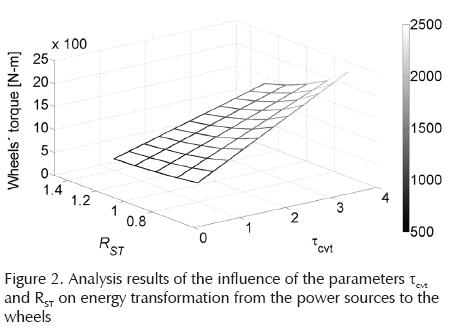
It can be observed that lower values of RST and higher values of τcvt both increase Twheels and that the influence of τcvt is higher than the influence of RST, especially when operating in underdrive conditions. Therefore it is recommended to set the value of RST < 1 and it is concluded that the main torque multiplier available is τcvt.
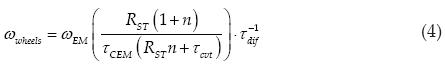
Equation 3 applies when the HEV works in conventional or hybrid parallel modes. It shows that the CVT couples the rotational speed of the ICE and the wheels because all other parameters are fixed once the transmission is built.
Equation 4 is valid when the vehicle works in electric or hybrid series mode. Once the ranges of values for RST, n and τcvt have been established, the τCEM is left to be defined. Variable τCEM fixes the top angular velocity of the EM with the vehicle's top speed where the EM can assist the ICE. This speed is defined in the following section.
The previous analysis produces Table 2, defining each transmission parameter and their proposed ranges.
Control strategy based on the PT parameters and fuel economy
Construction of the Control Map
Given the values of the PT parameters it is possible to generate each curve of the graph Power (W) vs. Speed (V) shown in Figure 3.
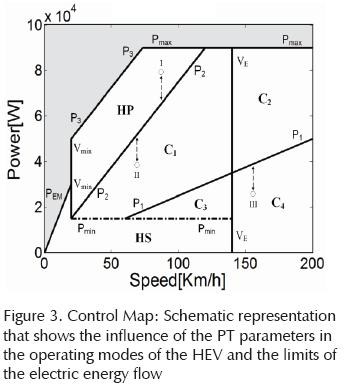
□ Curve Pmin corresponds to the minimum power to start the ICE mechanically connected to the wheels. This control parameter seeks to improve fuel economy by shutting down the ICE under low power demand conditions.
□ Curve Pmax corresponds to the top power the ICE can deliver (factory data).
□ Curve PEM represents the maximum power the EM can deliver as a function of the vehicle's speed (V).
□ Curve P1 is a function of V that gives the minimum power that the ICE can deliver working on its Basic Engine Operating Line (BEOL) (Koichiro et al., 2004; Morteza et al., 2006), corresponding to the minmuim Tcvt.
□ Curve P2 is a function of V that gives the maximum power the ICE can deliver working on its BEOL, corresponding to the maximum Tcvt.
□ Curve P3 is the sum of curves P2 and the nominal power of the EM, resulting in the total available power at V.
□ Vertical line Vmin represents the minimum required velocity to connect the ICE to the wheels (Morteza et al., 2006). It passes through the intersection of Pmin and P2.
□ Curve VE represents the top speed selected for which the EM can deliver power.
Curves P1 and P2 are explained by the BEOL of the ICE, which states that for each ωICEthere is one optimal , therefore there is one optimal power. From this, ωICE (P) gives the angular velocity of the ICE as a function of power demanded which multiplied by Equation 3 and the wheel radius (rwheel) creates a relationship among power demanded, ωICE and vehicle speed that depends on the BEOL and the instantaneous Tcvt value. If we consider that once the HEV is built, the only variable not fixed is Tcvt and that its value must fall between its two limits (overdrive and underdrive) we get to the next equations for P1 and P2 (Note: The independent variable is power and the dependent variable is speed):
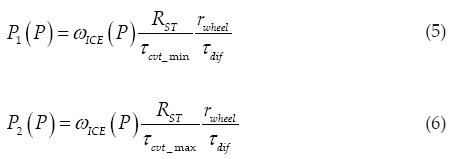
Where P1(P) and P2(P) are speed limits (maximum and minimum) of the vehicle for each power delivered by the ICE while it works on its BEOL.
The Control Map and the operation modes
The Control Map curves create areas that are closely related to the operation modes of the HEV.
Curves PEM, Vmin, VE and Pmin create area HS. In HS the HEV operates in hybrid series or electric modes. Once the PT is designed and build, the only parameter left to be modified by the control strategy is Pmin. When Pmin is increased it intersects P2 at a higher V, moving curve Vmin to the right, therefore the HS area is increased as well as the hybridization grade.
Curves P1, P2, Pmin, VE and Pmax create areas C1 and C2. In these areas the HEV works in conventional mode and the ICE operates on its BEOL. C1 and C2 are areas with minimum loss of energy. The difference between C1 and C2 resides on the capacity of the EM to assist the ICE. In C1 the EM is able to provide torque, but in C2 the ωEM is greater than the top angular velocity at which the EM can provide torque, therefore, the ICE must generate all power required to fulfill the drive cycle demand.
Curves P1, Pmin and VE define area C3 and curves P1 and VE delimit area C4. In C3 and C4 the HEV operates in conventional mode, but the ICE does not work on its BEOL. In these zones the CVT does not have enough overdrive and the ICE must deliver less torque than the torque marked by the BEOL, therefore fuel consumption increases per work done. The difference between C3 and C4 is marked by the capacity of the EM to provide torque.
Curves P2 , P3 , Vmin and Pmax are the limits of area HP. In HP the HEV operates in hybrid parallel mode. In this mode, the Control Map lets us know the top power that the ICE can deliver and the power the EM must generate to accomplish the drive cycle. For example, using Point I in Figure 3, if the vehicle speed is 60 km/hr and the drive cycle requires 80 kW the map shows that the ICE can deliver 60 kW and the EM must generate 20 kWmore to accomplish the 80 kW demanded.
Control Map modification
When RST is increased P1 and P2 slopes decreases in the Control Map and the intersection between P2 and Pmin move to a higher V, therefore Vmin is moved to the right, increasing HS area.
From Equation 5 and Equation 6 the next equation is obtained:
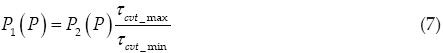
Equation 7 demonstrates that with a larger CVT range, the difference between the slopes of curves P1 and P2 increases, therefore areas C1 and C2 would be larger. Under this condition the ICE would be able to operate on its BEOL over a wider range of speed and power.
Curve VE establishes the limits at which the EM can deliver torque. This situation is explained in Equation 4 by multiplying the wheel radius and solving for ωEM. When TCEM is changed, the curve VE moves horizontally and modifies PEM curve and the EM efficiency as a function of V.
The Control Map and fuel economy
Each operating mode has advantages and disadvantages. The conventional modes in areas C1 and C2 of the Control Map are the best, but as seen before, the CVT belt's strength constrains them. On the other hand, the EM allows for a reduction in the size of the ICE which shuts it down under non-efficient conditions. Unfortunately, the EM usage has a high cost on efficiency, due to several energy transformations required to convert the fuel's chemical energy into mechanical energy by the EM (Freyermuth et al, 2008; Salmasi, 2007). The Pmin value can be modified by the control strategy. This action considerably changes the area of HS. This parameter can be used to set the preference to either use the EM or the ICE under low speed and low power demand situations (Morteza et al., 2006) or when the HEV operates on C3 zone. For these reasons Pmin is a decision variable of the optimization.
The transmission design must find a balance between the areas HP and C3, because, while the HEV works within HP the EM must be used (with a consequent lower efficiency), but if the RST value is modified to cover those operating points within Q, then C3's area must increase and the ICE will work mostly under conditions out of its BEOL increasing fuel consumption. This situation must be balanced to find the best RST value. For this reason RST is another decision variable of the optimization.
Another transmission parameter that must be defined and optimized on the design stage is the VE value. If VE is low the EM may stop working before achieving the speed required by the ICE to deliver its full power, leaving the HEV with less power available on a range of V. The inverse situation would happen if the VE value is too high. About this, it should be noted that change in the value of VE modifies the operative points of the EM, which changes the eiciency of the EM. This contributes to change the fuel economy. For this reason VE is a decision variable used for the optimization.
Control Map and electric energy flow
Points I, II and III shown in Figure 3 represent situations where the vehicle can use or store electric energy. On point I the vehicle must use electric energy. On Points II and III the ICE can produce additional energy to charge the batteries (Morteza et al., 2006). In these situations the Control Map provides the information required to calculate how much energy can be used or sent to the batteries.
Point I is in HP, therefore the EM must assist the ICE. The power required from the EM can be calculated by:

Point II could be either in Q1 or C2. In these areas, the maximum energy the ICE can provide to charge the batteries is given by the equation:

For Point III, the excess energy the ICE needs to generate and still work on its BEOL is given by the equation:
Where P(t) is the power required by the cycle at time (t), P1(t) and P2(t) are the power values in which curves P1 and P2 of the Control Map are intersected by a vertical line projected from the instantaneous velocity of the vehicle V(t). P1(t) and P2(t) represent the minimum and maximum power the ICE can deliver at any given speed on time (t), while working on its BEOL.
It has been proved that the Control Map provides information required to know the ICE's limits to charge the batteries, which is information that needs to be considered but that does not provide the optimum values. For this reason the charge strategy, with its decision variables to be optimized, is presented in the next section.
Electric system
The HEV must have an electric system that feeds the EM. The main elements of this system are: the EM which can work as generator, one alternator, a Power Electronics Control Unit (PECU) and a battery pack. The battery pack selected is Ni-Mh because of its successful use in commercial HEVs (Mihalic et al., 2002). The battery pack and the alternator must be able to feed the top EM demand of electricity.
Table 3 shows the charge strategy for each area of the Control Map created by the conditions required to charge the batteries, the amount of power used for this purpose, the constraints that need to be considered and the device to be used. The goals of the charge strategy proposed are: to keep the SOC between the limits desired, to not exceed the peak battery charge power, to increase the useful battery life, to operate the ICE close to its BEOL when charging batteries and to avoid starting the ICE only to charge batteries. With regenerative breaking it is expected to recover as much energy as possible without overcharging the battery pack.
The charge strategy uses three SOC values to decide when to charge the battery. These SOC values are:
LIB1: This value is set to 55% of SOC, if this value is reached the control system increases SOC to LIB2.
LIB2: This value is between 56% and 80% of SOC. This limit is used when operating in Q1, C2 or HS.
LIB3: This value is between LIB2 and 80% SOC. This limit is used when operating in C3, C4 or when operating in regenerative breaking.
Variable PAlt defines how much power the ICE must generate with the purpose to charge the battery when the operation is in any Cx area of the Control Map. A constraint of the charge strategy is that the electric power used to charge the batteries should never exceed 4 times the nominal battery power (4C). The value 4C seeks to avoid damage and is obtained from the average of two commercial HEV charge power related to their nominal battery power (Kelly et al., 2002). A second constraint is given by Equation 9; LIB2, LIB3 and PAlt are decision variables of the optimization.
Optimization
In this study, the optimization algorithm considered is based on genetic algorithms, which are inspired in the theory of Darwin, survival of the fittest. Due to the nature of the multi-objective problem, the multi-objective genetic algorithm (MOGA), proposed in Fonseca and Fleming, 1995, is employed. The MOGA explores the relevant trade-offs between multiple objectives. This formulation maintains the genuine multi-objective nature of the problem, in which no single solution exists. Instead there is a set of equally valid solutions, known as Pareto front solutions or non-dominated solutions. MOGA use standard genetic algorithm operators (selection, crossover and mutation) and other operators to manage the Pareto front, the ones incorporated in this algorithm uses: Pareto ranking, fitness sharing and mating restriction. The design philosophy of MOGA is to develop a population (potential solutions) of Pareto front or near Pareto-optimal solutions whilst maintaining the independence of the objectives throughout the optimization process. It is free-derivative and the model used to evaluate fitness of the individuals is treated as a black-box.
This section discusses the relevant findings derived from the MOGA. All simulations done are under qua-sistatic conditions; the efficiencies of the ICE and EM are considered from its efficiency charts; the efficiencies of the PECU and the alternator are fixed to be 90 and 85 percent respectively; the battery pack efficiency is set to 64% (Panasonic, 2008) efficiencies of all other elements are not considered. The driving cycle is constructed adding 5 consecutive UDDS cycles with 3 consecutive HWFET cycles (Sovran et al., 2006), see Appendix 2. All efficiency charts and drive cycles were obtained from the Advisor® database. The vehicle chosen was a Dodge Ram Pick-up truck with 2800 kg of net mass and a battery pack of 3 kW-hr of storage capacity. The ICE selected is a Mercedes 1.7L Diesel and the EM is a Unique Mobility 32-kW continuous, 53-kW intermittent permanent magnet motor. The sizes of the EM and ICE are close to the best selection for the type of vehicle chosen (Cook et al., 2007). All simulations are done with Matlab® based software developed by the authors. The optimization of the two objective functions with their decision variables are shown in Table 5. The optimization parameters are conformed of 100 generations with 100 individuals each.
The multi-objective optimization problem is simultaneously
Minimize Function 1: Petrol [g] = F [VE, RST, Pmin1, Pmin2, LIB2(SOC)LIB3(SOC), PAlt]and
Maximize Function 2: Bat [W-hr] = F [VE, RST, Pmin1, Pmin2, LIB2(SOC) LIB3 (SOC), PAlt].
Petrol [g] is total fuel consumption at the end of the drive cycle and Bat [W-hr] represents the final SOC at the end of the drive cycle.
The decision variables of the optimization with their boundaries are shown in Table 4. A run of 100 generations, with a population of 100 individuals each, was carried out as outlined. The number of generation was decided based on observation that no improvement was achieved after 100 of them. The optimal Pareto front set found is plotted in Figure 4. There, each individual with final SOC below the initial SOC (1600 W-hr) is charge decreasing, any above is charge increasing and charge sustainable is when the final SOC equals the initial one.
The objective to analyze the information derived from the non-dominated solutions is to evaluate the capacity of the control strategy to change the operation of the vehicle from charge depleting to charge increasing, while its efficiency is kept as close as possible to the Pare-to curve (Fang et al., 2011). First of all, some of the Pareto individuals are characterized, then the relative efficiency of working at different points of the Pareto front set is evaluated, later the influence of the decision variables that cannot be changed once the transmission is build, and lastly, the influence of the variables that the control system is able to change (Xiaoling et al., 2004).
Values for some individuals of the Pareto front set
Table 5 shows the objective functions and decision variable values for individuals of the Pareto front set marked with numbers on Figure 4. Curve Pmin of the Control Map is represented by two values that cover different ranges of speed, Pmin1 from 0 to 36 km/hr and Pmin2 above 36 km/hr. This is done to create more flexibility to the optimization algorithm.
Relative efficiency analysis
Since the energy requirement to fulfill the drive cycle is the same for each simulation and each individual in Table 5 with final fuel consumption and a unique final SOC, it is possible to create Table 6. The second and third columns of Table 6 show the difference in fuel consumption and the battery charge between successive individuals in Table 5. The fourth column is the ratio between column 2 and column 3. It can be observed that the ratio ranges from 226.4 g/kW-hr to 555.4 g/kW-hr. From the efficiency chart of the ICE, it is known that at least 220g of fuel are required to generate 1 kW-hr of work. This value is used to calculate the efficiency of the transformation of that mechanical energy to energy stored in the battery pack at the end of the simulation (shown in column 5). Table 6 shows that as more charge increasing the vehicle works, the fuel cost of the final energy stored in the battery pack increases. As a result, the control system should try to avoid keeping the vehicle working over a charge increasing condition. Another aspect to consider is that a charge decreasing strategy is more fuel efficient, but requires additional hardware to convert the HEVs into a Plug-in HEV (Xianjing et al., 2010).
Analysis of physically constrained variables
Even though the Pareto front set shows optimal solutions for the vehicle operation (ranging from charge depleting to charge increasing), in reality it is not possible for the PT to operate along it. The reason is that RST and VE will be fixed once the transmission is build and as seen in Table 5 these variables values change. It is possible to modify the PT design to let these parameters change with 2 more CVTs. Unfortunately this would increase the complexity of the control system, manufacturing cost and maintenance, therefore this option is discarded in this paper. Instead of trying to develop a more complex PT, an intensive search among all individuals of the genetic optimization was done to find a pair of values for RST and VE that produce a curve close to the Pareto front set. The search allowed for variations of ±0.01 for RST and of ±1 m/s for VE. The best pair of values found was: RST = 0.64 ± 0.01 and VE =38.5 ± 1m/s. A comparison between the Pareto front set and the best sub-set with RST and VE fixed is shown in Figure 4.
Analysis of physically unconstrained variables
Once the values of RST and VE are fixed, the values of the other variables can be modified by the control system. Table 7 shows the values of the objective functions and decision variables of the individuals marked by dashed lines on Figure 4.
From Table 7 we can appreciate that decision variables which modify the areas of the Control Map do not change significantly (VE, RST, Pmin1); instead, the conditions for charging the battery pack (PAlt, LIB2 and LIB3) and Pmin2 are modified. Figure 5 shows the normalized behavior of the variables of those individuals in Table 7 that changes more than 5 percent.
Figure 5 shows that for charge decreasing (individual 1), the values for PAlt, LIB2 and LIB3 are the lowest and Pmin2 is the highest.
As the operation of the vehicle moves from charge decreasing to charge increasing, the parameter PAlt increases gradually and the conditions for charging the battery pack become less restrictive. First of all, the value of LIB3 increases which means that more charge can be accepted on C3 and C4, but still at a low rate. Second, LIB2 increases resulting in more energy accepted in C1 and C2 by the battery.
One relevant observation is that the use of the EM does not have significant changes (Pmin1 and Pmin2). This means that to increase energy in the battery pack the right strategy is to increase the electric energy generated by the ICE (PAlt), instead of restricting the use of the EM. On the other hand, if more "free" electrical energy is available (down hills, charge decreasing strategy as with a Plug-in HEV) the first strategy would be to reduce the generation of electrical energy with the ICE to charge the batteries (Xianjing et al., 2010). But, if the SOC gets close to LIB3, then the EM needs to be used more frequently under conditions of increase the Pmin value (HS area increases).
It is clear that PAlt has a strong impact in moving from charge depleting to charge sustainable and that the restrictions to send energy to the battery become gradually less restrictive to move from charge depleting to charge increasing.
Simulation results
In this section the results of one simulation done with the values of individual "A" of Table 7 are presented. This individual was selected because the values for RST and VE are in the optimal range and the final SOC is close to charge sustainable. Figure 6 is the real Control Map used and populated by the individual simulated, each point represent one state of the simulation.
From first heuristic optimization (Salmasi, 2007), considering only the Control Map and the SOC, the C3 area is more populated than the HP area. The slope of P2 increased enough to let C1cover almost all points of high power demand at low speeds. This information states that it is better to use the ICE outside its BEOL at high speeds than use the energy from the battery pack at low speeds with high power demand. The optimization demonstrates that it is more efficient to let the Pmin curve of the control map to have a slight negative slope. This might be explained by the fact that we are optimizing distance/fuel consumption and, despite that in C3 the ICE do not work on its BEOL, the ratio decrease in efficiency of the ICE might be overcompensated by the increase of speed. This means the faster the vehicle goes, the further from the BEOL the ICE can operate whilst still being more fuel efficient than using the EM.
In Figure 6 it can be observed that up to 15 kilowatts are used by the regenerative breaking, which is more than 4C (in this case 4C = 12 kW). This is due to the fact the EM absorbs 15 kW of mechanical energy in its shaft.
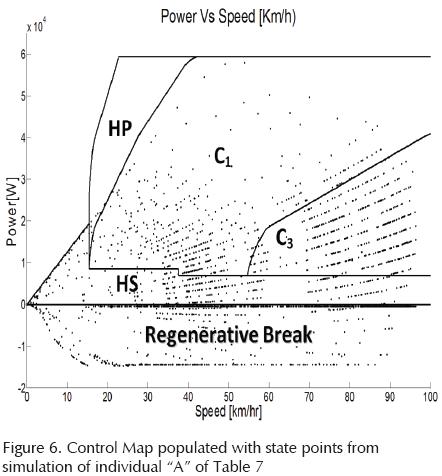
However, considering its efficiency as a generator and the efficiency of the PECU, the amount of electrical power that actually charges the batteries is below 4C.
Conclusions
The implementation of the genetic algorithm is described for the optimization of the control strategy and the transmission in HEV. The optimization problem was formulated for a multi-objective environment in order to minimize fuel consumption, maximize batteries state of charge and maintain the vehicle performance in the drive cycle used.
In this paper a transmission is proposed that allows different operating modes of the vehicle. To understand the energy flow a new approach is employed: The Control Map. This is a novel heuristic tool that organizes information about prime movers and the transmission. It is a powerful aid to understand the capacity and limitations of the mechanical and electrical energy flow on HEVs, according to the driver's demand and the powertrain configuration. When properly tuned, it can be used as a database by the control system of HEVs. Finally, the optimization is performed in a compound city-highway driving cycle and the effect of the control map in the optimization is analyzed.
The MOGA optimization provides information required to understand the better strategy to use prime movers and the battery pack. Despite the Pareto Front Set found by MOGA required the modification of physical parameters of the transmission, it was possible to find a subset of solutions with no physical changes that let the control strategy operate close to the Pareto Front Set. Moreover, the simulations results reveal that under these conditions, the SOC's strategy increases the power to charge the batteries gradually and sequentially increases the upper limits of the SOC to move from charge depleting to charge increasing. It was proved that fuel cost per unit of energy stored in the batteries at the end of the cycle increases as more energy is stored.
From the characteristics of the Control Map obtained after the MOGA optimization (Figure 6) it is concluded that the gear ratios of the transmission should benefit the use of the ICE outside its BEOL at high speeds and low power demand, because it is more fuel efficient than using the EM. When the operation is at low speeds with high power demand the gear ratios should let the ICE provide all the power required to propel the vehicle, reducing as much as possible the use of the EM once the ICE is started (C3 and C4 should overcome HP). It was found that as faster the vehicle moves, the minimum power to start the ICE decreases and the use of the EM should be restricted to propel the vehicle.
Future work will focus on the construction of a prototype to test the validity of the conclusions presented. It will also focus on the reduction of C3, C4 and HP areas of the Control Map, improve the computational model from quasistatic to a dynamic approach and to create a dynamic control strategy with the heuristic based on the Control Map.
Acknowledgments
Authors are grateful for financial support from Researching Direction and Engineering Department of Universidad Iberoamericana. The authors would also like to mention Dr. Frederick Golden's valuable support. His advice and guidance, which he provided in life, encouraged us to strive for new goals and accomplishments in the benefit of humankind. This article is largely thanks to his input.
References
ADVISOR (ADvanced Vehicle SimulatOR). US, Department of Energy's National Renewable Energy Laboratory's (NREL), Center for Transportation Technologies and Systems, Version 2002. [ Links ]
Anderson J.A. Designing and Modeling a Torque and Speed Control Transmission, (Thesis of Master of Science in Mechanical Engineering), USA, West Virginia University, Morgantown, West Virginia, 1999, 77p. [ Links ]
Amr A. A., Ahmed F.Z., Greg J.N. Trends, Features and Recent Research Efforts in the Field of Hybrid Electric Vehicles. Int. J. Alternative Propulsion, volume 1 (issue 1), 2006. [ Links ]
Cook R., Molina-Cristobal A., Parkas G., Osornio C., Clarkson J. Multi-Objective Optimisation of a Hybrid Electric Vehicle: Drive Train and Driving Strategy, on: Proceedings of the 4th International Conference on Evolutionary Multi-Criterion Optimization, Matsushima, Japon, SECTION: Applications, pp. 330-345, 2007. [ Links ]
Fang L.C., Xu G., Li T.L., Zhu K.M. Concurrent Optimization for Parameters of Hybrid Electric Vehicle Based on Non-Dominated Sorting Genetic Algorithms, on: Advanced Control of Industrial Processes (ADCONIP) International Symposium, pp. 472-476, 23-26, May 2011. [ Links ]
Fonseca and Fleming. Multiobjective Genetic Algorithms Made Easy: Selection, Sharing and Mating Restriction, on: IEE/IEEE International Conference on Genetic Algorithms in Engineering Systems: Innovations and Applications (1st, 1995, Sheffield, UK), The Institution of Electrical Engineers, 1995, pp. 45-52. [ Links ]
Freyermuth V., Fallas E., Rousseau A. Comparison of Powertrain Configuration for Plug-in HEVs from a Fuel Economy Perspective, on: SAE World Congress, Session: Advance Hybrid Vehicle Powertrain, 2008, MI, USA, SAE International, April 2008, pp. 165-171. [ Links ]
Gómez M., Mucino V., Clark N., Smith J. A Configuration for a Continuously Variable Power-Split Transmission in Hybrid-Electric Vehicle Application, on: SAE World Congress (2004, Detroit, MI, USA) Advanced Hybrid Vehicle Powertrains, Warrendale, PA, USA, SAE, 2004, pp.137-144. [ Links ]
Mihalic-Zolot K. Battery Usage and Thermal Performance of the Toyota Prius and Honda Insight for Various Chassis Dynamometer Test Procedures, on: Annual Battery Conference on Applications and Advances (17th, 2002, Long Beach, California, USA). [ Links ]
Koichiro M., Makoto Y., Junji T. Development of New-Generation Hybrid System THS II -Drastic Improvement of Power Perfomance, on: SAE World Congress & Exhibition Session: Advanced Hybrid Vehicle Powertrains, (March 2004, MI, USA). Hybrid Gasoline-Electric Vehicle Development, 2005, SAE International. [ Links ]
Kyoungcheol O., Junhong M., Donghoon C., Hyungsoo K. Optimization of Control Strategy for a Single-Shaft Parallel Hybrid Electric Vehicle. Proceedings of the Institution of Mechanical Engineers, Part D, on: Journal of Automobile Engineering [Print], volume 221 (issue 5), 2007: 554-565 [on line]. Abailable on: http://journals.pepublishing.com/content/b35v3w8808576564/ [ Links ]
Liang C. Youde L., Qingnian W. Study on the Parametric Optimization for a Parallel Hybrid Electric Vehicle Power Train, on: Future Transportation Technology Conference & Exposition Session: Hybrid Electric Vehicles (2000, Costa Mesa, CA, USA), PA, USA, SAE International, Agost 2000. [ Links ]
Morteza-Montazeri G., Poursamad A., Barbak G. Application of Genetic Algorithm for Optimization of Control Strategy in Parallel Hybrid Electric Vehicles. ELSEVIER, Journal of Franklin Institute, 2006. [ Links ]
Panasonic, Nickel Metal Hydride Batteries, Technical Handbook, 2008. [ Links ]
Pezzini A., Bezaire B., Cooley R., Tulpule P., Rizzoni G., Guezennec Y., Midllam-Mohler S. Application of Model-Based Design Techniques for the Control development and Optimization of a Hybrid-Electric Vehicle, on: SAE World Congress & Exhibition, Session: Control and Optimization in Hybrid Powertrains Part 1 (2009, MI, USA). Control and Optimization in Hybrid Powertrains, 2009. MI, USA. SAE International, April 2009, pp. 1-10. [ Links ]
Salmasi-Farzad R. Control Strategies for Hybrid Electric Vehicles: Evolution, Classification, Comparation and Future Trens. IEEE Transaction on Vehicular Technology, volume 56 (issue5), September 2007. [ Links ]
Santoro M. A Hybrid-Propulsion Powertrain with Planetary gear Train Set for a 4WDVehicle: Analysis of Power Flows and Energy Efficiency, Dresden University of Technology, Germany, 2000. [ Links ]
Sovran G. y Dwight B. Quantifying The Potential Impacts Of Regenerative Braking on a Vehicle's Tractive-Fuel Consumption for the US, European and Japanese Driving Schedules, on: The SAE World Congress (2006, Detroit, Michigan, USA), Advanced Hybrid Vehicles, Warrendale, PA, USA, pp. 75-92. [ Links ]
Xianjing L., Liguang L., Yongzheng S., Zongjie H., Jun D. Optimization of Control Strategy for Engine Start-Stop in a Plug-in Series Hybrid Electric Vehicle, SAE 2010-01-2214, October 2010. [ Links ]
Xiaolin H., Zhongfan W., Lianying L. Multi-Objective Optimization of HEV Fuel Economy and Emissions Using Evolutionary Computation, SAE 2004-01-1153, March 2004. [ Links ]
About the authors
Cuitlahuac Osornio-Correa. He received his BSc degree from The National Autonomous University of Mexico (UNAM), Mexico, in 1976; the MSc degree from Engineering Faculty-UNAM, Mexico in 1994; and his PhD degree in 2006 from the Engineering Faculty-UNAM, Mexico, all in Mechanical Engineering. Currently, he is a professor and researcher at the Universidad Iberoamericana. His main research interest includes Hybrid Electric Vehicles powertrain and Electric Vehicles.
Ricardo Carlos Villarreal-Calva. Graduated with a BSc in Mechanical and Electrical Engineering with a major in Mechatronics from Universidad Iberoamericana, Mexico in 2006. As a student, he was responsible of the engineering design of a Formula SAE race car which represented Universidad Iberoamericana in the Formula SAE 2006 Westcompetition. He was the Captain of the UIA 2006 PACE team that developed the CAD&CAE of an Internal Combustion Engine aimed to contribute with the CAD&CAE of a full vehicle through collaborative engineering between worldwide Universities. In 2009, he joined to a research with the objective to increase fuel economy in Hybrid Electric Vehicles.
Arturo Molina-Cristobal. Graduated with a BSc in Mechanical Engineering with a major in Mechantronics from Universidad Iberoamericana, Mexico in 1996. From 2001 to 2005 he completed his PhD degree from the Department of Automatic Control & Systems Engineering in collaboration with the Rolls-Royce University Technology Centre (UTC)at the University of Sheffield. His PhD research was aimed at comparing LMI techniques and genetic algorithms in Multiobjective Control with application to gas turbine engines. From 2005 to 2006 he joined the EDC to work in Robust Multiobjective Optimisation with application to real-world engineering problems. From 2006 to 2009 he joined the Electrical Machines and Drives Group, at the University of Sheffield to work in the More Open Electrical Technologies (MOET) for Aircraft Power Systems project. He returned to the EDC in July 2009 to work in the Robust Multiobjective Optimisation of Submarine Propulsion Systems.
Joshua Estavillo-Galsworthy. graduated with a BSc in Mechanical and Electrical Engineering from the Universidad Iberoamericana, Mexico 2011. In his early student years, he designed a hybrid engine using a two-stroke diesel and a Sterling engine to increase fuel efficiency. In 2007 he joined a research team focused on improving Hybrid Electric Vehicles, specifically regarding transmission, performance, and fuel economy. In 2010, became the teacher's assistant of an online, Multilanguage, international CAD&CAE course, centered on optimizing design. Over the past few years, he has worked in diverse environmental fields, including waste management, energy management and transportation, and recycling, including creating self-sustaining environmentally sound projects for different industries.
Saúl Daniel Santillán-Gutiérrez. BSc, MSc UNAM (National Autonomous University of Mexico), PhD Loughborough University. Research lines, product design, artificial intelligence and design methods, professor at Faculty of Engineering UNAM, Project leader for several industrial research projects, responsible for the postgraduate program of Automotive Engineering (to start at the UNAM soon), member of the Academy of Engineering (currently Head of Centro de Alta Tecnología, based on campus Juriquilla in Querétaro).

