


Services on Demand
Journal
Article
 English (pdf)
 Article in xml format
 Article references
 Send this article by e-mail
Indicators
-
 Cited by SciELO
 -
 Access statistics
Related links
-
 Similars in
SciELO
Similars in
SciELO
Share

 Permalink
Ingeniería, investigación y tecnología
On-line version ISSN 2594-0732Print version ISSN 1405-7743
Ing. invest. y tecnol. vol.13 n.4 Ciudad de México Oct./Dec. 2012
The Decrease of the Strength of Unsaturated Silty Sand
Disminución de la resistencia de una arena limosa no saturada
Leal-Vaca J.C. 1, Gallegos-Fonseca G. 2, Rojas-González E. 3
1 Facultad de Ingeniería, Universidad Autónoma de Querétaro, México, E-mail: jcesarlealv@hotmail.com
2 Facultad de Ingeniería, Universidad Autónoma de Querétaro, México, E-mail: gfonseca@uaslp.mx,
3 Facultad de Ingeniería, Universidad Autónoma de Querétaro, México, E. mail: erg@uaq.mx
Information on the article: received: January 2009,
Reevaluated: September 2009,
Accepted: March 2012
Abstract
It is generally considered that the shear strength of fine soils continuously increases with suction; however, this is not the case for all types of soils. There are some soils whose strength reaches a maximum at certain suction and then reduces with further of suction. Nevertheless, such cases have not been completely documented and analyzed. This paper presents the results of a series of suction controlled triaxial tests made on silty sand. The tests were made for both the wetting and the drying path. Suction was controlled by circulating air at a constant relative humidity. The retention curve was also obtained for the wetting and the drying path. The variation of cohesive stress was determined using some of the existing equations and the solid-porous model proposed by Rojas (2008a y 2008b). These equations include Bishop's χ parameter, evaluated theoretically and experimentally. The triaxial tests results show that the strength of the soil increases to a maximum at certain suction and then decreases when suction is further increased.
Keywords: unsaturated soils, silty sand, effective stress, strength, triaxial test, retention curve.
Resumen
Generalmente se considera que la resistencia cortante de los suelos finos se incrementa con la succión; sin embargo, esto no ocurre para todos los tipos de suelos. Existen algunos suelos cuya resistencia alcanza un máximo para cierta succión y luego se reduce para valores mayores de succión. No obstante, tales casos aún no se han documentado y analizado completamente. Este artículo presenta una serie de pruebas triaxiales con succión controlada realizadas en una arena limosa. La succión se controló mediante circulación de aire con humedad relativa constante. Las pruebas triaxiales se hicieron en trayectorias de humedecimiento y secado. La curva de retención también se obtuvo para ambas trayectorias. Se determinó la variación del esfuerzo cohesivo utilizando algunas de las ecuaciones existentes y el modelo sólido-poroso propuesto por Rojas (2008a y 2008b). Estas ecuaciones incluyen al parámetro χ de Bishop, evaluado teórica y experimentalmente. Los resultados de las pruebas triaxiales muestran que la resistencia del suelo crece a un máximo para cierta succión y luego decrece para valores mayores.
Descriptores: suelos no saturados, arena limosa, esfuerzo efectivo, resistencia, prueba triaxial, curva de retención.
Introduction
The interest on the mechanics of unsaturated soils has recently increased because many engineering projects deal with these types of soils. It is known that the volumetric and strength behavior of saturated soils is controlled by the effective stresses (σ '). However, in the case of unsaturated soils, there is still controversy regarding the existence of an effective stress equation that may explain the volumetric and strength behavior of these materials.
Bishop (1959) proposed an effective stress equation for unsaturated soils which generated a lengthy controversy which to this day is still ongoing. This equation follows

where σ ' is the effective stress, is the net stress, (σ '- υα) is the suction and X is Bishop's parameter. The product (υα - υω) represents the cohesive stress. One drawback of Bishop's equation is that a method or equation for the precise determination of the value of parameter χ has not been established. Bishop's equation was questioned because it could no predict the phenomenon of collapse upon wetting once the soil was dried and loaded above the preconsolidation pressure (Jennings and Burland, 1962). Many other equations have been proposed (Garven and Vanapilli, 2006). Some of these equations are as follows: the two first equations were proposed by Vanapalli et al. (1996), the third equation was proposed by Oberg and Sallfours (1995), and the fourth equation belongs to Khalili and Khabbaz (1998).

where Sω is the degree of saturation; S is the residual degree of saturation; (υα - υω)b is the air entry value; and k is a fitting parameter that varies with the plasticity index (Vanapalli et al., 2000). However none of them is adequate for all types of soil and for all range of suction.
The shear strength is dependent of the effective stress, and one of the most well known equations to determine the shear strength was proposed by Fredlund et al. (1978), who believes that the cohesion varies with the suction along the constant inclination angle φb. This equation is written as

where τ ff is the shear strength; c' is the effective cohesion; (σ '- υα) is the net normal stress state on the failure plane at failure; φ' is the angle of internal friction associated with the net normal stress state variable, (σ '- υα)f;(υα - υω)f is the matric suction on the failure plane at failure; and φb is the angle indicating the rate of increase in shear strength relative to the matric suction, (υα - υω)f.
Murray (2002) presented an equation of state for unsaturated soils. He developed an analysis considering the enthalpy within a soil system under equilibrium conditions. His equation is the following:

where
q is the deviator stress,
s is the suction,
p'c is the average volumetric coupling stress,
Mt is the total stress ratio, and
Λ is the intercept on the p/s axis at p'c /s=1.
However, the above equation is indeterminate when the soil is completely saturated, with s=0.
The investigations of the unsaturated soil strength are few; there are some low suctions from 0 to 50 kPa (Kumara and Uchimura, 2006). The results indicate these investigations as in the saturated soils where the angle φ ' remains constant.
Experimental results seem to indicate that the strength of some soils reaches a maximum and then decreases with further increases in suction. These early results have been reported only for specimens previously saturated, and increasing the suction by draining, without considering the differences between drying and wetting paths (Pereira et al., 2006). However, these results do not show a clear tendency and raise some other questions, for example, does the cohesive stress reduces to zero for a completely dry soil, and the maximum strength can be observed only at drying, or does it also appear at wetting. In the case of clays with large specific surface, the physico-chemical forces and the adsorbed water play an important role in the soils behavior. For these types of soils the strength reduction at high suctions has not been experimentally observed (Rojas, 2006). In that sense, it is necessary to carry out more experimental work on this issue in order to better understand the behavior of unsaturated soils and finally to improve the expressions related to the strength of these materials for all the range of suctions.
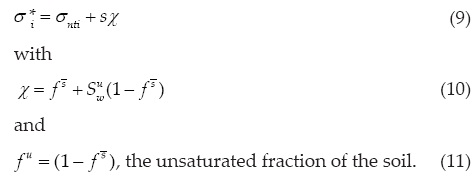
Rojas (2008a) developed a solid-porous model based on the analysis of stress on the skeleton of an unsaturated soil showing a bimodal structure, and proposed that Bishop's equation can be written as

where
 represents the equivalent stress in the direction i and is related to the stress that supports the phase solid of soil in that direction,
σnti represents the net stress in the direction i,
s is the suction,
 represents the saturated fraction of the soil,
 is the degree of saturation of the unsaturated fraction.
Equation (7) can be rewritten as
Rojas's model answers some of the above questions, which is the reason to use it for theoretical analysis of shear strength behavior in terms of cohesive stress. Soils with bimodal structure means that its distribution of pores has two different types of elements: the macropores, which are very large pores and the sites which include the mesopores and micropores. The model is built in a regular network where the nodes represent the pores and their connections represent the bonds. The model is based on realistic assumptions that allow simulating the soil-water retention curve (SWRC) in wetting and drying. This model is capable of describing the distribution of the water inside the pores of a soil, and hence, it can be used to obtain the parameters and that cannot be determined in the laboratory (Rojas, 2008b).
It is necessary to have an experimental base to develop a model capable of describing the behavior of soils comprising the whole range of suctions. Developing a model only for low suctions would be incomplete for understanding their total behavior from the theoretical point of view.
The objective of this paper is to experimentally observe and measure the decrease of strength on unsaturated silty sand and do a comparison of the strength with some existing equations. For this purpose series of triaxial tests using controlled suction were performed on samples of silty sand.
Materials and methods
The soil used for the experimental program came from Valle de Santiago, Mexico. This soil was classified as silty sand. The grain-size distribution curve for the soil is shown in Figure 1, and its index properties are summarized in Table 1. It is noteworthy that this soil does not show any clay content.


The soil was initially dried at room temperature (20°C +/- 1°C) and all particles larger than 2 mm (sieve No. 10) were removed. The remaining soil was divided in two equal parts. One half was washed using a No. 200 sieve; then both, the washed half and the unwashed half were mixed together again. Enough water was added to obtain 19.53% moisture content. The mixture was used to make soil specimens by static compaction. All specimens were fabricated in five layers. The soil for each layer was weighed (0.70 N) and placed in a cylindrical mould. Then the layer was statically compacted at a maximum stress of 3140 KPa. With these samples an experimental program was utilized to define the retention curve of wetting and drying paths, as well as the strength of the soil at different suctions following both the wetting and drying path. In order to determine the retention curves, the following procedure was applied: two sets of compacted specimens of silty sand were prepared; all samples in the first set were dried at different water contents so as to obtain the drying path. For the wetting path, all the samples of the second set were completely dried in an oven and then they were re-hydrated at different water contents by spraying varying amounts of water on them. The amount of water was controlled by using a scale. All these specimens were placed in hermetic containers and their suction was measured with the filter paper method in controlled temperature ambient (20°C + 1°C) according to the test method D 5298-9403 of the American Society for Testing and Materials (Annual book of ASTM STANDARDS, 2004). The filter paper used in these tests was the Schleicher and Schuell No. 589. This paper was previously calibrated also according to the same standardized ASTM procedure. The results of the calibration procedure are shown in Figure 2, and include a correlation equation.

Other soil specimens were tested in a suction controlled triaxial apparatus to examine the effects of the drying and wetting on the strength of the material.
Testing procedure
All triaxial tests were performed on samples showing the following characteristics: 50 mm in diameter and 100 mm in height, a dry density of 14.89 KN/m3 and a gravimetric water content of 19.53%. Specimens used for the wetting and drying path were prepared in the same way as those used for the retention curves. During the tests, suction was kept constant by circulating an atmosphere of a saline solution of NaCl placed in a container outside the triaxial cell. The circulation of the air was maintained by using a peristaltic pump specifically designed for fluid transfer.
The pumping rate was fixed at 15 rpm, corresponding to a flow rate of 8.81 ml/min through a polyvinyl chloride pipe with an internal diameter 3.16 mm. The pump circulated the relative humidity of the container from the bottom to the top of the specimen throughout the shearing process. Figure 3 shows a schematic view of the triaxial apparatus with the suction system.

Results and discussion
Shear behavior
The results of the triaxial tests done at a confining stresses of 150 KPa are presented in Figure 4. This figure shows the deviator stress at failure versus the degree of saturation. The arrows in Figure 4 indicate the trajectories of the drying and wetting processes. It was observed that the strength of the material is less during wetting than during drying. In both curves the strength increases with suction up to a maximum and then decreases.
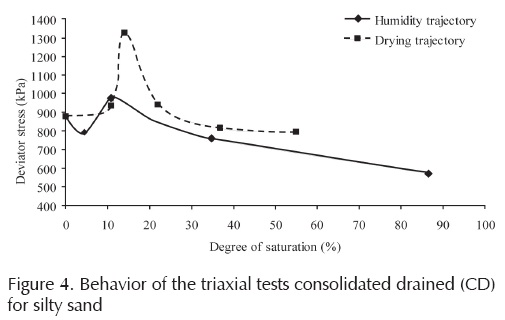
The figure shows the behavior of the resistance indicated for the deviator stress versus the degree of saturation. The arrows in the figure indicate the humidifying and drying process trajectories. Figure 5 shows the deviator stress as a function of the suction of the soil. Some values of suction were checked with the filter paper method. These graphs indicate that the deviator stress is greater during drying than wetting for suctions over 980 KPa. For suctions lower than 980 KPa this behavior is not maintained. Therefore, the way in which water distributes into the pores of the soil influences its strength.

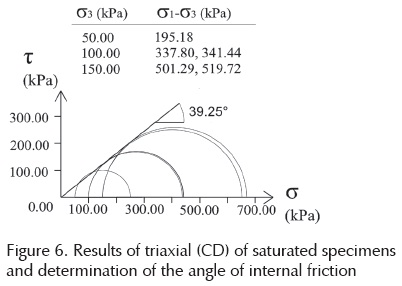
The figure shows the behavior of the resistance indicated for the deviator stress versus the suction. The arrows in the figure indicate the humidifying and drying process trajectories It was determined the angle of internal friction of soil in consolidated drained triaxial tests used for this purpose were saturated and five specimens were tested, the angle was 39.25 °, obtained graphically from the Mohr circles, shown in Figure 6. Figure 7 shows the results of those tests saturated triaxial through p'- q diagrams. In these diagrams p' is calculated with equation (12).


Considering the angle of internal friction and the results of the unsaturated specimens shown in Figure 5, was determined the variation of cohesion with suction. For this a tangent line was searched with inclination of 39.25° in the Mohr circle for each of the specimens tested, under confinement of 150 kPa, and was projected onto the plane τ - s, thus the ordinate in this plane represents cohesion. This is shown in Figure 8 for the trajectory of wetting and in Figure 9 for the trajectory drying. The variation of cohesion with respect to the suction is shown in Figure 10.


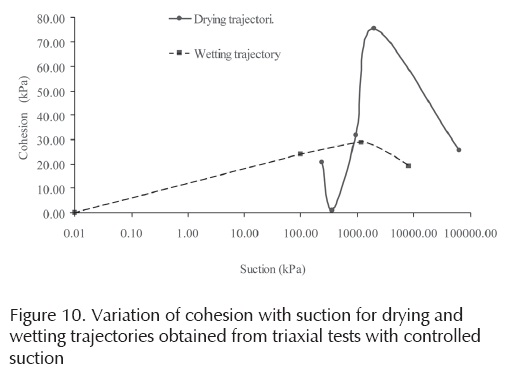
We can observe in Figure 10 that in the drying path, the cohesion has a maximum value greater that wetting path. In both trajectories it was obtained that cohesion was not changed by a constant angle with the variation of suction, and shows greater variation in the trajectory of drying. Wetting trajectory maintains a slope reaching its maximum cohesion of 28.84 kPa with 1169.87 kPa of suction, but then changes this trend for higher values of suction. These results of soil testing shows that equation (6), proposed by Fredlund et al. (1978), is not valid for this soil (SM) tested.
The variation of cohesion and deviator stress for the soil tested can be explained as follows:
a) the strength increases to a certain value when the soil is wetted due to the formation of meniscus that contribute to the shear strength, then this strength is lost because saturation increases and decreases the number of meniscus,
b) in the path of drying, the number of meniscus increases when the soil dries which contribute to the increase of strength to a maximum value, then this maximum value begins to decrease the number of meniscus which is reflected in the consequent loss of strength.
The way in which water is retained in the pores of a soil and with respect to the suction can be represented by the SWRC. Figure 11 shows the SWRC at wetting and drying. This curve shows the relationship between the water content and the matric suction of the soil. The SWRC shows different curvatures indicating that soil has a complex pore sizes distribution. Because the SWRC depends on the pore size distribution of the soil, it is sensitive to changes of confining stress. This effect could not be measured, because the triaxial cell was not equipped with suction measuring devices or miniprobes.
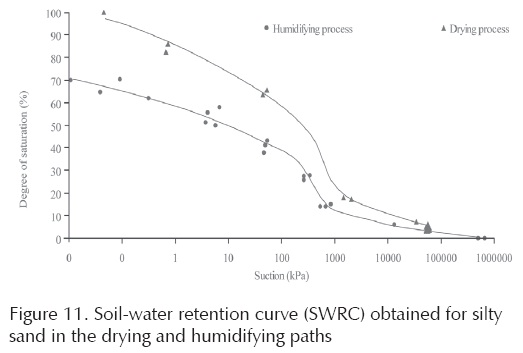
As shown in Figure 11 for any degree of saturation the curve of water retention in the drying process has higher values of suction wetting curve. In the drying curve, it can be observed that large water losses occur for smaller values at 2100 kPa suction coming to have a degree of saturation of approximately 17.5%. To drain the water after the suction value, greater amounts of energy are required to reach a saturation level close to zero, it takes about 1,000,000 kPa suction. In the curve of wetting the ground path were initially tested in a state of high suction, close to 670 000 kPa, and when it starts wetting the degree of saturation is increased slowly to values of suction on the order of 850 kPa for a degree of saturation of approximately 14.0%, for lower values of this suction the degree of saturation increases more rapidly.
Theoretical results
Trying to describe exactly a three-phase porous media is quite complicated, for this composition would require at least including a wide range of sizes of solids, millions of pores, their interaction with water, and the contacts between solid particles. Rojas's model is a computational tool that relates the three phases of soil and considers their behavior hydromechanical. This model is formed by four elements: sites or cavities, macropores, bonds and solids. The sites represent the pores of medium to small size. The macropores are the largest pores in the soil and differ from the sites in that the former shrink with increasing suction. The bonds are elements that link together two sites. The solid-porous model that simulates the processes of wetting and drying, is able to reproduce the hydraulic hysteresis oh the SWRC and shrinkage of the macropores. The network model can be elementarily represented in the Figure 12.

In the model, it is necessary to determine the number of nodes in the network, then the number of macropores, sites, bonds, and solids for each size. In this case porosimetry was proposed to reproduce the SWRC and the experimental particle size distribution. All nodes in the network are assigned to a pore size. In general the number of macropores is usually smaller than the number of sites. Nevertheless, volumes are similar. In the case of solids, the process is similar from granulometric analysis. Once the number of elements in each size has been defined, the sites and bonds are placed on the network at random. Later proceed to place the macropores and to place the solids so that in areas where there are small pores, they will be surrounded by small particles and vice versa. The pores filled with water and dried are governed by Laplace equation (13), which involves the surface tension of the contractile skin. (Ts).

where Rc, the critical radius of the meniscus of the contractile skin; corresponds to the maximum pore size that remains saturated for some suction (υα - υω), and α is the solid meniscus contact angle.
The drainage of pores will occur when the pore size is greater than Rc and one of its bonds that connect to it is drained or dry. The drying process is to consider the network completely saturated and the suction is zero. After suction is modified in a small increase and this leads drainage of macropore or sites located in the periphery of the network, and the process continues only when the tubules connectors to those pores are dry. This process yields the drying SWRC curve governed by the tubules connectors.
The saturation of pores will occur if the pore size is less than or equal to Rc and one of the connectors is saturated. During the process of wetting it is considered that initially the nodes or pores are dry and the suction is high, then the suction is reduced and smaller tubules at the periphery of the network are filled with water. Later, to continue the process for sites that are connected to those saturated tubules, they should be filled with water. This process yields the wetting SWRC curve that is controlled by the distribution of sites and macropores.
The distributions used for sites, macropores, and solid bonds are normal distributions. These distributions are defined by two parameters: arithmetic mean and standard deviation. This will require as input into the model the mean radius and standard deviation of sites, macropores, solid, and bonds.
Figure 13 shows the pore distribution (PSD) used; for its proposal, the experimental observations made by Simms and Yanful (2001) were considered. They observed that pore volume related to the pore size showed two peaks. According to the above, the two peaks or crests can be seen in Figure 13. The first of these crests, the one located at approximately 0.38 μm, corresponds to smaller pores. The other crest (located at approximately 950 μm) corresponds to the macropores. The solids distribution (SD) is shown in the same figure; it presents its crest at approximately 100 μm. The parameters used for their distributions were the following:


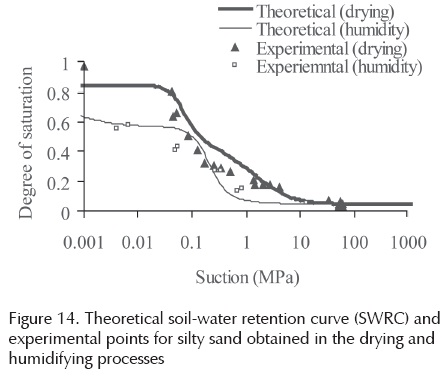
With the previous PSD model, the SWRC was determined. This curve is shown in Figure 14, the points are experimental measurements and the full line curves are fitted by the model. The size of solids experimental and theoretical distribution is shown in Figure 15. Slight differences can be observed between these two curves, especially for the larger sizes.

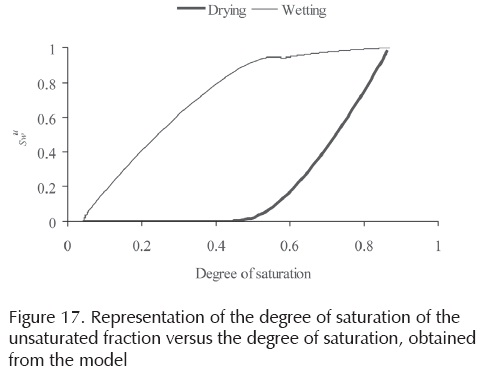
With the value of all parameters defined, it is possible to simulate a wetting and drying process and define the values of the parameters  and for different degrees of saturation. These parameters are shown in Figures 16 and 17. The volume of the saturated fraction ( 1 - is obtained by adding the volume of solids completely surrounded by water to the volume of voids surrounding these solids.

With the experimental information obtained concerning the shear strength and the porosimetry proposed, which reproduces the SWRC, it is possible to evaluate the Bishop's parameter χ using equation (10) proposed by Rojas (2008a). The theoretical and experimental results are shown in Figure 18.

The best results are presented in low degrees of saturation. This is because at low degrees of saturation volume changes are minor and the degree of saturation is influenced by changes in volume. Some differences in the final results of can be expected, and therefore also of the resistance since the processes of wetting and drying of the solid-porous model are developed by invasion. That is, to move water or gas continuity in the phases is required. This means that a site or a bond cannot be invaded if at least one adjacent element has not been invaded.
Finally the soil resistance can be calculated. With the values of parameter and already defined, it is possible to obtain the cohesive stress of the soil. The cohesive stress is the product s X in equation (9). Theoretical and experimental values of s X for drying and wetting paths are shown in Figure 19. In this figure, the product s X, considering s from SWRC and the parameter X, was calculated using equations (2), (3), (4) and (5). The same figure shows the theoretical result set obtained with the model equation (10).
In developing Figure 19 the value of k=1.6 in equation (2) was used. The residual degrees of saturation were obtained from the SWCR in Figure 11, with 0.04 for the path of wetting and 0.0325 for the path of drying.
Theoretical and experimental values of cohesive stress are greater in the drying process that in the process of wetting.
The equations to better approximate the experimental values are equations (2) and (3) of Vanapalli et al. (1996) in the wetting trajectory; in this case the values of the model are lower than the experimental values. In the trajectory of drying, the equation with values closer to the experimental values is equation (2) of Vanapalli et al. (1996) and the theoretical results of the model are closer to the experimental values from 5% degree of saturation on.
Engineering practice is still using relationships that provide values of shear strength of unsaturated soils that differ from the actual values. This is because the evaluation of effective stress involved in them has not been done properly. Uncertainties are mistakenly absorbed into problems of stability or load capacity in safety factors, but this leads to not really know the margin of safety with respect to the ultimate strengths.
Understanding the shear strength of this type of soil will affect the safety of engineering structures; to support this assertion simply check that each year during the rainy season landslides occur on slopes that affect structures. These facts account for lost lives and major economic damage left, this occurs because geotechnical designs do not consider the behavior of unsaturated soils.
Conclusions
It has been experimentally verified that the strength of silty sand reaches a maximum and then reduces with suction for both the wetting and drying path. Therefore, the angle φb is not constant for the tested soil and depends on the path of wetting or drying.
Theoretical and experimental values of cohesive stress are greater in the drying process than in the process of wetting.
The extension of the conclusions from this soil to other soil types should take into consideration the influence of soil composition and stress history soil behavior. There are no equations that can predict the behavior of the shear strength of all soils. Therefore, not only are more experiments necessary, but also the extension of the theoretical developments of unsaturated soils.
Acknowledgements
The authors are grateful to the Universidad Autonoma de Queretaro, Mex., for the facilities rendered to use the laboratories.
References
Annual book of ASTM STANDARDS. International Standard World Wide. Section four Construction Volume 04.08. Soil and Rock (I):D420-D-5611. 2004. [ Links ]
Bishop A. The Principle of Effective Stress. Teknisk Ukebald, volume 106 (issue 39), 1959: 859-863. [ Links ]
Fredlund D., Morgenstern N., Widger R. The Shear Strength of Unsaturated Soils. Canadian Geotechnical Journal, volume 15 (issue 3), 1978:313-321. [ Links ]
Garven E., Vanapilli S. Evaluation of Empirical Procedures for Predicting the Shear Strength of Unsaturated Soils, on: Proceeding of IV International Congress of Unsaturated Soils, Arizona, April 2006. [ Links ]
Jennings J., Burland J. Limitations to the Use of Effective Stress in Partly Saturated Soils. Geotechnique, volume 12 (issue 2), 1962: 25-144. [ Links ]
Khalili N., Khabbaz M. Unique Relationship for χ, for the Determination of the Shear Strength of Unsaturated Soils. Geotechnique, volume 48 (issue 5), 1998: 681-687. [ Links ]
Kumara G., Uchimura T. Effects of Wetting and Drying on the Unsaturated Shear Strength of a Silty Sand Under Low Suction, on: Proceeding of IV International Congress of Unsaturated Soils, Arizona, April 2006. [ Links ]
Murray E. An Equation of State for Unsaturated Soils. Canadian Geotechnical Journal, volume 39 (issue 1), 2002: 125-140. [ Links ]
Oberg A., Sallfours G. Determination of Shear Strength Parameters of Unsaturated Silts and Sands Based on the Water Retention Curve. Geotechnical Testing Journal, volume 20 (issue 1), 1997: 40-48. [ Links ]
Pereira A., Feuerharmel C., Gheling W., Bica A. A Study on the Shear Envelope of an Unsaturated Colluvium Soil, on: Proceeding of IV International Congress of Unsaturated Soils, Arizona, April 2006. [ Links ]
Rojas E. Equivalent Stress for Unsaturated Soils, on: Proceeding of IV International Congress of Unsaturated Soils, Arizona, April 2006. [ Links ]
Rojas E. Equivalent Stress Equation for Unsaturated Soils. I: Equivalent Stress. International Journal of Geomechanics ASCE, volume 8 (issue 5), 2008a: 285-290. [ Links ]
Rojas E. Equivalent Stress Equation for Unsaturated Soils. II: Solid-Porous Model. International Journal of Geomechanics ASCE, volume 8 (issue 5), 2008b: 291-299. [ Links ]
Simms P., Yanful E. Measurement and Estimation of Pore Shrinkage and Pore Distribution in a Clayey Till During Soil-Water Characteristic Curve Tests. Canadian Geotechical Journal, volume 38 (issue 4), 2001: 741-754. [ Links ]
Vanapalli S., Fredlund D., Pufahi D., Clifton A. Model for the Prediction of Shear Strength with Respect to Soil Suction. Canadian Geotechnical Journal, volume 33, 1996: 379-392. [ Links ]
Vanapalli S., Wright A., Fredlund D. Shear Strength of two Unsaturated Silty Soils over the Suction Range From 0 to 1,000,000 kPa. Proc.Of the 53rd Canadian Geotechnical Conference, Montreal, Canada, October 2000. [ Links ]
About the authors
Julio César Leal-Vaca. Civil Engineer, obtained his M.Sc. degree in 1998 in engineering in the area of Mechanics of Soils. He is a professor in the Engineering Faculty of the Universidad de Guanajuato, Mexico, since 1999. At present He is a Ph. D. student at the Universidad Autónoma de Querétaro.
Gustavo Gallegos-Fonseca. Civil Engineer, obtained his M.Sc. degree in 2002 in engineering in the area of Mechanics of Soils. He is a professor in the Engineering Faculty of the Universidad Autónoma de San Luis Potosi, Mexico, since 1993.
Eduardo Rojas-González. Professor and researcher in the Engineering Faculty of the Universidad Autónoma de Querétaro, Mexico.

