


Services on Demand
Journal
Article
 English (pdf)
 Article in xml format
 Article references
 Send this article by e-mail
Indicators
-
 Cited by SciELO
 -
 Access statistics
Related links
-
 Similars in
SciELO
Similars in
SciELO
Share

 Permalink
Ingeniería, investigación y tecnología
On-line version ISSN 2594-0732Print version ISSN 1405-7743
Ing. invest. y tecnol. vol.13 n.2 Ciudad de México Apr./Jun. 2012
Wideband Indoor Radio Propagation Measurements at 5.4 GHz
Mediciones de propagación de ondas de radio en banda ancha en interiores para 5.4 Ghz
Aragón–Zavala A.1, Mavrakis D.2 Castañón G.3 and Cuevas–Ruiz J.L.4
1 Departamento de Electrónica y Mecatrónica Tecnológico de Monterrey, Campus Querétaro. Correo: aaragon@itesm.mx
2 Informa Telecoms & Media plc Mortimer House. Correo: D.Mavrakis@eim.surrey.ac.uk
3 Departamento de Ingeniería Eléctrica y Computación Tecnológico de Monterrey, Campus Monterrey. Correo: gerardo.castanon@itesm.mx
4 Departamento de Ingeniería Eléctrica y Electrónica Tecnológico de Monterrey, Campus Estado de México. Correo: jose.cuevas@itesm.mx
Información del artículo: recibido: septiembre de 2008.
Aceptado: junio de 2011.
Abstract
Wideband indoor time domain measurements at 5.4 GHz are presented in this paper. A swept Time Delay Cross Correlator is used to measure the radio channel, and the measurements are performed using an autonomous robot that follows a predefined route line–of–sight and non–line–of–sight modern office buildings. Analysis shows that the RMS delay spread follows a normal distribution whose mean does not always increase with distance. Also, the global statistics of the RMS delay spread follow a truncated normal distribution with a better fit. Results are presented in the form of RMS delay spread and power delay profiles.
Keywords: broadband, measurement, propagation, RMS–delay–spread.
Resumen
En este trabajo se presentan mediciones de banda ancha de propagación de ondas de radio realizadas dentro de un edificio a 5.4 GHz. Un equipo que consiste en un medidor usando barrido del retardo de tiempos de correlación cruzada se utiliza para caracterizar el canal de radio y las mediciones se realizan utilizando un robot semi–autónomo móvil que sigue trayectorias claramente predeterminadas y repetibles, tanto en línea de vista como en ausencia de la misma, dentro de oficinas. Dicho análisis muestra que el retardo promedio RMS sigue una distribución normal, cuya media no siempre se incrementa con la distancia. Adicionalmente, las estadísticas globales del retardo promedio RMS siguen una distribución normal truncada usando un ajuste de curva mejor. Los resultados se presentan como retardo promedio RMS y perfil de retardo de potencia.
Descriptores: banda ancha, mediciones, propagación, retardo RMS
Introduction
Wireless communications are the fastest growing market of all times, where a need for seamless connectivity and mobility is apparent, especially nowadays that broadband applications are becoming increasingly popular among users. In order to achieve this, the communication system, the designer has to plan carefully and take accurate account of propagation channel impairrments. As modern digital cellular communication systems require larger bandwidths to support higher data rates, knowledge of the characteristics of the propagation channel becomes more significant. Moreover, accurate modelling of indoor propagation is very complicated. Wideband measurements equip the system designer with direct knowledge of the channel behaviour.
There is increased activity in the 5GHz band, not only for Wi–Fi networks, as was the initiative of HIPERLAN a few years ago; but also for the use of unlicensed Wi–MAX backhaul to other networks, such as the Internet. Wi–MAX has been already deployed successfully for public and private networks around the world, and seems to be still a valuable option for broadband wireless access until LTE becomes fully operational. Although some of these networks are destined to provide coverage outdoors, others will be mostly used indoors, serving mobile and stationary users in environments where high bandwidth is needed. Hence there is a great need for knowledge of the wideband channel, and measurements help to identify these most important characteristics.
Various wideband measurements procedures have been presented so far (Parsons, 1992). The simplest of all is sounding the channel with a short duration pulse and sampling the received signal which is the convolution of the pulse with the channel impulse response. However, its main limitation is that it requires a high peak–to–mean power ratio to successfully detect low power echoes. Another common technique is to use a network analyzer to perform frequency domain measurements and treating the RF channel as a lossy filter. Time domain information is later obtained by inverse Fourier transform of the frequency domain data. The drawback of this measurement method is that both transmitter and receiver must be physically connected to the network analyzer and mobile measurements may not be feasible. There is also a limitation with the period of the frequency sweep, which has to be long enough to sample all multipath echoes in the channel. On the other hand, mobile measurements are difficult if the sweep time is long, but if the sweep time is kept low, the channel will not be correctly sampled, since
The technique chosen here to measure the channel is the Swept Time Delay Cross Correlator (STDCC) or sliding correlator, which is the easiest method to implement a wideband time sounder, since there is no need for fast sampling and data storage (Kivinen et al., 1999). With this sounder, a carrier wave is modulated by a pseudo–random sequence, and is correlated at the receiver with a version of itself. This method shares the advantages of a spread spectrum communications system, where in–band interference is kept to a minimum, while the correlation process introduces processing gain (Cox, 1972).
Also, a significant advantage of the sliding correlator is that improved time resolution can be achieved by deconvolving the hardware impulse response from the received impulse response. Finally, the use of an autonomous robot platform to carry the measurements made the repeatability and traceability of the runs much easier and more accurate, a necessary requirement for the type of measurements we conducted here.
The paper is organized as follows. In section II the measurement setup, the robot platform and the measurement scenarios are presented in detail. In section III the analysis of the measurements are presented and the results are presented in section IV. Finally, the conclusions are presented in section V.
Measurement system definition
The sliding correlator is a popular method to study the mobile radio channel (Cox, 1972). The transmitter is a pseudo–random sequence generator with chip rate Rc and length m. The receiver consists of a correlator, which correlates the transmitted signal with a slightly delayed version of itself, sounding the channel every time the pseudo–codes sweep past each other. There is a need for high quality reference sources at both transmitter and receiver, since they are physically separated during each measurement. Hence, high accuracy atomic rubidium standards were employed in both ends, and were synchronized at the start of each measurement to ensure correct operation.
Time scaling or bandwidth compression is built in this sounding method, and defined from the scaling factor of the system, removing the need for fast sampling. The scaling factor is defined by the difference in clock rates as follows:
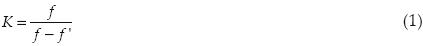
where f and f' are the transmitter and receiver sequence frequencies. The scaling factor has to be chosen carefully to avoid severe distortion in the cross–correlation as a result of a low K–factor (Cox, 1972).
The dynamic range R of a STDCC sounder is solely dependent on the pseudo sequence length, only if system noise is ignored, and given by:

practice, however, this dynamic range is not achieved due to hardware limitations, but presents the best achievable dynamic range given a particular sequence length.
In order to study such a diverse and cluttered environment, high multipath resolution has to be employed. This is dependent on the m–sequence length and its clock rate. The highest bound of the clock rate has to be adequate to sample speed of logic circuitry (Parsons 1992).
Also, the maximum time delay that can be studied has to be taken into account, which is equal to mτ0, where m is the m–sequence length and τ0 is its period.
Generally, the time resolution Δt is inversely proportional to the system bandwidth B, and again is limited by the hardware specifications:

The correlation between two correlations T can be expressed as a product of the m–sequence properties as follows:

where m and τ are the sequence length and period, while K is the scaling factor. From system simulations, it has been found that the optimal choice of scaling factor for K=5m, and (3) becomes:

Measurement setup
As mentioned above, the setup consisted of a sliding correlator that probed the channel with 100MHz sequence rate.
The transmitter was entirely mobile, autonomous and took the part of a user walking around in a typical office environment using a wireless service. The following sections describe the operation of the transmitter and receiver.
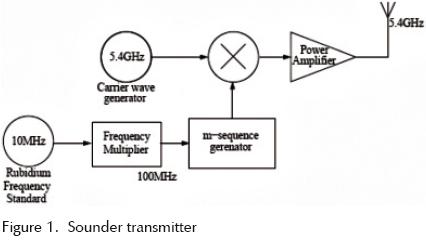
Transmitter
A simple diagram of the transmitter is shown in figure 1. The 5.4 GHz carrier is modulated by the 100MHz m–sequence. The length of the m–sequence has been chosen as 2047 to maximize dynamic range for the given speed of the mobile and centre frequency, and the scale factor K has been chosen to be 10235. If one of the frequency standards is clocked at 100MHz, the second must therefore be at 100.0097MHz. Also, from (3) the time resolution of the sounder is calculated in 10ns, which is adequate to characterize the wideband indoor channel.
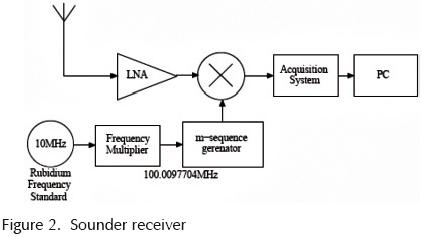
Receiver
In the receiver, shown in figure 2, the signal is filtered and amplified with a low noise amplifier, and then down–converted to baseband. As mentioned previously, the signal is then multiplied with a similar m–sequence clocked at 100.0097MHz. The received signal Rx(t) is the convolution of the impulse response h(τ,t) with the cross–correlation of the received and transmitted signals Rx(t):

where  denotes convolution and τ is the delay of the impulse response and is dependent on tK.
The outputs of the receiver were the I and Q channels of the received signal, and were connected to a computer acquisition system which performed 16–bit A/D conversion and stored the sampled data for further data processing.
Antennas
Two sets of antennas were used for the measurements. The first set consisted of omni–directional dipole antennas and the second set of a narrower beamwidth patch in the vertical plane, with a gain of 0dBi while the second had a 120 degree beamwidth with gain of 5dBi at boresight. In most of the measurements, the dipole was placed at the mobile transmitter with the nulls facing top and bottom, while the patch was placed at the receiver. This way the transmitter modelled a mobile user who requires an omni–directional antenna, while the receiver modelled the base station which uses more directional antennas with higher gain. With exception of one measurement, all the rest were performed with this antenna configuration. The transmitting antenna was placed at the height of 1.5m on the mobile platform, while the antenna at the receiving platform was placed at a height of about 1.8, on plastic poles.
Measurement procedure
The goal of these measurements was to measure the small scale effects of indoor propagation with a mobile transmitter. Three scenarios were chosen for the measurements, each investigating a different property of the channel. These were Line of sight (LOS), Non Line of Sight (NLOS) and Corridor environment. These three scenarios were performed in two different locations, one at the Centre of Communications Systems Research (CCSR) building in Guildford, UK, and the second at the Ericsson Telecommunications Centre in Burgess Hill, UK. All scenarios were performed in forward and backward directions to ensure repeatability of the measurements.
Finally, all measurements were performed in the same floor of the buildings, since floor–to–floor penetration measurements were not possible due to the limited dynamic range of the system.
The first environment was a medium–sized three storey office building at the University of Surrey (CCSR) that consists of office, corridors and some laboratory spaces. The offices were small rooms (typical room area 6m2) and larger areas (~ 20m2) occupied by desks and tall partitions, with light walls between the rooms. Measurements were performed on the second and third floors, with antennas placed on the same floor during a measurement.
The ETL environment was similar to the first one, but at a much larger scale. The open plan office spaces were far larger (~100m2) and the walls reinforced, while there were more offices and open spaces. Also, the walls were far more reinforced and generally the building was more cluttered. These measurements provided characterization of two very different common office building types.
Autonomous mobile robot platform
The transmitting platform was mounted on a robot that followed a predefined track. This allowed measurement of the mobile radio channel without the interference of a human body near the transmitter or receiver, which has been shown to have significant effect on the channel (Ganesh et al., 1993). The mobile platform is an advanced autonomous positioning system that has been designed and built in CCSR (Aragón et al., 2000). It follows a track on the floor, performing forward, left and right steering actions. Three infrared transceivers are placed at the lowest deck and point to the floor, and are configured to sense the reflection of light from light–coloured tape. The robot corrects its position with the reading from these sensors.
The mobile platform also includes some intelligent processing to simplify its operation and allow for some powerful data processing. High resolution optical encoders were used in the wheels of the robot to accurately sample its position, along with a gyroscope to correct any errors from the simple odometry algorithm (Aragón et al., 2000).
The position of the robot was transmitted wirelessly using a Digital Packet Radio Controller during each measurement. Ultrasonic sensors were included to provide a reference point for the measurements and all of the above were controlled by powerful micro–controllers.
The transmitter was mounted on the robot and the transmitting antenna was placed on top of the whole platform, on a polystyrene box to minimize interaction between the antenna and the metallic housing of the transmitter.
Measurement description
Measurements were performed in two dissimilar environments, but both classified as typical offices. This section presents the various scenarios performed for the measurements and their respective results.
CCSR measurements
The CCSR building was a π–shaped three storey building that mainly contained offices, soft portioned cubicles, corridors and some laboratories. The majority of the CCSR measurements were performed on the third floor of this building, which mainly consisted of a long corridor which had single offices in one side, and portioned cubicles on the other. Some measurements were performed on the first floor, which was similar to the second, except that the cubicles were replaced by laboratories and computer rooms.
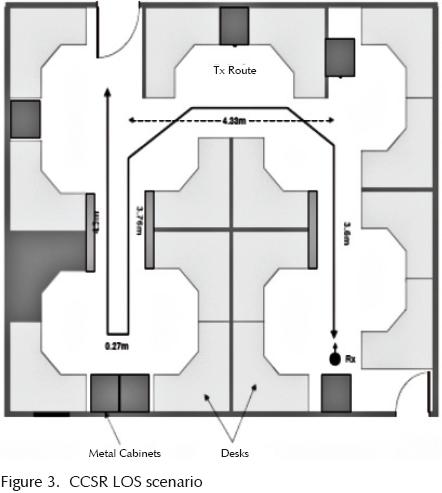
Scenario 1. Line–of–Sight (LOS)
This scenario was performed in the second floor of CCSR, in a partitioned office full of desks, soft partitions and filing cabinets. The transmitter followed a n shaped route in the room, and both transmitter and receiver were equipped with the patch antennas. Figure 3 illustrates this scenario.
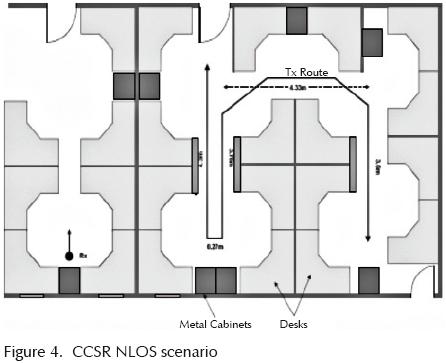
Scenario 2. Non Line–of–Sight (NLOS)
Similar to the previous scenario, this scenario took place on the third floor of the CCSR building with the exception that the transmitter and receiver were placed in different rooms. Also, the transmitter was equipped with an omni–directional antenna. Figure 4 illustrates this scenario.
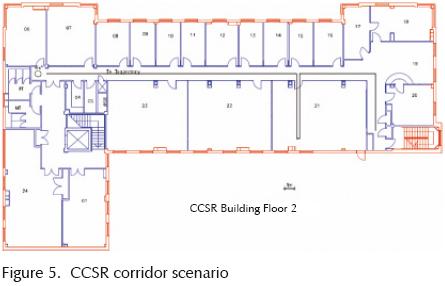
Scenario 3. Corridor
This scenario took place in the third floor of the CCSR Building, in the long corridor. The antennas were as in Scenario 2, omni–directional at the transmitter and patch at the receiver. Figure 5 illustrates the third floor of CCSR and the third scenario.
Human effect
This scenario was performed on the second floor of CCSR, in a long corridor. The effect of people has been proven to affect the quality of the link dramatically, especially if they are present near the receiver or transmitter (Ganesh et al., 1993). Also, it is reported that the worst case occurs when humans moving in the vicinity of the link randomly (Herradón et al., 1999). The transmitter and receiver were stationary, while several people were placed across the link, to study the effect of mobile users. Measurement without people, with people walking across and along the link performed. Both antennas were patches and pointed at each other at a height of 1.5m.
ETL scenarios
As with the scenarios in CCSR, these were per–formed in the ground and first floors of the ETL building. The scenarios followed a similar pattern to those performed in CCSR, with a similar pattern of those performed in CCSR, with the exception of the NLOS case, where the receiver was placed in a small seminar room and the transmitter moved in a small seminar room and the transmitter moved in an area full of partitioned cubicles outside this seminar room.
The major differences from the CCSR environments were the lower height partitions, the more cluttered spaces in the LOS and NLOS scenarios, the thicker walls and the much wider corridors.
Data analysis
It is possible to improve time resolution with the sliding correlator, by deconvolving the system response out of the measurement with the transmitter and receiver connected with a cable and an attenuator in line. Compensation has been introduced later for this attenuator.
After a back to back measurement has been done, normal measurements can be calibrated with the following method.
Deconvolution analysis
Let the back to back received signal and the channel response to be measured be:


where t is time and τ is time delay. The arrow denotes that these two arguments are Fourier transform pairs. The received signal in the presence of noise in the receiver is:

where denotes convolution. If we correlate with the back to back signal, we get:

where s*f is the complex conjugate of S(f). We can write s(t) s(–t) = r(τ)  R(f) = S(f)S*(f). Then

Convolution with r(τ) will reduce time resolution, but we can improve it by deconvolving the back to back impulse response. Hence:
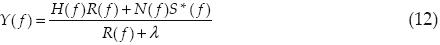
From the previous equation we can see that in the absence of noise, this gives an exact estimate of the channel. However, if S(f)  0 at fclk, noise in the region of fclk is magnified hugely. This will potentially obliterate the measured impulse response when translating back to the time domain. Therefore, we must add a small offset to the denominator of (12) to compensate for this:
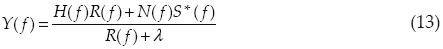
In the analysis, λ took values of 0.005 to 0.01. Ideally, delay resolution is maximized for a very small value of λ (Kivinen et al., 1999), but noise is amplified as λ is made smaller.
RMS delay spread
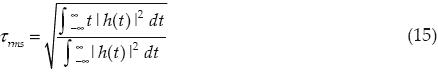
The RMS delay spread is the most significant description of the mobile channel. It is defined as:
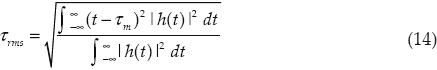
where h(t) is the impulse response of the channel and τm is the mean delay:
The mobile channel is very sensitive to the value of the RMS delay spread, since it is an indication of the multi–path severity and potential Inter Symbol Interference (ISI) on the channel. It has been mentioned in the literature that communications system can support data rates of up to a few percent of the inverse of the RMS delay spread without RAKE reception or equalization (Hashemi et al., 1994). However, it has also been reported that RMS delay spread is an important parameter in certain cases (Glance et al., 1983).
Goodness of fit tests
Goodness of fit tests are used to estimate whether a given signal follows a given distribution function. There are several tests suitable for the task, but the most important ones are Kolmogorov–Smirnov and Anderson–Darling tests.
The Kolmogorov–Smirnov test has widely been used in mobile communications for goodness of fit tests. It is based on the following formula (Kraft et al., 1968):

where Dn is the sample distribution defined by:

where F is the hypothetical distribution function and n is the number of measured samples.
The Anderson–Darling test is based on the following equation (Stephens, 1974):
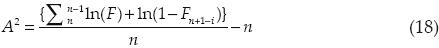
Both statistics are then compared to tables found in literature, and the measured data either fail or pass the given tests. The Kolmogorov–Smirnov is less powerful that the Anderson–Darling test, since it concentrates on the centre of the distribution, but not at the tails. Also, it performs well up to a sample size of 50, after which it performs poorly compared to the Anderson–Darling test.
The latter also is not limited to the centre of the distribution. Both tests have been performed on the RMS delay spreads of the measured data.
Results
This section presents some of the results from the measurements in most common formats. In almost every case, there is strong correlation in the forward and backward cases.
Power delay profiles
Sample Power Delay Profiles are shown in figures 6 and 7. It can clearly be seen that the cross polar component is in all cases lower than the co–polar, as expected. It is interesting to note though, that especially in the CCSR scenarios, that the cross–polar LOS component is attenuated or does not even exist, but scattered paths are strong an almost equal to the co–polar ones. However, this does not apply to the second pair of PDPs shown, since the first PSP is from a pure LOS case, where most of the power of the impulse response is in the LOS component, while the second is from ETL corridor which remains empty. Finally, it has been confirmed that the scattering objects are displayed as an exponentially decaying impulse in the impulse response (Saleh et al., 1987), for a variety of reasons. These can be diffuse or multiple reflections near the transmitter or receiver.
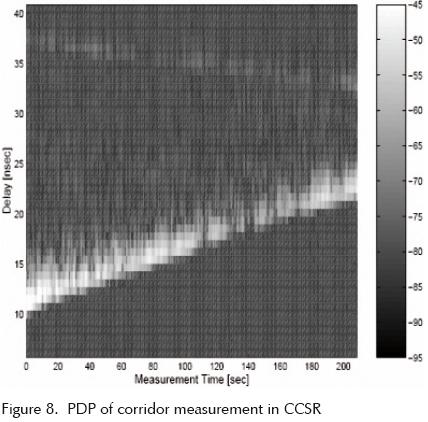
Figure 8 shows the Power Profile (PDP) of a forward corridor measurement in CCSR. A significant secondary reflection is present which exhibits decaying delay since the transmitter is traveling towards the scattering object. Since the measurements were performed in such a cluttered environment with scatterers always near the transmitter and receiver, it was not always possible to correctly identify different clusters in the PDPs, unless strong scatterers existed in the path of the transmitter, like the one shown in figure 9.
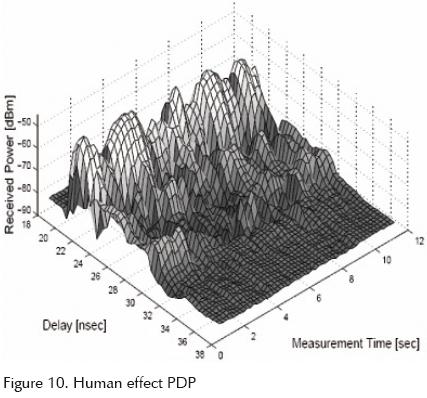
Effect of humans
This test studied the effect of people in a 5m link setup on a corridor. The results were compared with the free space case, and with people walking across and along the link, or just being stationary. The excess attenuation is not significant when only one person is walking across the link, but severe fluctuations appear when all four people were walking across the link randomly. Excess attenuation for this case is up to 15dB. However, it is interesting to note that the worst case is when one person is walking along the link, causing excess attenuation of up to 20dB.
A sample PDP is shown in figure 10, where all humans were walking across the link during the measurements.
Local statistics of the RMS delay spread
Local statistics are defined as the results of a single scenario or a single measurement within a scenario. The significance of the results is quite important since they give information about each case separately, and help distinguish which case is suitable for communication.
Figures 11 and 13 illustrate the delay statistics for the CCSR and ETL LOS and NLOS scenarios, for both polarizations received. In the LOS cases, the mean delay is increasing, since the transmitter is moving away from the receiver. On the other hand, the RMS delay spread is decreasing. The antennas used for this scenario were both patches, and pointed away from each other. Hence, at the beginning of the measurement there was no direct path between the two antennas, but as the measurement progressed, the transmitter and receiver came into line–of–sight. On the other hand, in the NLOS case, the RMS delay spread is increasing, since a dipole was used at the transmitter.
It is interesting to note that in some of the measurements, the cross–polar. This is explained as the lack of dynamic range of the system which is not able to always analyze the higher delay and attenuated paths that contribute to the RMS delay spread.
The RMS delay spread has previously been found to follow a normal distribution with mean that increases with antenna separation (Hashemi, 1993), (Sexton et al., 1989) or even that it stays constant due to equipment limitations (Varela et al., 2001). In our analysis, it has been confirmed that indeed local characteristics of the RMS delay spread follow closely a normal distribution. Also, in the mobile measurements performed, the mean of the RMS delay spread does not always increase with distance, especially in the corridor scenario in CCSR, where it decreases with the antenna separation. This was confirmed with both forward and backward cases. The area near the receiver was more cluttered than the rest of the run, which may account for the decreased delay spread as the transmitter moves away from the receiver. Also, the reflected paths from the walls start to group up as the transmitter moves away from the receiver, resulting in a lower delay spread. Finally, due to the limited dynamic range of the measurement system, higher delay paths which are attenuated further are not distinguishable and do not contribute to RMS delay spread.
As seen from figure 12 the transmitter is moving away from the receiver, resulting in increasing mean delay throughout the measurement. However, the RMS delay spread decreases with antenna separation. The cdf of the RMS delay spread follows a normal distribution as can be seen from the same figure.
The local statistics have been checked against a normal distribution with the goodness of fit tests mentioned above. The results passed both tests for 90% confidence interval and fit closely a normal distribution.
Global statistics
Global statistics are defined as the results of a full site measurement, these being in CCSR or ETL. In global statistics, the RMS delay spread follows a truncated normal distribution. This is in contrast with various publications (Hashemi et al, 1994) which mention that the RMS delay spread always follows a normal distribution for both global and local statistics. As before, the results were tested against a truncated interval of 90% with both the Kolmogorov–Smirnov and Anderson–Darling tests.
It is also interesting to note that the RMS delay spread is highly dependent on the environment of the measurements. In the CCSR building, minimum RMS delay spread was observed in the LOS scenario, moderate at the NLOS case, and maximum at the corridor scenario. On the other hand, these were quite different for the ETL building. Minimum RMS delay spread was observed for the LOS case, moderate for the corridor case, and maximum for the NLOS case. This can be easily explained since the corridor scenario in the CCSR building was a quite cluttered environment, where in ETL it was a wide empty corridor. Also, in the ETL building, the NLOS case was performed in a much bigger open plan office than the corresponding CCSR scenario, resulting in increased RMS delay spread, (figures 14, 15).
Summary and conclusions
Analysis of wideband radio measurements at 5.4GHz in two different building was presented. Time–domain analysis using the sliding was presented, which gave impulse response estimates of the radio channel. Using this data, local and global analysis spread variations in these environments. Results have been presented in the form of Power Delay Profiles and delay statistics.
The RMS delay spread showed good fit to a normal distribution in local statistics, but a truncated normal distribution was a better fit for global statistics, being a disagreement with various publications. Also, the mean of the RMS delay spread did not always increase with distance, and in some cases decreased with distance. The environment of the measurements had a significant impact on the RMS delay spread, especially when the measurements were performed in a cluttered or an empty environment.
Finally, temporal measurements with humans interfering with the link were performed, showing that significant fading occurs when there are random movements in the vicinity of the link.
Acknowledgments
The authors would like to acknowledge the help of Dr. Mauro Fiacco and Dr. Stravros Statvrou for their help with the measurement analysis and hardware.
References
Aragón A., Saunders S.R. Mobile Robots for Indoor Radio Propagation Measurements, on: European Advanced Robotics Systems Masterclass and Conference– Robotics 2000, April 2000, vol. 2, p. 8. [ Links ]
Cox D. Delay Doppler Characteristics of Multipath Propagations at 910 MHz in a Suburban Mobile Radio Enviroment. IEEE Transactions on Antennas and Propagation, AP–20(5):625–635, September 1972. [ Links ]
Ganesh R., Pahlavan K. Statistics of Short Time and Spatial Variations Measured in Wideband Indoor Radio Channels. IEEE Proceedings H: Microwaves Antennas and Propagation, 140(4):297–302, August 1993. [ Links ]
Glance B., Greenstein L.J. Frequency–Selective Fading Effects in Digital Mobile Radio with Diversity Combining. IEEE Trans. Commun., 31(9):1085–1094, 1983. [ Links ]
Hashemi H. Impulse Response Modeling of Indoor Radio Propagation Channels. IEEE J. Selec. Areas Commun., 11(7):967–978, September 1993. [ Links ]
Hashemi H., Tholl D. Statistical Modeling and Simulation of the RMS Delay Spread of Indoor Radio Propagation Channel. IEEE Trans Vehic. Technol. Conference, 43(1):110–120, 1994. [ Links ]
Herradòn–Garcia R., Jiménez F., Hernando J.M. Spatial and Time Variations of Wideband Indoor Radio Propagation, on: VTC 99: IEEE 49th Vehic. Technology Conference, 1999, vol. 1, pp. 194-198. [ Links ]
Kivinen J., Korhonen T.O., Aikio P., Gruber R., Vainikainen P., Haggman S.G. Wideband Radio Channel Measurement System at 2 GHz. IEEE Transactions on Instrumentation and Measurement, 48(1):39–44, February 1999. [ Links ]
Kraft C.H., Van–Eeden C. A Nonparametric Introduction to Statistics, The Macmillan Company, 1968. [ Links ]
Parsons J.D. The mobile radio propagation channel, Halsted Press, 1992. [ Links ]
Saleh A.A.M., Valenzuela R.A. A Statistical Model for Indoor Multipath Propagation. IEEE J. Selec. Areas Commun., SAC–5(2): 128–137, February 1987. [ Links ]
Sexton T.A., Pahlavan K. Channel Modeling and Adaptive Equalization of Indoor Radio Channels. IEEE J. Selec. Areas Commun., vol. 7, January 1989, [ Links ]
Stephens M.A. EDF Statistics for Goodness of Fit and Comparisons. J. Amer. Stat. Assoc., 69(347):730–737, September 1974. [ Links ]
Varela M.S., Sánchez M.G. RMS Delay and Coherence Bandwidth Measurements in Indoor Radio Channels in the UHF Band. IEEE Trans. Veh. Technology, 50(2):515–525, March 2001. [ Links ]
Bibliography
Bultitude–Melançon R.J.C., Zeaghloul H., Morrison G., Prokki M. The Dependence of Indoor Radio Channel Multipath Characteristics on Transmit/Receive Ranges. IEEE J. Selec. Areas Commun., 11(7):979–990, September 1993
ETSI Technical Specification 101475 v 1.1.1. Broadband Radio Access Networks, HIPERLAN Type 2, Physical Layer. Technical report, April 2000.
Honcharenko W., Bertoni H.L., Dailing J.L., Qian J., Yee H.D. Mechanisms Governing UHF Propagation on Single Floors in Modern Office Building. IEEE Trans. Veh. Technology, 41(4):496–504, November 1992.
Lafortune J.F., Lecours M. Measurement and Modeling of Propagation Losses in a Building at 900 MHz. IEEE Trans. Veh. Technology, 39(2):101–108, May 1990.
Santamaría A., López–Hernández F.J. Wireless LAN Systems, Artech House, 1993.
About the authors
Alejandro Aragón–Zavala. He completed a BSc in Electronics and Communications Engineering at Tecnológico de Monterrey, Campus Querétaro México, in 1991. In 1998, he obtained an MSc with distinction from the University of Surrey, UK, in Satellite Communication Engineering, and in 2003 a PhD in Mobile Communication Systems, with a major in indoor propagation at the University of Surrey, in the UK. He worked as a project manager for Hylsa, Puebla, Mexico, for five years, as well as a part–time lecturer for Universidad Iberoamericana, also in Puebla, Mexico. In 1998, he joined Cellular Design Services Ltd. (now Red–M) as a Research Fellow, and in 2000 he became In–building Radio Consultant within the same company. In 2002 he was promoted to Senior In–building Consultant, working as a member of the Radio Technology Group. Currently, is working as Head of Electronics–Mechatronics Department at Tecnológico de Monterrey, Campus Querétaro. He is also an associate consultant for Real Wireless Ltd. in the United Kingdom. He is SNI level 1 researcher. He is the author of two books and more than 25 international papers.
Dimitris Mavrakis. is a freelance partner of Informa Telecoms & Media and specialises in telecoms development. He is the leading or co–author of several strategic reports, including IMS Opportunities and Challenges, Future Mobile Computing and Wireless Automation. He has over five years' experience in the telecoms market and has previously played a leading role in several UK and global research contracts during his academic career. He holds a BSc in Electronics from the University of Kent, United Kingdom, in 1998; an MSc in Satellite Engineering from the University of Surrey, UK, in 1999 and a PhD in Mobile Communications from the same University, in 2003. He was the marketing director of Solar Photon, in 2008; and associate analyst for Vision Mobile Ltd., in 2007; project manager for Waveplan, Ltd. from 2003 to 2005 and research fellow at the University of Surrey in 2002.
Gerardo Castañón. He is associate professor, investigador nacional nivel 1 (SNI I) in Mexico. Member of the Academy of Science in Mexico, He received the Bachelor of Science in Physics Engineering from the Monterrey Institute of Technology and Higher Education (ITESM), México in 1987. He received the Master of Science degree in Physics (Optics) from the Ensenada Research Centre and Higher Education, México in 1989. He also received the Master and PhD degrees in Electrical and Computer Engineering from the State University of New York (SUNY) at Buffalo in 1995 and 1997 respectively. He was supported by the Fulbright scholarship through his PhD studies. From January of 1998 to November of 2000 he was a research scientist working with Alcatel USA Corporate Research Center in Richardson TX, USA. From December of 2000 to August of 2002 he was a senior researcher with ujitsu Network communications doing research on ultra high speed transmission systems. He is now working in the Center of Electronics and Telecommunications at ITESM since September of 2002. Has over 50 publications in journals and conferences and 2 international patents. He frequently acts as a reviewer for IEEE journals. He is a senior member of the IEEE Communications and Photonics societies.
José Luis Cuevas–Ruiz. Received his PhD from Universitat Politecnica de Catalunya, Barcelona, Spain, in 2005, where he was involved in the HeliNet and CAPANINA projects related to high–altitude platform systems. His research interests include High Altitude Platforms (HAPS), wireless communications and channel modelling. He is the author of the book "High Altitude Platforms for Wireless Communications", Wiley, 2008, and has published more than twenty international research papers in radiocommunications. He has been with Tecnológico de Monterrey Campus Estado de México since 1999, and currently he is Head of the Mobile Communications Research Group at Campus Estado de México.

