


Servicios Personalizados
Revista

Articulo
 Inglés (pdf)
 Artículo en XML
 Referencias del artículo
 Enviar artículo por email
Indicadores
 Citado por SciELO
 Links relacionados
-
 Similares en
SciELO
Similares en
SciELO
Compartir

 Permalink
Ingeniería, investigación y tecnología
versión On-line ISSN 2594-0732versión impresa ISSN 1405-7743
Ing. invest. y tecnol. vol.10 no.2 Ciudad de México abr./jun. 2009
Available Energy and Cumulative Frequency Curves for Parabolic Trough Concentrators with Alignment North–South, in the Northwest of Mexico
Curvas de frecuencia acumulada para un concentrador solar de canal parabólico con orientación Norte–Sur en el Noroeste de México
Álvaro Lentz–Herrea1, Rafael Almanza–Salgado2, Serafín López –Ríos3 and Roberto Cadenas–Tovar4
1 Instituto de Ingeniería. Universidad Nacional Autónoma de México. E–mail: solar_lentz@yahoo.com.mx
2 Instituto de Ingeniería. Universidad Nacional Autónoma de México. E–mail: ras@pumas.ii.unam.mx
3 Gerencia de Proyectos Geotermoeléctricos Comisión Federal de Electricidad. Morelia, Michoacán. E–mail: slopezrios@gmail.com
4 Gerencia de Proyectos Geotermoeléctricos Comisión Federal de Electricidad. Morelia, Michoacán. E–mail: roberto.cardenas@cte.gob.mx
Recibido: agosto de 2007
Aceptado: abril de 2008
Abstract
The Northwest of Mexico is a well known region with the highest ambient temperatures along the summer and the highest levels of irradiance, which make it feasible to install solar field concentrators. This work provides beam irradiance data that can be used to design a solar north–south parabolic trough system. The variation between the value of beam solar irradiance estimated by a pyranometer and the direct irradiance received by the aperture area of a parabolic trough concentrator (PTC) is well–known as cosθ. This variation was evaluated every day of the year, obtaining values of average irradiance for Cerro Prieto (CP) lat. 32°39', long. 115° 21', and San Luis Rio Colorado (SLR) lat. 32°30', long. 114°46', with which they were elaborated the available energy and cumulative frequency curves (CFC). These are useful to know the number of hours of field solar concentrators which can operate at different levels of energy, as well as the steam production of a solar–geothermal hybrid system to produce electricity.
Keywords: Solar beam irradiance, parabolic trough concentrator, available energy.
Resumen
El Noroeste de la República Mexicana es la región con las mayores temperaturas durante el verano y con los mayores niveles de irradiancia solar, lo último hace factible la instalación de concentrado res solares. En este artículo se elabora información de la componente directa de la irradiancia solar, la cual es utilizada en el diseño de concentradores solares tipo canal parabólico con orientación Norte–Sur. La variación entre el valor de la irradiancia solar directa obtenida por un piranómetro y la irradiancia directa recibida por el área de apertura de estos concentradores, que se encuentran en posición horizontal, se conoce como cosθ. Esta variación se evaluó cada día del año, obteniéndose valores promedio de la irradiancia para Cerro Prieto (CP), B.C.( lat. 32°39', long. 115° 21'), así como para San Luis Río Colorado (SLR) (lat. 32°30', long. 114°46'); además fueron obtenidas las energías disponibles mes por mes, así como las curvas de frecuencia acumulada (CFC). Esta información es útil para conocer el número de horas que un campo solar de concentradores podría operar con diferentes niveles de energía, así como la producción de vapor en un sistema híbrido solar–geotermia para la generación de electricidad.
Descriptores: Irradiancia directa solar, concentradores canal parabólico, energía disponible.
Introduction
The design of solar concentrator systems requires a specific presentation of meteorological data, namely solar irradiation. The aim of this work is the study of the frequency distribution of solar radiation as cumulative frequency curves of beam irradiation (CFCs) and the related concept of available solar energy from the solar irradiation measured in two cities in the northwest of Mexico: San Luis Río Colorado, lat. 32°30', long. 114°46' in Sonora state and Cerro Prieto (CP) in Baja California state, lat. 32°39', long. 115° 21'.
Cerro Prieto is the most important geothermal field in Mexico; this area also has the highest levels of irradiance in the country (Almanza and López, 1978). These levels of irradiance made it feasible to set up a solar collector field in a geothermal field to create a hybrid system to increase electricity production throughout the day, Lentz et al., 2002; Lentz, 2005. The average peak beam irradiance through out the year is 734 W/m2. The hybrid system is proposed in order to increase the steam flow available for electric generation in the actual geothermal cycle. The Mexican electricity company (CFE), which be longs to the government, has been in contact with our group in order to study the technical and economical feasibility of a hybrid solar–geothermal system.
San Luis Río Colorado (SLRC) is a city near CP, with about 30 km between them with about the same meteorological conditions, and this place was considered for a project to build a combined cycle with a solar field (CFE, 2002); therefore, a pyrheliometer was installed.
The electricity demand increases during the summer because the ambient temperature can reach 50°C. One of the reasons of this project is to use the solar resource to increase the production of electricity by increasing the quantity of steam coming from the geothermal wells, Lentz, 2002, which is a mix of brine and steam.
The irradiance data were also measured in the CP geothermal field using a rotating shadow band pyranometer, in which measurements have been made from the year 2000 up to 2004, with these data a year average was obtained. The pyranometer measures with an allowable error +/– 2% in days with few clouds and +/– 5% in cloudy days or with highly intermittent cloudiness. This device is calibrated yearly at the Geophysics Institute UNAM. This data was compared with a 3 years of DNI (direct normal irradiance) measured at 30 km from this zone with a Kipp & Zonen pyrheliometer with allowable error +/– 5%. The collected data shows that it is a zone with high levels of solar irradiance and few cloudy days dur ing the year, which suggests that CP a nd SLRC can be ideal sites for the installation of a field of solar concentrators (CFE, 2003). The goal in CP is to increase the production of steam in the present geothermoelectrical cycle, by the use of a solar field of line–focused concentrators of the parabolic trough type in a solar–geothermal hybrid system. The parabolic trough concentrators (PTC) use the direct component of the solar irradiance, so when equipment like this is used, it requires sites like Cerro Prieto with a high incidence of direct beam irradiance. It is important to clarify that direct solar irradiance (DNI) is measured directly by a pyrheliometer, which is a telescopic type device with a narrow aperture that faces the sun and follows its apparent motion. The measurement device is normal to the originating sun irradiance. Al though the PTC is oriented towards the sun, this one is not completely normal to the sun's irradiance. A PTC can be oriented to one of three forms: in an east–west direction with north–south tracking, a north–south and east–west tracking, and the well–known north–south polar with east–west tracking.
The first two are on the horizontal position, which means that the direction through out the parabolic trough must take into account the correct moment to evaluate the cosθ. Some preliminary calculations have been made in order to know which orientation of the parabolic troughs is most convenient to get the highest level of solar beam irradiance into the absorber pipe of such concentrators, and the north–south orientation is most convenient. Thus, the PTC solar field proposed is horizontal north–south with tracking east–west, including the correction of cosθ (Almanza and Muñoz, 1994).
Use of real data for a specific place and year provides only a performance simulation for that place and year, but its reliability as a prediction for the long–term average is uncertain. After all, variability in monthly total irradiance from one year to the next com monly exceed ±10%, and the variability for ther mal collectors are even larger (Collares and Rabl, 1979).
Methodology
Yearly average
There is a weather station in the geothermoelectric field of Cerro Prieto; in this field has been in stalled a rotating shadowband pyranometer which measures global and diffuse irradiance. The direct irradiance data is calculated by the same device, so that it is counted based on data from 2000 to 2003. With these data averages, a yearly average was obtained hourly for every day of the year, since the station makes measure ments every 15 minutes. Four data were used to make the hourly averages for every day of the year, which were divided equally as well with their corresponding year, with four years used to make the hourly average.
In San Luis Rio Colorado, a pyrheliometer has been in stalled which measures direct irradiance, which is measured on data from 2002 to 2003. With these data averages, an average year was obtained. Four data were used to make the hourly averages for every day of the year, which were divided equally as well with their corresponding year, so that two years were used to make the hourly average. In general the seasonal variability of the weather may require a separate calculation for each month of the year.
Normal direct irradiance by the capturing surface (cosθ)
When devices take advantage of only the direct component of irradiance and in particular the PTC, they are used because its movement is only in one axis. This means that the surface of the concentrator receives solar rays that are not totally normal to the sun, because is there an angle between normal to the plane and the incident irradiance (θ). The cosine of the angle θ (cosθ) is defined as the variation between the direct and the normal one to the capturing surface. This is known as an aperture area; it means the projected area of PTC intercepting beam irradiance. The angle is calculated to evaluate the losses generated by this variation. The following equation (1) allows evaluation of the cosθ for a PTC field for the north–south (Duffie and Beckman, 1991):
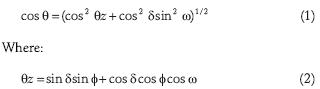
Once the factor cos θ for the entire year is obtained, it is multiplied with the corresponding values of DNI; the result of this is used for the accomplishment of cumulative frequency curves and the available energy of the irradiance that can be taken advan tage of the PTC.
Cumulative frequency curves and available energy
The cumulative frequency curves are defined as curves giving the time (nh) during which the solar irradiance on a given plane has exceed a value (Ic). The cumulative frequency curves (CFC) represent the frequency, in terms of monthly average of the number of hours with which the irradiance (global or direct) incident on the aperture area is greater than or equal to a certain critical level (Bourges, 1992; Perrot, 1963). If a system of Cartesian coordinates is constructed with the results of these calculations, the cumulative frequency curves for every month of the year can be shown. The vertical one is the axis of the irradiances (W/m2) subdivided into as many intervals as critical levels are desired, and the horizontal one is the axis where the number of times imagines that the critical level was exceeded through out the day during intervals that were measured —in this case every fifteen minutes— from sunrise until sun set (diurnal time), divided by the number of days of the corresponding months, including the years of data where upon it counts. The CFCs of the direct normal irradiance to the PTC were made for the 12 months of the year, having separated the data of every month in the following way: since it has been seen that solar irradiance reaches the maximum values on days to tally cleared of clouds, this means 1200 W/m2 in sites with greater in solation. Then the interval will include from 0 to 1200 W/m2, which is subdivided into critical levels (thresh olds) of the global or beam solar irradiance, in agreement with the practical interest that it is had for different applications that involve the advantage of solar energy. In this case the interval from 0 to 1200 W/m2 was subdivided into 25 intervals of W/m2. Once this subdivision is made, a certain critical level is chosen and it is come to count the number of times that this level was exceeded during each interval of 60 minutes, one hour, through out every day and of every month of the years that include the information upon which it is measured. This is repeated for all the levels in which the interval of maximum irradiances has been divided and for the site of observation. The cumulative frequency curves display the number of hours' average in which different levels from irradiance in W/m2 are had. In this case, they appear to be the hours of direct irradiance for the north–south field concentrators of Cerro Prieto. If the threshold irradiance Ic of a solar system is known, the CFC makes it possible to obtain the collector operating time directly as nh(Ic).
The area delimited by the CFC, the vertical axes and horizontal axes or Ic line, represents the solar energy available above the critical flow of irradiance, Ic. The solar energy available is given by the simple integral in equation 3:

As noted, for a zero threshold HC = 0. The intercept with the vertical axis represents the maximum solar irradiance (Imax) which can be achieved during the month on the plane considered, Imax is generally observed at solar noon on clear days.
Comparison of the data
With the purpose of validating the data, that is to say, to verify that they are so reliable, the cumulative frequency curves and solar available energy of beam irradiance in Cerro Prieto are compared with the curves of San Luis Río Colorado.
Results
Next the Cerro Prieto cumulative frequency curves (figs. 1, 2, 3 and 4) are shown, which display the number of hours that, on average, are measured for different levels of irradiance in W/m2. Figures 5, 6, 7 and 8 show the solar energy available. In this case, the hours of direct irradiance registered in the geothermal Cerro Prieto field appear, taking into account the data from normal beam irradiance averaged from four years, and the value of the cosθ factor.


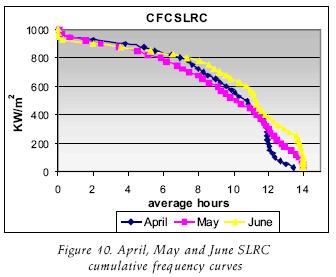
Figures 9, 10, 11 and 12 are cumulative frequency curves for San Luis Río Colorado, which display the number of hours in W/m2 of beam irradiance average from two years and the value of the cosθ factor.


Figures 13, 14, 15 and 16 show the solar energy available. In this case, the hours of direct irradiance registered in San Luis Río Colorado appear, taking into account the data from normal beam irradiance averaged from three years and the value of the cosθ factor.


When the cumulative frequency curves and solar available energy of beam irradiance in Cerro Prieto compared with the curves of San Luis Río Colorado, they do not have important variations that could disqualify either set of measurements.
The CFC's are useful to consider them onthly production of a solar field. If it is required, it is possible to do them with greater detail, making a greater number of divisions at the intervals of the critical levels. The CFCs of June in CP and SLRC, which were observed over 800 W/m2 had six hours, implying that a concentrator will work with those levels or over if higher irradiance can be obtained during that number of hours. This implies that during this period the steam production can be obtained for that power or over this period if the irradiance is higher, depending on the area of the PTC solar field. If the equipment works over 400 W/m2, it will operate for around 11 hours. Following with another example now with the month of January, such equipment will only operate for around two hours over 400W/m2, not arriving at one hour over 800W/m2. In this case the division through out the year was made by month, but it can be made by an other form, for weeks or every 10 days throughout the year.
Nomenclature
θ : Angle of incidence of beam irradiance on a surface [degrees]
δ : Solar declination [degrees]
Φ: Latitude [degrees]
ω : Hour angle [degrees]
β : Slope [degrees]
γ: Surface azimuth angle [degrees]
nh: Time [hours]
Ic: solar irradiance on a given plane. [W/m2]
Imax: maximum solar irradiance. [W/m2]
Z: zenital
Conclusions
The data provided in Cerro Prieto of direct solar irradiance are calculated from the data of global and diffuse irradiance measured by a pyranometer of rotating shadowband pyranometer type; these data of direct normal irradiance have the disadvantage of not being measured directly by a pyrheliometer, but for evaluating the technical feasibility are sufficient. The data do not present great variations allowing confidence in them, al though the compared data were of global irradiance. It is advisable to count with a pyrheliometer in Cerro Prieto to measure the normal direct irradiance, and not to calculate it since one has become in this case.
The CFC shows that the months with the greater number of hours at the highest levels of irradiance are the months of April to July and, at the other extreme, those of minor level are the months of November to January. With the use of these curves it is possible to observe in which month the greater steam production is possible. If a solar field of solar concentrators were used, this one would be the month of June and the one with the smaller production would be the month of January. The disadvantage of the CFC is that it is not possible to know with exactitude to the hour when the different levels of irradiance are obtained. The amount of energy is known in the number of hours' average permonth, but not in which moment these appear, which is important in an electrical generation plant when is required in detail. This can be done only in real–time if a pyrheliometer is available or, in the future, with satellite images, if a good methodology is available.
The solar field with north–south alignment in the solar–geothermal hybrid system is a good option to cover the demand peak in summer due to air conditioning in Cerro Prieto and San Luis Río Colorado.
Acknowledgments
To CONACyT by the scholarship granted to the first author, the DGAPA by supported economic for the development of the project, to the Federal Commission of Electricity by the economic support, the asked for information and the facilities.
References
Almanza R., López S. Total Solar Radiation in Mexico Using Sunshine Hours and Meteorological Data. Solar Energy, 21:441–448. 1978. [ Links ]
Almanza R, Muñoz F. Ingeniería de la Energía Solar. Mexico DF. Colegio Nacional. 1994. Pp. 87–103. [ Links ]
Bourges B. Climatic Data for Hand book Europe, Kluwer. Netherlands. Academic Publishers. 1992. Pp.15 –18. [ Links ]
Comisión Federal de Electricidad (CFE). Internal Report Bid 13164093–002–02, CFE–23–CC–MI–II. (in Spanish). México. 2002. [ Links ]
Comisión Federal de Electricidad (CFE). Private Communication. Morelia Michoacán. 2003. [ Links ]
Collares–Pereira M., Rabl A. Simple Procedure for Predicting Long Term Average Performance of Nonconcentrating and Concentrating Solar Collectors. Solar Energy, 23:235. 1979. [ Links ]
Duffie J., Beckman W. Solar Engineering of Thermal Processes. Second Edition. New York, USA. Wiley Interscience. 1991. Pp. 13–27. [ Links ]
Lentz A., Almanza R., Ruiz V. A Hybrid Solar–Geothermal System to Increase the Quantity of Steam in Cerro Prieto, Baja California, Paul Scherrer Institut. In: Proc 11th SolarPACES 2002, International Symposium, Zurich, Switzerland, 2002, p. 553. [ Links ]
Lentz A. Incremento en la cantidad de vapor de los ciclos geotermoeléctricos mediante concentradores solares de canal parabólico. Tesis (Ph. D. dissertation). Posgrado de las Ingenierias UNAM. México, 2005. [ Links ]
Perrot. La houille d'or, Éditions Fayard. Paris. 1963. Pp. 32–36. [ Links ]
About the authors
Alvaro Eduardo Lentz–Herrea. Ph. D. in Energy Engineering, UNAM 2005. Engineering Masters in Energy, 1998. Mechanical–Electrical Engineering, UNAM 1995. Research–Professor at the Program of Energy of the Mexico City Autonomous University.
Rafael Almanza–Salgado. Full Research Professor at the Engineering Institute, UNAM, working in projects of solar energy for 35 years. Level 3 in the National System of Researchers. NATIONAL UNIVERSITY PRIZE 2006 in Technological Innovation and Industrial Design.
Serafín López–Ríos. He is Mechanical engineer of the Michoacan University; he has been professor in thermal power plants for more than 20 years at the same university. He got his Masterful in Administration at the Vasco de Quiroga University; at the moment holds the position of Assistant Manager of Projects of Renewable Energy in the Management of Geothermal electric Projects of CFE, where he has spent 25 years to the development of geothermal and new renewable energy projects.
Roberto Cadenas–Tovar. With drawn mechanical engineer of the Faculty of Engineering at the UNAM. Scholarship holder and academic technician of the Engineering Institute, UNAM, participating in projects of solar energy. He retired from the Federal Commission of Electricity, where he toiled by 25 years in the Management of Geothermal–electric Projects, participating in geothermal, wind and solar projects.

