


Serviços Personalizados
Journal
Artigo
 Inglês (pdf)
 Artigo em XML
 Referências do artigo
 Enviar este artigo por email
Indicadores
-
 Citado por SciELO
 -
 Acessos
Links relacionados
-
 Similares em
SciELO
Similares em
SciELO
Compartilhar

 Permalink
Ingeniería, investigación y tecnología
versão On-line ISSN 2594-0732versão impressa ISSN 1405-7743
Ing. invest. y tecnol. vol.9 no.3 Ciudad de México Jul./Set. 2008
Estudios e investigaciones recientes
Effect of imperfect knowledge of hazards on the reliability of concrete face rockfill dam and breakwater
Efecto del conocimiento imperfecto de peligros sobre la confiabilidad de presas de enrocamiento con cara de concreto y rompeolas
D. De León–Escobedo1 and O. Fuentes–Mariles2
1 Facultad de Ingeniería, Universidad Autónoma del Estado de México E–mail: dleon@uaemex.mx
2 Instituto de Ingeniería, Universidad Nacional Autónoma de México, México
Recibido: mayo de 2007
Aceptado: septiembre de 2007
Abstract
A formulation to treat aleatory and epistemic uncertainties, in a separate way, on infrastructures is proposed and applied to a dam and a breakwater in Mexico. The purpose of that is to de termine 2nd order bounds on the reliability estimation due to the in complete knowledge of some design parameters. These bounds provide a quantitative basis for risk management according to the risk–aversion of owners and operators of the infrastructure. Also, acceptable values of reliability, are assessed in terms of consequences costs, and an initial cost curve for a breakwater is presented, as they may contribute to enhance the decision making process.
The in corporation of epistemic uncertainty makes the reliability index to become a random variable and its his to gram is obtained to estimate percentiles as a means to measure a new additional room for decisions as compared to the traditionally used mean value of the reliability. Conservative decisions are illustrated for design and assessment of structures like a dam and a breakwater.
The procedure involves a double loop of Monte Carlo simulation and represents a basis for the optimal design and risk management of dams and breakwaters.
Keywords: Structural reliability, aleatory and epistemic uncertainty, failure probability, risk management, Monte Carlo simulation.
Resumen
Se propone una formulación para tratar separadamente las incertidumbres aleatoria y epistémica en obras de infraestructura y se aplica a una presa y un rompeolas. El propósito de lo anterior es determinar límites de 2o. orden en la estimación de la confiabilidad, debido al conocimiento incompleto en algun(os) parámetro(s) de diseño. Estos límites proveen bases cuantitativas para una administración de riesgos de acuerdo a la aversión al riesgo de dueños y operadores de infraestructura. También se evalúan valores aceptables de confiabilidad y se presenta una curva de costo inicial para un rompeolas, como elementos que pueden contribuir a mejorar el proceso de toma de decisiones.
La incorporación de incertidumbres epistémicas ocasiona que el índice de confiabilidad se convierta en variable aleatoria y su histograma se obtiene para estimar percentiles que pueden usarse como medios para medir el espacio nuevo para decisiones como alternativa al uso tradicional del valor medio de la confiabilidad. Se ilustran decisiones conservadoras para diseño y evaluación de estructuras como una presa y un rompeolas. El procedimiento implica la realización de un doble ciclo de simulación de Monte Carlo y representa la base para el diseño óptimo y la administración del riesgo en presas y rompeolas.
Descriptores: confiabilidad estructural, incertidumbres aleatoria y epistémica, probabilidad de falla, administración del riesgo, simulación de Monte Carlo.
Introduction
In all the fields of engineering, planning, design, in spection or maintenance, the risk appears as an evidence of the degree of exposure that a facility faces due to a hazardous or adverse event (Ang, 1984).
A quantitative risk measure is usually considered as the product of the probability that the hazard occurs, along with its con sequent structural damage or failure, and the cost of the con sequences de rived from those damages or failure.
This probability is a scientific way to model, in the planning and design process, the uncertainties inherent to the demand that the hazard imposes against the structure capacity. However, especially for natural hazards, the calculated probability depends on the parameters used for the demand estimation. This requires a prediction ef fort which is not perfect and, therefore, contains epistemic uncertainty. It is commonly recognized that there are two sources of uncertainty: aleatory (from the natural or inherent variability of the random variable) and epistemic (from the imperfection of analytical tools, limited samplings or observations, errors on recording devices, etc.) and that the epistemic uncertainty is the one that may be reduced up to some extent.
From the above, the calculated probability may be interpreted as a random variable associated with the epistemic uncertainty. Similarly, the consequences of the damage or failure may also be characterized throughout aleatory and epistemic uncertainties. The calculated risk may be, there fore, considered as a random variable, with a probability density function, from which specific probabilities to achieve a target risk may be de termined.
For this work, the separation between aleatory and epistemic uncertainties is convenient because it makes it pos si ble to generate 2nd order estimates on the reliability value given that the epistemic un certainty is the one that may be reduced through additional research or information. The variability on reliability permits the interpretation of bounds according to a desired confidence level.
For decision making purposes, the appropriate risk may then be specified as a particular percentile or confidence level; for example, for risk–aversive man ag ers, the percentiles 90, 95 or 99 may be adequate. The decision may be either applied to design or assessment. De pending on the degree of conservatism desired for a design, a proper option may be selected. This provides the owner, or manager of an important facility, a flexible way to make decisions which are more consistent with his particular perception of the risk, and his willingness to take it, as compared to the traditional use of the mean value of the risk or annual reliability. This approach appears to be tuned up with the trend of the modern philosophy of risk management.
A formulation for the separate treatment of aleatory and epistemic uncertainties for engineering structures has been previously presented for infra structure facilities where the mean reliability is not enough as a safety measure (Ang et al., 2005).
Important engineering works, like dams and break waters, require careful safety estimations for design and assessment purposes. Structural reliability techniques constitute the proper frame work to make those estimations. In the past, several reliability procedures have been proposed (Castillo et al., 2004), (Hud son, 1959), (Melby, 1997) and (Nagao et al., 2005). However, a separate treatment of aleatory and epistemic un certainties, with its advantages, has not been included for dams and breakwaters.
In this work, those advantages are explored from the point of view of the calculation of the effect that an imperfect knowledge of the hazards has over the variability of the annual structural reliability. Allowance is made for conservative decisions be cause, in stead of taking the mean value of the reliability, percentiles determined in terms of confidence levels may be used for risk–aversive operators or managers.
In the future, this type of study may contribute to enhance the decision making process for owners, managers or operators willing to tailor and implement risk management programs or controls containing a specific degree of over protection to their facilities. Also, the cost–effectiveness of additional research may be appraised to devise optimal funds al location for a cost–effective risk management.
Futuristic designs and safety assessments for this kind of structures may resort on the described procedure to calibrate prescribed degrees of over protection and to be consistent with the specific risk management plans considered by owners and operators.
Formulation of annual failure probability for a dam
The selected dam is a rock curtain with concrete face dam for power generation and flood control. It was built between 1991 and 1994 and its height is 187 m, one of the world–highest dams.
Figure 1 shows the typical cross section of the dam.
In the following paragraphs, an application is made of the design of the Aguamilpa dam (Marengo, 2005), specifically the design of the curtain height against the maximum flood, where the aleatory and epistemic uncertainties are treated in a separate way. The limit state F is expressed in terms of the curtain height, Hc , and the maximum level of flood transit, hf .

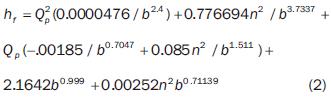
Qp = peak flowrate,
N = manning roughness coefficient,
B = average width of failure surface in the shunt tunnel, numerically estimated from the peak flowrate and the tunnel geometry,
Hc = 37 m.
Equation (2) has been used by CFE (Comisión Federal de Electricidad, the Mexican State Power Energy company,) experts (Marengo, 2005) in previous works.
As an illustration, the aleatory uncertainty is modeled on the variable of the peak flowrate and the Manning roughness coefficient (both are assumed lognormals) and epistemic uncertainty is considered only on the mean value of the peak flowrate (which is also lognormal).
Hypothesis and notation:
a. The coefficient of variation S represents the aleatory uncertainty.
b. The coefficient of variation A measures the epistemic un certainty and represents the error on the calculation of the mean value.
c. For simplicity, it is assumed that there is nobias on the calculation of the means. The formulation may be extended to the case where a systematic bias exists.
As mentioned above, epistemic uncertainty is considered on E[Qp ] associated to imperfection on the calculation of the mean peak flowrate, represented by ΔQp .
In this work, the coefficient of variation ΔQp is taken as 0.3 as obtained through a personal communication (Cano, 2006) for typical peak flowrates in Mexican dams.
Given that there is nobias on E[Qp ] and that this mean value is assumed lognormal, due to the epistemic uncertainty, E[Qp] may be represented:
LNE[Qp] (1,0.3)
From data gathered by CFE (Marengo, 2005), the statistics for Qp and n were computed
Therefore, the aleatory variabilities on Qp and n may be represented
LNQp (9300,0.286)
LNn (0.0326,0.0326)
From the above, the failure probability or reliability index become a random variable, and its calculations acquire the form of a double Monte Carlo simulation loop because, for each trial of the mean value (epistemic uncertainty) of Qp, for example, an additional simulation is required due to the aleatory uncertainty on Qp.
As a result, a histogram may be drawn for either the failure probability or the reliability index.
The same procedure may be applied to the Manning coefficient n al though this is not done in the present work.
Calculation of annual failure probability for a dam
From the limit state in equation (1), the failure probability is given by:

and the Cornell's reliability index is

The calculation procedure to build the annual reliability index histogram may be out lined as follows:
1) Simulate nt mean values of the variable with epistemic uncertainty, say E[Qp]
2) For a simulated value of E[Qp], a trial of the random variables with aleatory uncertainty is performed, in this case, Qp and n.
3) For each trial on the simulation 2), in ner loop, the limit state function F is assessed.
4) It is counted the number of times, nf, when F<0. The ratio nf/nt represents the failure probability conditional to the simulated value of E[Qp]. Also, the conditional reliability index is obtained.
5) The outer simulation loop is performed by repeating the process for all possible mean values of Qp obtaining a series of conditional reliability indices.
The reliability index his to gram is built and the appropriate percentiles are estimated.
Figure 2 shows the histogram of the dam reliability index. The values marked with the red arrows are the probabilities that the dam available reliability value is larger than the target (demand) value pointed by the arrow. It represents the confidence level that the dam (available) reliability may satisfy the specified target value. For the cases where the target is located within the left tail, with a value smaller than the mean, the confidence that the available reliabilities shown under the histogram will meet the target value be comes higher. In the classical interpretation, the percentiles for the available reliabilities (the values pointed by the arrows) would be 1, 5, 10 and 25%. However, the probabilities that the available reliabilities exceed the specified target reliability are 99, 95, 90 and 75%, respectively.

The interpretation of reliability indices and the probabilities in figure 2 is as follows: the distribution of reliability indices mean the variations on the reliability due to the epistemic uncertainty included on the mean peak flowrate. The probability that the dam reliability is over any specified target is the area under the histogram from the target to the end of the histogram.
See table 1 for the mean value and the probabilities that the dam reliability satisfy the potential targets marked with arrows in figure 2.

Acceptable annual reliability for both structures
For several costs of consequences, Cc, (with out un certainties involved), the acceptable annual reliability level may be estimated for dams.
The well–known (Sthal, 1986) acceptable failure probability is obtained from the standard minimization of the expected life–cycle cost:

and
ΔCi, is the cost to reduce the structure failure probability on the order of "e" because of the natural log scale chosen to represent the initial cost. (In this work it is assumed to be 23 million pesos for the dam and 10 million pesos for the break water), and PVF is the present value factor:

where
r is the net annual discount rate (0.08 in this case), and T is the nominal operating life of the structure (200 years for the dam and 1500 years for the break water).
Therefore,

By applying the minimization rule to (8):

the acceptable (or target) annual failure probability is obtained:

and, from (4), the acceptable or target annual reliability index is calculated.
Figure 3 shows the acceptable reliability indices for sev eral costs of consequences and for the dam and breakwater.

For the considered dam, if a Cc of 400 million pesos is considered, the target annual reliability is 2.88, whereas the actual mean value of the dams reliability is 2.93, according to figure 2. These values show that there is a reasonable confidence level that the dam satisfies the target value: i. e., there is a 90% confidence that the dam reliability index is at least 2.87 while its mean value is 2.93.
Therefore, a risk–adverse decision maker would see that the actual mean reliability, 2.93, is slightly over the acceptable or target value, 2.88. In addition, given that the target value 2.88 is located to the left side of the actual mean, there is a confidence greater than 50% that the dam fulfills the acceptable reliability. Actually, the approximate confidence level is 82%. However, if the target reliability would have been 2.96, for example, the designer would have only a 23% confidence level that the reliability of the dam met the target value.
If a higher confidence level about the acceptable value would be desired, the dam should be designed for a higher curtain such that the whole reliability his to gram could shift to the right and then it could produce a larger area to the right side of the acceptable value.
For design of future dams, the acceptable reliability curve may be used to specify the desired reliability level, in addition to a prescribed percentile to be applied to the his to gram that corresponds to the reliability assessment appropriate to the specific type of dam.
The latter calculations may be further extended to generate optimal design criteria for new dams.
Formulation of annual failure probability for a breakwater
In order to calculate the AC, cost for breakwater, a curve of initial cost is developed by as suming that the limit state that governs its design is the stability of the core rock elements that provide protection to the breakwater body against sea waves.
The wave height, H, is considered a random variable and it is assumed to be lognormal. The following statistical data are used, as estimated for the Tampico's breakwater in Mexico. Tampico's break water, built in 1895, is a 1 mile length, 10 m width structure with core protection elements (tetrapods) at its sides. The purpose of this important infrastructure facility is to provide protection to the ships entering the Tampico's port, by reducing the wave's energy.
See figure 4 for a typical cross section of the breakwater.
By considering the statistics of wave height at the site of the structure,
LNH (5,0.2)
Also, epistemic uncertainty is included into the estimation of the mean wave height:
LNE[H] (1,0.3)
By following a similar sequence as for the dam reliability calculation, the initial cost curve is devel oped for several values of E[H]. In this case, ΔC, = 10 million pesos. See figure 5.

The limit state considered for the stability of the core components of the breakwater is:

where
Wa = actual design weight and,
from well–known recommendations (Hudson, 1959), (Iribarren, 1931), (US Army, 1977):

where
ys = the volumetric weight of the core element, in this case, 2.4 tn/m3,
Kd = stability con stant = 21.82,
θ = 45°,
Ss = specific weight of core element = 2.4,
Wa = 32 ton.
Calculation of annual reliability for a breakwater
The histogram of the breakwater annual reliability follows the sequence described for dams. See figure 6 and table 2 for the results.


It is observed, from figure 3, that the break water's annual acceptable (target) reliability is, for a Cc of 1000 million pesos, about 3.1, which is below the actual mean value of the reliability, 3.27. In fact, the confidence level that the available reliability will meet the demand value of 3.1 is 99%. As in the case of the dam, if the acceptable value would have been 3.32, for example, the confidence level that the break water would meet the acceptable value would be only 31%. Also, it is observed that as the target reliability value is lower, the confidence level of the breakwater's available reliability gets higher.
Discussion
The histograms calculated for both the dam and breakwater make transparent and objective the degree of conservatism taken about the decision to over design them and provides a mean to objectively measure this degree.
Also, the effect of the amount of epistemic uncertainty considered on the design process is systematically reflected on the variation range of the reliability index.
For the cases shown, it looks like the structures were designed with a reasonable conservative margin, from the point of view of percentile values. More specifically, the dam reliability shows a moderate extra safety margin, whereas the break water may be considered a very conservative or risk–aversive design. Of course, as may be proposed for the case of the dam, the reliability of any structure may be raised through out structural upgrading.
The formulation may be also used to assess the economic effectiveness of research investment intended to further reduce the epistemic uncertainty and enhance the structural reliability of the facility.
Also, optimal design and maintenance criteria of dams and breakwaters may be developed on the basis of the relationships described. Damage criteria, fragility curves and expected loss functions need to be detailed in order to provide the necessary elements for risk management on the design stage.
Also, alternative repair or damage mitigation schemes may be weighted, from the viewpoint of cost–benefit analysis, to generate optimal strategies.
Conclusions and recommendations
The calculation of the distribution of the reliability index allows room for conservative decisions of operators or managers for the dams and breakwaters. Risk–aversion may be objectively and systematically included on the decision making process to select a design safety level for dams and break waters. The approach may contribute to manage the risk according to the preferences and risk perception of owner and operators.
For the analyzed cases, the mean reliability of the structures exceeds the target value. The dam design has a mean reliability index slightly over the acceptable one (with a confidence level of about 82%) whereas the break water design has a very conservative extra safety margin and may be considered a risk–aversive design (with a confidence level of 99%). If such status is desired for the dam, the results may be used to upgrade the structure and reach a desired confidence level for its reliability index.
The procedure may be adapted, with the corresponding extensions, to consider other probability distributions for the random variables.
Further developments, with adequate estimates of costs of consequences, may contribute to complete the risk analysis on the dam and break water and to support the risk management strategy established by the owners and operators.
Similar formulations may be derived for optimal inspection and maintenance schedules, especially for older dams approaching the end of their nominal operating life and for which the owner desires to extend this life.
Acknowledgements
Data from the dam and breakwater were made available from Mexican Institutions and this support is fully acknowledged.
References
Ang–Alfredo H.S. and Tang W.H. Probability concepts in engineering planning and design. Vol. II—Risk, reliability and decisions. John Wiley and Sons. New York. 1984. [ Links ]
Ang–Alfredo H.S. and De León D. Modeling and analysis of uncer tainties for risk–informed decisions in infrastructures engineering. Journal of Structure and Infrastructure Engineering, 1(1): 19–31. 2005. [ Links ]
Cano S. and José F. Proyectos hidroeléctricos en el corto, mediano y largo plazo en México. Conference given on behalf of the Comisión Federal de Electricidad at the Universidad Autónoma del Estado de México, 2006. [ Links ]
Castillo E., Losada A., Mínguez R., Castillo C. and Baquerizo A. Optimal engineering design method that combines safety factors and failure probabilities: Application to rubble–mound breakwaters. Journal of Waterway, Port, Coastal and Ocean Engineering, ASCE. 130(2):77–88. 2004. [ Links ]
Hudson R.Y. Design of quarry–stone cover layers for rubber–mound breakwaters. WES Research Report 2–2. Vicksburg. 1959. [ Links ]
Iribarren–Cavanilles R. Una fórmula para el cálculo de los diques de escollera. Revista de Obras Públicas, (1). 1931. [ Links ]
Marengo H. Evaluación de riesgos durante la construcción. Seminario sobre evaluación de riesgos en presas. Academia de Ingeniería de México. Acapulco, Gro., 2005. [ Links ]
Melby I.A. and Mlakar P.F. Reliability assessment of breakwaters. Report A440723 from Army engineer waterways experiment station vicksburg ms coastal hydraulics lab. 1997. [ Links ]
Nagao–Takashi, Moriya–Yoichi and Washio, Tomoaki. Optimization of the target failure probabilities for port structures. IX ICASP. San Francisco, CA. 2005. [ Links ]
Sthal B. Reliability engineering and risk analysis. Chapter 5 from Planning and design of fixed offshore plat forms. Edited by McClelland B. and Reifel M.D. Van Nostrand Reinhold Co. New York. 1986. [ Links ]
U.S. ARMY Corps of Engineers. Shore Protection Manual. Published by Coastal Engineering Research Center, Kingman Building. Fort Belvoir, Virginia. 22060 USA. 1977. [ Links ]
About the authors
David De León–Escobedo. He is a civil engineer from the Autonomous University of Tamaulipas, obtained his Ph. D. at UC Irvine in 1996 and is PE in California since 1996. He has worked on wind and seismic engineering and between 1999 and 2005 on the risk–based recommendations for marine platforms and pipe lines for the oil industry. Recently, his research has been focused on the optimal design and maintenance of structures for the electric industry and bridges. Currently, he is the head of the Graduate department of the Engineering School of the Autonomous University of Mexico State where he is professor since 2005. He is member of the National Researchers System since 2006 and has published 8 papers in refereed national and international journals.
Oscar A. Fuentes–Mariles. He was born in Mexico City and made under graduate and graduate studies in the engineering school of the National University Autonomous of Mexico. He is researcher in the Institute of Engineering, UNAM and the National Center of Disasters Prevention. He has been professor and researcher for more than 35 years, mainly on the topics of computational hydraulics, hydrology, marine hydraulics, and general hydraulics. He has been collaborator in more than 150 research projects and has more than 130 scientific and technical publications. He has received the prizes Javier Barros Sierra y Enzo Levi.

