


Serviços Personalizados
Journal
Artigo
 Inglês (pdf)
 Artigo em XML
 Referências do artigo
 Enviar este artigo por email
Indicadores
-
 Citado por SciELO
 -
 Acessos
Links relacionados
-
 Similares em
SciELO
Similares em
SciELO
Compartilhar

 Permalink
Ingeniería, investigación y tecnología
versão On-line ISSN 2594-0732versão impressa ISSN 1405-7743
Ing. invest. y tecnol. vol.9 no.2 Ciudad de México Abr./Jun. 2008
Educación en Ingeniería
Artificial Learning approaches for the next generation web: part II
Métodos de aprendizaje artificial para la siguiente generación del web: parte II
J.R. Gutiérrez–Pulido1, M. Andrade–Aréchiga1, J.R. Herrera–Morales2, M.E. Cabello–Espinosa3, S. Legrand4 and D. Elliman5
1 Faculty of Telematics, University of Colima, México,
E mail: jrgp@ucol.mx, mandrad@ucol.mx
2 SIABUC Dept., University of Colima, México,
E mail: rherrera@ucol.mx
3 Info Systems and Computing Dept, University of Valencia, Spain,
E mail: mcabello@dsic.upv.es
4 Dept of Computer Science, University of Jyväskylä, Finland,
E mail: stelegra@cc.jyu.fi
5 Computer Science and IT School, University of Nottingham, UK
E mail: dge@cs.nott.ac.uk
Recibido: junio de 2005
Aceptado: octubre de 2006
Abstract
In this paper we present an ontology learning tool for assembling and visualizing ontology components from a specific domain for the semantic web. The focal point of the paper is on Self–Organizing Maps (SOM). Some of their properties and the learning algorithm are described. Practical suggestions on how to create good maps are also presented. Related work is then reported. Finally, the relation of SOM with the semantic web ontology creation process, as we envision it, is introduced.
Keywords: Ontology creation process, semantic web approach, data visualization, clustering, self–organizing maps.
Resumen
En este artículo presentamos una herramienta de aprendizaje artificial de ontologías usada para agrupar y visualizar componentes de conocimiento de dominio específico para el Web semántico. El punto principal del artículo son los Mapas Auto–Organizados o por sus siglas en inglés SOM (Self–Organizing Maps). Algunas de sus propiedades y el algoritmo de aprendizaje se describen. Sugerencias prácticas sobre cómo crear estos mapas también se presentan. Después se reportan trabajos relacionados. Finalmente, se presenta la relación de SOM con el proceso de creación de ontologías para Web semántico desde la perspectiva en que la entendemos.
Descriptores: Proceso de creación de ontologías, Web semántico, visualización de datos, agrupamiento, mapas auto–organizados.
Introduction
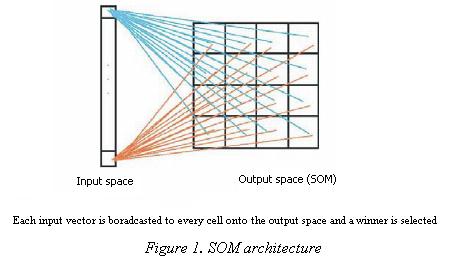
Self–Organizing Maps also know as Kohonen maps or simply of how the brain is thought to work. These networks project data from high–dimensional input space an output space by using unsupervised learning schemes. SOM are regarded as autoassociative, single–layer, recurrent, and highly interconnected networks. In this kind of network, nodes compete for the privilege of learning in a winner take–all fashion and the node with the highest response, the winner, and its nearest neigbourns all adjust their weights accordingly (Figure 1). SOM have capabilities unmatched by other neural networks. They require considerable training, but are potentially very fast, and can work in real time. These systems are trained with examples of patterns that are to be classified and the network is allowed to produce its own output code for the classification. In many other ANN models the output is provided by the user during learning.
By implementing an orderly mapping of a high–dimensional distribution onto a regular low–dimension array of formal neurons, SOM are able to convert complex, non–linear statistical relationships between high–dimensional data into simple geometric relationships onto a low–dimensional display (Kohonen, 1998).
SOM Properties
After a self–organization process, the resulting maps become non–linear projections of the input space onto an output space with the following properties (Ritter and Kohonen, 1989), (Principe, 2000), (Ragus et al., 1999) and (Cheng et al., 2001):
Input space approximation
SOM are able to preserve the structure of the input space relatively well. They compress information while preserving the most important metric relationships of the data. A mapping from a high–dimensional space to a lower–dimensional space will usually distort most distances and only preserve the most important neighbourhood relationships between the data items. Irrelevant details are ignored.
Topology preservation
It means that a continuous change in the parameters of the input data leads to a continuous change onto the output space. For a rigorous mathematical definition of SOM topology preservation see (Villmann, 1999), (Su etal., 2000) and (Principe, 2000).
Density matching
SOM preserve the data densities of the input space reasonably well. In other words, regions with more data points are mapped to larger regions onto the output space. If different input vectors appear with different frequencies, the more frequent input vectors will be mapped to larger regions at the expense of the less frequent input vectors.
Clustering
SOM create abstractions of different types of data from the input dataset and organize the abstractions onto a two–dimensional lattice which can be used to generate an illustrative graphical display of the dataset. This distinguishes SOM from other ANN algorithms and makes them specially suitable for data exploration.
Neighbourhood smoothing
The representation of input patterns are laterally affected by their neighbours. Therefore the features on the SOM are formed not only by the typical input patterns but also by the most probable ones. Some unusual input patterns that appear in the input data are smoothed by others.
Feature representation
Output neurons represent different classes of input patterns and the weight vector of each neuron is the centre of each class. The features in the input space are represented by the distribution of the weight vectors in the output space.
Outlier detection
Outliers are measurements that are classed differently from the main body of input data. It is desirable that outliers do not affect the data analysis. This is the case with SOM. Each outlier affects only one model and its neighbourhood, while the rest of the map remains suitable for inspecting the rest of the data.
The properties above assure that the data from the input space are mapped to a common localized region on the map. This process will also arrange the mutual placement of these regions in such a way as to capture as much of the overall topology of the cluster arrangement as possible.
The algorithm
SOM can be viewed as a model of unsupervised learning and an adaptive knowledge representation scheme. Adaptive means that at each iteration a unique sample is taken into account to update the weight vector of a neighbourhood of neurons. They are also considered an effective software tool for clustering and visualization of high–dimensional data. SOM may be formally described as a nonlinear, ordered, smooth mapping of a high–dimensional space onto a low–dimensional output space. This mapping process proceeds as follows (Kohonen, 2001):
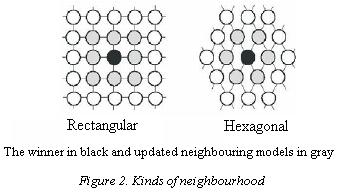
1. Initialize the map parameters, including the length of the models, and the number of unsupervised learning iterations. Initially the weights of the models are usually set to random values. As time passes the weights order themselves across the coordinate system so that they learn to fill the output space. The lattice type of the array can be defined to be rectangular, hexagonal, or even irregular (Figure 2).
2. Present the pattern set to the map, one input vector at a time. An input vector  is associated with each element in the SOM by a parametric vector
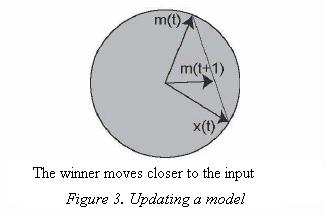
  called a model. Assuming a general distance between x and mi, the counterpart of an input vector on the SOM is defined as the element mc that matches best the input vector. In many applications, the Euclidean distance is used to define it:
The idea of the learning process is that for each sample input vector x, the winner and nearby nodes in a neighbourhood are changed closer to x. As a consequence of the adaptation, the model being updated will produce a higher activation with respect to the input vector x at the next learning iteration.
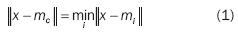
3. Update the models of the neighbourhood (Figure 3). Adaptation of the model vectors take place according to the following equation:

Where  is the discrete time coordinate,
  , is a node, and htci(t) is a neighbourhood function. The latter has a central role as it acts as a smoothing kernel defined over the lattice points. It refers to a neighbourhood Nc, set of nodes, around the winner mc. The average width and form of this function defines the stiffness of the surface to be fitted to the data points. This function may be constant for all the cells in the neighbourhood and zero elsewhere, for instance:

However, a more common neighbourhood kernel that describes a more natural mapping and that is used for this purpose can be written in terms of the Gaussian function:
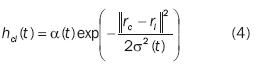
Where rc ,ri  are the locations of the winner and a neighbouring node on the grid, α(t) is the learning rate (0 < α(t) < 1), and σ(t) is the width of the kernel. Both α(t) and σ(t) decrease monotonically. The neighbourhood function, htci (t), will be largest at c= i and htci(t)
 0 with increasing
  .
.
4. Update the learning rate and the neighbourhood size. By reducing both, the learning rate and the neighbourhood size, the learning process will converge towards a stable state.
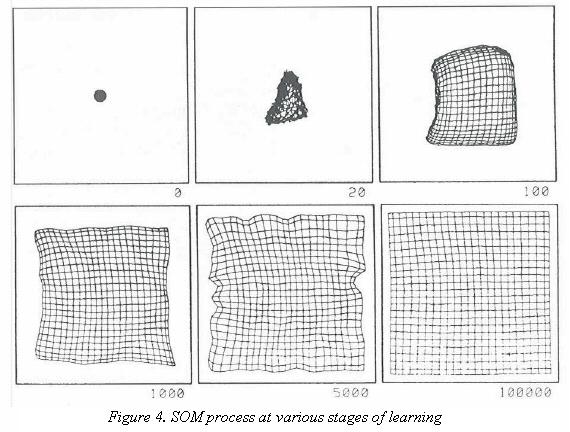
Steps 2–4 are repeated until the number of iterations has been completed. Figure 4, taken from (Kohonen, 2001), shows a SOM network at different stages of the process.
Practical hints
The selection of the process parameters is not sensitive as long as the network is not large, say a few hundred nodes at most. Otherwise, there are some practical considerations that can be observed (Kohonen, 2001) and (Principe, 2000): The SOM–training process consists of two phases: An initial ordering phase and a convergence phase.
The ordering phase
This phase deals with the topological ordering of the weights. A small neighbourhood will cause the map not to be globally ordered. To avoid this, during this phase the neighbourhood function must be defined to start large, covering the full map to allow the nodes responding to similar inputs to be brought together. It can be more that half the diameter of the network to start with. Afterwards the neighbourhood function should shrink linearly, containing the nearest neighbours of the winner, until the neighbourhood size is zero. An accurate function is not important, it can be linear, exponential, or inversely proportional to time t. Linear is a common choice:
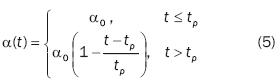
where tp is the time length responsible for a to decay. In decreasing both, the learning rate and the size of the neighbourhood, the input vectors find their correct topological order, and the accuracy of the weights improves.
The convergence phase
This phase is needed for the fine adjustment of the map and is usually longer. The nodes fine–tune to the details of the input distribution. The learning rate and neighbourhood size should be kept small during this phase. All of the input vectors in the training set maybe normalized to unit length.
– How many nodes? The choice of the number of nodes is made experimentally. It will depend on the number of classes we are interested in finding. The number of output nodes affects the accuracy of the mapping. Increasing the number of nodes increases the resolution of the map but also dramatically increases the training time. The number of components in the pattern set has no effect on the number of iteration steps. If only few samples are available, they may be presented to the SOM either cyclically or randomly from the input dataset. The number of weight adjustment steps should be large since learning is a statistical process.
– Large maps. It may be important to minimize the total learning time. Then, selecting an optimal learning rate may be crucial. Effective choices for these functions and their parameters have so far been determined only experimentally.
– Map initialization. Initially unordered vectors will be ordered in the long run, in usual applications in a few hundred initial steps. This does not mean that random initialization is the best or fastest policy. By using PCA, linear initialization has been used successfully. In this case then it is possible to start the training directly with the convergence phase, the learning rate small, and the neighbourhood size close to its final values.
Related work
In this section a number of existing systems that use SOM (Figure 5) and that are relevant to our research are outlined.
– Rauber and Merkl (1999) present a digital library system based on SOM. SOMLib structures a document collection similar to the organization of real–world libraries. Independent SOM are integrated into a single map to model the creation of a meta–library. Maps can be integrated to form a high–level library. This allows users to choose sections of the library and create personal libraries.
– Guerrero et al. (2002) classify documents from a bibliographic database. They explore the possibilities that SOM offer to the information retrieval area. They have also described (Guerrero and Anegon, 2001) a fuzzification module to reduce the dimensionality of the input vector spaces.
– Ultsch presents (Ultsch, 1999) a system that has been applied successfully for knowledge discovery on a number of applications. This hybrid system consists of a graphical visualization method and a machine learning module that generates rules from the neural network (Ultsch et al., 1995). The system learns from examples that it has been given and with the extracted knowledge it is possible to diagnose new unknown cases from the dataset (Ultsch, 1992).
– One of the best known systems in this context is WEBSOM. Kaski et al. (1998) present their approach to document classification. This approach provides a graphical display of the map and an overview of the document collection facilitating interactive browsing. Kohonen etal. (2000) describe a scaling up approach for WEBSOM to be able to deal with large amounts of high dimensional data. Lagus et al have used it (1999) for data mining, and Lagus (2002) for information retrieval. WEBSOM is a document organization, searching and browsing system. The document map is presented as a series of HTML pages facilitating exploration.
A specified number of best–matching points are marked with a symbol that can be used as starting points for browsing.
There is also a series of conferences devoted to the theory and applications of SOM, namely: WSOM071 WSOM052 WSOM033, WSOM014, WSOM995, WSOM976.
Discussion
For the semantic web to become a reality, a number of frameworks have to be built to support the artificial learning activities involved in the process. These activities as we envision this process, are as follow: Gathering, Extraction, Organization, Merging, Refinement, and Retrieval.
SOM are a promising clustering and visualization tool that help the knowledge engineer to identify ontology components from the domain (the extraction phase) we are studying (Pulido et al., 2006). Further research avenues we are working on involve the use of hybrid systems in such a way that by combining clustering techniques with the already trained feature vectors we may refine the classification of the knowledge components from the domain, eg (Quan et al., 2004), (Ehrig and Staab, 2004), (Maedche and Zacharias, 2002), (Maedche and Staab, 2001).
Some other ontology tools have to be used to organize the knowledge extracted from the domain, which by means of ontology languages (Pulido et al., 2006) can be embedded into digital archives, eg web pages. Software agents will later use that knowledge and carry out reasoning tasks on our behalf, the ultimate semantic web application.
References
Cheng G. et al. Interactive knowledge discovery through self–organizing feature maps. In: Int. Neural Network Society Annual Meeting. 1994. Pp. 430–434. [ Links ]
Ehrig M. and Staab S. QOM–Quick Ontology Mapping. In: The Semantic Web–ISWC 2004, Third International Semantic Web Conference, (McIlraith S. et al.), Vol. 3298 of LNCS, pp. 683–697, Springer, 2004. [ Links ]
Pulido J.R.G. et al. Identifying ontology components from digital archives for the semantic web. In: IASTED Advances in Computer Science and Technology (ACST), 2006. CD edition. [ Links ]
Guerrero V. and Anegon F. Reduction of the dimension of a document space using the fuzzified output of a kohonen network. J. of the American Soc. for Info. Science and Technology, 52(14): 1234–1241, 2001. [ Links ]
Guerrero V. et al. Document organization using Kohonen's algorithm. Information Processing and Management, 38:79–89, 2002. [ Links ]
Kaski S. et al. WEBSOM–Self–organizing maps of document collections. Neurocomputing, 6:101–117, 1998. [ Links ]
Kohonen T. The self–organizing map. Neurocomputing, 21:1–6, 1998. [ Links ]
Kohonen T. Self–Organizing Maps. Information Sciences Series. 3rd edition, Berlin, Springer–Verlag, 2001. [ Links ]
Kohonen T. et al. Self organization of a massive text document collection. IEEE Trans. on Neural Networks, 11(3):574–585, 2000. [ Links ]
Lagus K. Text retrieval using self–organized document maps. Neural Processing Letters, 15: 21–29, 2002. [ Links ]
Lagus K. et al. WEBSOM for textual data mining. Artificial Intelligence Review, 3(5/6):345–364, 1999. [ Links ]
Maedche A. and Staab S. Ontology learning for the Semantic Web. IEEE Intelligent Systems, 16(2): 72–79, 2001. [ Links ]
Maedche A. and Zacharias V. Clustering ontology–based metadata in the semantic web. In: Principles of Data Mining and Knowledge Discovery: 6th European Conference, (Elomaa T. et al.), PKDD 2002, Vol. 2431 of LNCS, pp. 348–360, Springer, 2002. [ Links ]
Principe J. Neural and adaptive systems, fundamentals through simulations, chapter 7. Wiley, USA, 2000. [ Links ]
Quan T. et al. Automatic generation of ontology of scholarly semantic web. In: The Semantic Web ISWC 2004: Third International Semantic Web Conference, (McIlraith S. et al.), Vol. 3298 of LNCS, pp.726–740, Springer, 2004. [ Links ]
Rauber A. and Merkl D. The SOMLib digital library system. LNCS, 1696:323–342, 1999. [ Links ]
Ritter H. and Kohonen T. Self–organizing semantic maps. Biological Cybernetics, 61:241–254, 1989. [ Links ]
Su M. et al. A novel measure for quantifying the topology preservation of selforganizing feature maps. Neural Processing Letters, 15:137–145, 2002. [ Links ]
Pulido J.R.G. et al. Ontology languages for the semantic web: A never completely updated review. Knowledge–Based Systems. Elsevier, (19) 7:489–497, 2006. [ Links ]
Pulido J.R.G. et al., In the quest of specific–domain ontology components for the semantic web in: 6th. Intl workshop on Self–Organizing Maps, (WSOMO7). Bielefeld, Germany. [ Links ]
Ultsch A. Knowledge acquisition with self–organizing neural networks. In: International Conference on Artificial Neural Networks, Berlin, Springer–Verlag, pp. 735–739, 1992. [ Links ]
Ultsch A. Data mining and knowledge discovery with emergent self–organizing maps for multi–variate time series. In: Elsevier Sci. (Oja E. and Kaski S.) Kohonen Maps, pp 33–45, Amsterdam, 1999. [ Links ]
Ultsch A. et al. Integration of neural networks and knowledge–based systems in medicine. In: Lecture Notes in Artificial Intelligence, pp. 425–426, 1995. [ Links ]
Villmann Th. Topology preservation in self–organizing maps. In: Elsevier Sci. (Oja E. and Kaski S.), Kohonen maps, pp. 279–292. Amsterdam, 1999. [ Links ]
About the authors
Jorge Rafael Gutiérrez–Pulido. Information Systems Laboratory, Faculty of Telematics, Colima University, México. He holds a PhD in Computer Science (2004) from The University of Nottingham, UK, a MSc in Telematics (1999), and a BA in Informatics (1995), both from The University of Colima, México. Dr Pulido has written a number of journal papers, conference papers, and books on the following topics: The semantic web, ontologies, ontology learning, intelligent data mining, knowledge discovery, self–organizing maps, internet computing, semantic information retrieval, and data visualization.
María Andrade–Aréchiga. Faculty of Telematics, Colima University, México. She holds a MA in Education (1997), from ITESM, and a BSc in Communications and Electronics (1993), from The University of Colima, both in México. She is currently doing a PhD in Computer Science at CICESE, México. Research interests: Learning objects for mathematics, computer–based learning and evaluation systems, human–computer interaction and neural networks.
José Román Herrera–Morales. SIABUC Department, Colima University, México. He holds a MSc in Telematics (1999), and a BSc in Computer Systems (1997), both from The University of Colima, México. Research interests: Web technologies, information systems, digital libraries, information storage and retrieval, interfaces design and usability.
María Eugenia Cabello–Espinosa. University Politechnic of Valencia, Valencia, Spain. She holds a BA in Physics from UNAM (1994), and MSc in Computer Science from Arturo Rosenbleuth Fundation (2000), both from Mexico. Currently she is doing a PhD in Declarative Programming and Programming Engineering at The University Politecnic of Valencia in Spain. Research interests: Knowledge–based systems, diagnostic systems, and software architecture based in components and aspects oriented.
Steve Legrand. Computer and Mathematical Sciences (CoMaS), Jyväskylä University, Finland. He holds an MSc from Jyväskylä University, Finland, a Post–graduate diploma in applied computing from University of Central Queensland, Australia, and a BSc from Griffith University, Australia. Currently he is doing a PhD in Jyväskylä University, Finland. Research interests: The semantic web, dissambiguation, word sense discrimination, ontology, and natural language processing.
Dave Elliman. Image processing & interpretation research group leader, School of Computer Science and IT (CSiT), Nottingham University, UK. Research interests: Pattern recognition, machine vision, agent–based architectures for problem solving and searching, neural networks, constraint–based reasoning, steganography and security especially relating to document servers, and cognitive architectures and emotion.

