


Services on Demand
Journal
Article
 English (pdf)
 Article in xml format
 Article references
 Send this article by e-mail
Indicators
-
 Cited by SciELO
 -
 Access statistics
Related links
-
 Similars in
SciELO
Similars in
SciELO
Share

 Permalink
Ingeniería, investigación y tecnología
On-line version ISSN 2594-0732Print version ISSN 1405-7743
Ing. invest. y tecnol. vol.9 n.1 Ciudad de México Jan./Mar. 2008
Estudios e investigaciones recientes
Novel measurement–based indoor cellular radio system design
Metodología para el diseño de sistemas de radio celulares usando mediciones en ambientes interiores
A. Aragón–Zavala
ITESM Campus Querétaro, Departamento de Electrónica
Santiago de Querétaro, Qro.
E–mail: aaragon@itesm.mx
Recibido: marzo de 2006
Aceptado: junio de 2007
Abstract
A scaleable, measurement–based radio methodology has been created to use for the design, planing and optimisation of in door cellular radio systems. The development of this measurement–based methodology was performed having in mind that measurements are of ten required to valiate radio coverage in a building. Therefore, the concept of using care fully calibrated measurements to design and optimise a system is feasible since these measurements can easily be obtained prior to system deployment if appropriate guidelines and recommendations are elaborated for conducting these measurements. This is applicable for 2G and 3G systems alike, and interference management for the latter makes this requirement even more critical when planning an in door network. This paper presents in de tail this methodology, followed by examples of its use in real scenarios.
Key words: In door propagation, cellular radio, mobile communications, capacity planning, wireless communications, in–building radio design.
Resumen
Una metodología escalable y basada en mediciones de radio, ha sido creada para el diseño, la planeación y la optimización de sistemas de radio celulares para interiores. El desarrollo de esta metodología basada en mediciones de radio fue elaborada teniendo en mente que se requieren mediciones para validar la cobertura de señal en un edificio. Por lo tanto, el concepto de utilizar medicinas cuidadosamente calibradas para el diseño y la optimización de un sistema celular es posible, ya que estas mediciones pueden ser obtenidas fácilmente antes de realizar el despliegue del sistema, siempre y cuando existan recomendaciones y guías para llevar a cabo las mismas. Esto es aplicable a sistemas de segunda generación 2G y tercera generación 3G por igual, siendo la administración de interferencia para este último la que hace este requerimiento, aún más crítico, cuando se planea una red en interiores. Este artículo presenta a detalle esta metodología, seguido de ejemplos de su uso en escenarios reales.
Descriptores: Propagación en interiores, telefonía celular, comunicaciones móviles, planeación de capacidad, comunicaciones inalámbricas, diseño de radio en interiores.
Introduction
Cellular networks of the past have been based mostly around coverage from macrocells. These provide coverage to both external locations, and to indoor locations via penetration through building walls. Macrocellular networks are planned using a well–established process, evolved over at least two decades, based around computerised planning tools which are closely integrated into operators' business and are produced by large and well–established vendors.
Increasingly there is a focus by operators on providing in–building coverage using in–building base stations, which are better known as "pico–cells", with the new and exciting services offered inside buildings (Wi–Max, Wi–Fi, etc). Besides, hot–spots of high capacity in locations such as airports, railway stations and shopping malls are most efficiently served using in–building cells. This maximises the use of expensive spectral resources, particularly for 3G systems.
At present, there is no established methodology for planning in–building systems. The conventional planning process requires intensive hands–on effort by experienced radio planners, who are in scarce supply. Besides, for in–building environments, conventional planning tools using standard propagation models require an excessive amount of detail of the building, which increases the processing and data capture time, making the prediction exercise excessively expensive and time–consuming. Also the accuracy of conventional planning tools and propagation models is not appropriate for in–building environments, and the need to investigate its validity for such scenarios is critical if accurate systems are to be deployed.
In order to meet the increased demand, operators are increasingly outsourcing in–building design and often require a turnkey process, which delivers a system to meet specified service and coverage goals. Therefore, a scaleable, measurement–based radio methodology has been created to use for the design, planning and optimisation of indoor systems.
The development of this measurement–based methodology was performed having in mind that measurements are often required to validate radio coverage in a building. Therefore, the concept of using carefully calibrated measurements to design and optimise a system is feasible since these measurements can easily be obtained prior to system deployment if appropriate guidelines and recommendations are elaborated for conducting these measurements. This is applicable for 2G and 3G systems alike, and interference management for the latter makes this requirement even more critical when planning an indoor network.
It is demonstrated in this paper that the measurement–based approach proposed provides more efficient, cost–effective and accurate indoor solutions than conventional methods of designing in–building systems. Extensive research was conducted in various key stages, which confirmed the core of the algorithms developed, to demonstrate an improvement in performance achieved with this approach. References are provided to extend this research for the interested reader, to further investigations.
Design methodology
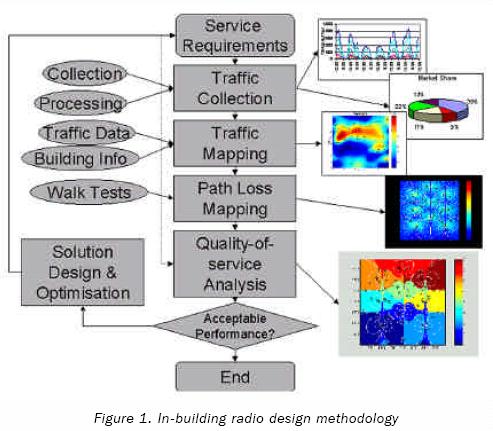
A block diagram for the proposed methodology is shown in figure 1. From a set of well–defined coverage and capacity requirements, existing cellular traffic is collected from surrounding and neighbouring macrocells, to determine the current traffic per user in the area. A traffic mapping exercise is performed next, to distribute mobile users across the building to identify densely–populated spaces, for which more resources (channels) are required. However, cell areas need to be delimited. Hence, a path loss mapping process needs to be performed, for which path loss predictions are needed. Once this has been completed, and having delimited the cell area, a quality–of–service (QoS) analysis is done, to assign channels according to capacity demands as produced by the traffic maps. A system optimisation is finally executed, for which the number of required antennas and power per antenna is minimised, to maximise coverage and reduce leakage. All the stages in the process are fully described in the following sections.
Service requirements
An indoor cellular wireless system is based on a set of requirements which should be met if the system is to deliver the QoS for each of the offered services. These requirements are normally specified in signal strength or path loss levels above or below a certain threshold, at various places inside and outside the building, which are taken as targets at which the design should aim for.
Coverage
Coverage is defined as the amount of signal strength level which should be present in a cellular wireless system to meet a certain QoS for a particular service. Cellular operators often define indoor coverage requirements as a minimum signal strength level within at least a percentile of an area of the building; e.g. at least –84 dBm over 90% of the coverage area.
Leakage
In addition to coverage requirements, signal strength should be maintained at restricted levels to avoid signal spillage outside the building. This signal spillage is known as leakage, and it is often desired to be kept at a minimum level over a percentile of an area outside the building; e.g. no greater than –95 dBm over 95% of the leakage area.
Capacity
The capacity of a network is often expressed as a percentile of maximum blocking probability or minimum grade of service. Blocking occurs as a result of a user attempting to make a phone call without available channels in the cell. On the other hand, the grade of service (GOS) is a measure of the ability of a user to access a trunked system during the busiest hour. The busy hour is based upon customer demand at the busiest hour during a week, month or year. The GOS is therefore a benchmark used to define the desired performance of a particular trunked system by specifying a desired likelihood of a user obtaining channel access given a specific number of channels available in the system. It is part of the system design process to estimate the maximum required capacity and to allocate the proper number of channels in order to meet the GOS.
Capacity planning
A method to estimate and accurately distribute the building population and traffic is presented and explained in this section. This technique makes use of traffic measurements to determine traffic on a per–existing–cell basis; these measurements are then used with characteristic mobility models of the population of the building in consideration, similar to those presented in (Kim, 2000) for handover statistics, to produce traffic maps, which provide valuable information as how this traffic is distributed across the building. Finally, the required number of channels in each zone of interest is then calculated for both circuitswitched and packet–switched data, as part of a quality–of–service analysis exercise.
Traffic collection
Existing cellular traffic needs to be collected on site, with a traffic monitoring system (TMS) manufactured by Grayson Wireless (Grayson). This allows the knowledge of existing serving and neighbouring cells, as well as an estimate of existing cellular traffic in the area around the building, on a per–cell basis. The output of this traffic monitoring exercise, apart from being used for benchmarking amongst cellular operators, is used as an input for the traffic mapping, which follows. A more detailed explanation of the equipment used for traffic collection and the methodology can be found in (Aragon, 2003).
Traffic mapping
Having determined the overall levels of current traffic, it is necessary for system design to have some knowledge of where the traffic is located.
Converting traffic into spatial form is known as traffic mapping (Aragon, 2005). Traffic mapping indicates areas where people are more likely to congregate in the building, defined as most populated areas. From the previous section, traffic is collected on a per–cell basis, but knowledge of how this population is distributed around the b uilding is essential if the system is to be sectorised, i.e., allocate channels according to traffic demand per area. As every location may have specific traffic requirements, which may differ from those of a different location within the same building, traffic mapping is used to quantitatively assign the appropriate number of channels to each area, making a more efficient use of the limited spectrum, in GSM networks, and allocating more accurate noise rise and cell loading figures for 3G systems.
Several mobility model schemes have been investigated and reported in the literature. Dolil et al. (1989) studied a one–dimensional mobility problem for highway macrocells, and Guerin (1987) and Hong and Rappaport (1986) modelled mobility and traffic with random direction motions in two–dimensional environments, by examining the channel holding time. Foschini et al. (1993) defined the parameter called mobility concerned with mobility, and suggested a traffic model for a given mobility. Meier Hellstern and Alonso (1992) analysed mobility using a fluid flow model under the assumption that users randomly move. Kim et al. (2000) modelled 3–D user movements including vertical motions through staircases and elevators in indoor environments, in order to estimate the number of handovers, proposing a blocking probability model with mobility.
Our model assumes a random distribution of users within the building, but with well–defined routes for users, in a similar way to that presented by Bregenzer (Bregenzer, 1996), but having specified user categories, spaces and allocated dwell–times to each. In the proposed model, specific dwell–times in each of the areas where a user is located are defined as input parameters for the model, and the model is tuned using the overall levels of current traffic reported in the traffic measurements.
A flow chart describing the traffic mapping process is shown in figure 2. Although the process is often designed specifically for a particular type of building in a certain environment, a general model is described here, which can be applied to any type of building.
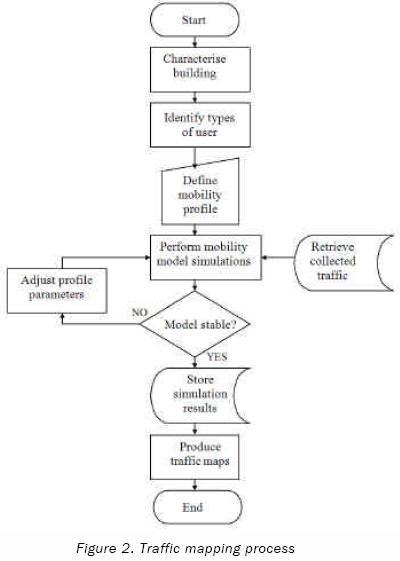
A mobility profile for the building is created, which is used later to simulate the mobility of users within the building. This profile is comprised of the following components: categories of user, spaces, routes and dwell times. A classification of the type of user is used to determine different types of population, which may follow a mobility pattern. The building in consideration is partitioned into spaces, which are defined as the minimum area over which traffic density can be considered constant. Each category of user defined in the profile is modelled to follow a certain mobility pattern. Therefore, all routes, which may be followed by users of each type, must be defined. A dwell time in the mobility model is defined as the amount of time a category of user spends in a space, without involving any motion.
Mobility model simulations are then performed for the building in consideration. The simulation parameters are given by the user, which define the type of building and scenario in which the simulations are taking place. These parameters are typically: peak hours for arrivals and departures, number of users in events, simulation window, number of spaces, number of events defined as arrivals and departures.
A schedule of events normally needs to be entered in the simulations, which indicate the order of events that determines user arrivals and departures. This event schedule can be assumed to follow a Gaussian distribution, from our experience in hundreds of observations in typical densely–populated buildings such as airports, as follows:
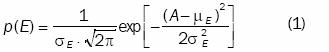
where p(E) is the probability that an event occurs within a specific timeslot of the simulation window; E represent an event, which can be an arrival or a departure; µE is the peak hour for arrivals or departures, in minutes; and σE is the standard deviation of events, either arrivals or departures, in minutes.
Once the event schedule has been defined, the users involved in each event need to be simulated in motion. Therefore, the rate at which each user is entering or leaving the building at each event needs to be modelled. A Gaussian distribution was assumed here, as for the event schedule, as follows:
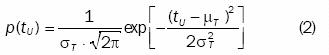
In (2), p(tu) is the probability that a user arrives to or departs from the building during the scheduled event timeslot at an average time interval; tu is the time interval between two users arriving or departing the building at an scheduled event, in seconds; µT is the mean time interval for a user involved in an event to arrive to or depart from the building, in seconds; and σT is the standard deviation of such time interval, in seconds.
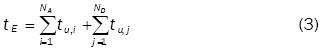
The total latency for an event, either arrival or departure, is defined as tE (seconds) and is given by:
Routes are assigned to each user depending on the classification that has been given to that specific user in the mobility profile. The route is selected from a pool, defined as part of the mobility profile, which provides alternatives for a specific type of user, representing a more realistic simulation scenario. The probability that a user of a well–defined user category selects a route from the pool is assumed to follow a uniform distribution:
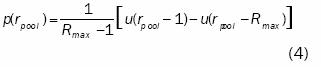
rpool is the route number from the pool; Rmax is the number of routes in the pool for a specific category of user; and u(.) is the unit step function. Equation (4) implies that there is at least one route in the pool and that the user has an equal probability of selecting any route from the pool.
A mobility matrix  is constructed for each user j of type i, as shown in table 1. It represents the latency for a particular user at each of the spaces conforming the mobility model. n takes binary values (0,1) at each matrix element, for space s and timeslot t. For example, if the user is spending a timeslot in space 2, then n2,1 =1, and if the latency of the user at space 2 exceeds the duration of timeslot 1, e.g. three timeslots, then: n2,2 = 1, n2,3 = 1, and n2,4 = n2,5 = n2,w = 0 .
After computing the mobility matrices for each user within all categories, the total building population  is calculated, and is given by:
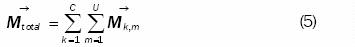
C is the number of user categories, and U is the total number of users in a category.
Equation (5) gives the totals of building population in matrix format, for the entire simulation window timeslots. However, only the average building population over the busy hour is required. Therefore, model tuning is required for both statistical stability and for extracting from the traffic measurements the occurrence in reality of the busy hour peak. It is often performed by adjusting some of the parameters of the mobility profile, such as: increasing or decreasing ts for some of all spaces; re–defining some routes; increasing the velocity of users vuser in each event; or adjusting the event schedule.
Traffic maps are produced by merging the mobility model simulation results of average building population over busy hour and measured traffic. As the TMS reports traffic in intervals of one hour, the total measured busy–hour traffic is extracted from measurements as follows:

TBH is the total busy–hour traffic, in Erlangs; T1 is the traffic during the first hour of the simulation window, in Erlangs; T2 is the traffic during the second hour of the simulation window, in Erlangs; TW is the traffic during the w–th hour of the simulation window, in Erlangs; and max(.) is the maximum of all of the parameters enclosed within brackets.
The total measured busy–hour traffic is then combined with average busy–hour building population figures given by the mobility model, making sure both are extracted using the busy hour, as explained in (Aragon, 2005).
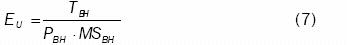
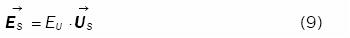
The traffic per user EU in Erlangs/user is calculated as the ratio of total busy–hour measured traffic TBH , in Erlangs, to average busy–hour building population PBH scaled by the market share in the busy hour MSBH, given as a fraction, as indicated in (7):
The number of mobile phone users per space vector  is then equal to busy–hour building population vector
 in number of users, scaled by the market share, MSBH as a fraction, given by
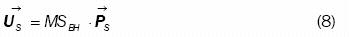
Therefore, the wanted traffic per space vector  , in Erlangs, is the product of the users p space times the previously calculated traffic per user EU , as presented in (9):
Path loss mapping
Capacity planning is just part of the design problem for indoor scenarios, since cell boundaries still need to be delimited for efficient network operation. Traffic mapping has provided cellular traffic per space, but how many spaces should be included per cell? Where should indoor antennas be placed for this purpose? All these questions are addressed in the subsequent stage of the in–building design process we have designed: path loss mapping.
The feasibility of computing predictions from measurements has been validated and proved in (Aragon, 2000), for prediction points located along the measurement route. However, it is often difficult to measure in all the possible areas in a building, and hence accurate mechanisms to predict path loss even at points where measurements are not available is required. Path loss mapping is capable of extending path loss map predictions from measurements to the entire building, and not only confined to the measurement route.
Current approaches to path loss prediction
In–building propagation models at present are mostly based on two approaches. The first approach is to conduct extensive measurements over various types of buildings to extract model parameters such as wall and floor losses, and determine the influence of different materials at various frequencies (Keenan, 1991), (COST, 1998), (ITU, 1997). The second approach is to construct ray–tracing algorithms to replicate the phenomena of multipath over a certain indoor scenario, simulating the most significant ray paths between transmitter and receiver (Klepal, 2001), (Wolfe, 1999), (Tarng, 1997).
In both schemes, various disadvantages are present. If indoor modelling is based on measurements conducted on various types of buildings and different materials, it is difficult to extrapolate those results to other "similar" buildings, as the in–building environment is highly variable, with specific clutter and materials associated with each type of building. On the other hand, if ray–tracing algorithms are employed, the complexity and the amount of detail required by such algorithms to perform best becomes prohibitively expensive and time consuming, with little improvement in the prediction results. An accuracy evaluation analysis (Aragon, 2006) has been performed to compare our measurement–based path loss prediction method (Saunders, 2002) and a widelyused indoor empirical model (Keenan, 1991), where a clear improvement in accuracy is obtained by the former–our measurementbased model shows an improvement of 3.8 dB in standard deviation of the error of measurements vs. predictions, which is far beyond other existing path loss prediction models, as discussed in (Aragon, 2006), even when compared with a measurement–tuned Keenan Motley indoor model.
Measurement–based path loss prediction
In seeking a way to improve our confidence in our in–building designs, we investigated the potential of a process which we had previously developed for application to macrocellular systems. This process, known as MbP (Saunders, 2002) creates an optimum combination of measurements and simple models in order to predict complete system coverage performance. Predictions are made over the whole area of interest, even though the measurements are only limited in extent, with each measurement point influencing every prediction point to varying extents. We found that we could apply a modified version of the MbP process to the in–building environment, yielding very accurate predictions.
The overall MbP scheme is illustrated in figure 3. In the first phase of the MbP scheme, measured data, which include accurate measurement locations and signal strength levels, are carefully calibrated and filtered. These measurements are carried out with the use of an RF receiver, an external omnidirectional antenna, proprietary data collection software installed in a handheld device and some sort of navigation and positioning system.
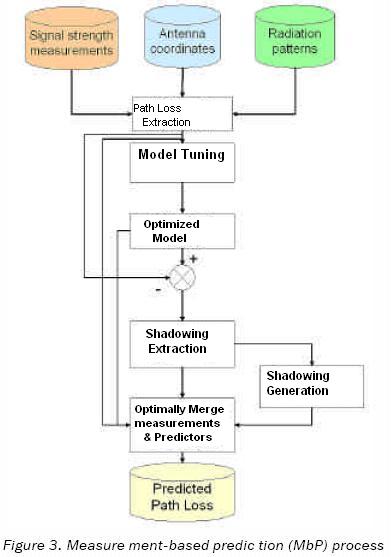
The above mentioned signal strength measurements should be filtered prior to using them in MbP. Filtering removes samples that are either beyond the noise floor of the receiver or clipped due to very strong field strength at short distances from a strong transmitter antenna to the receiver.
Site information such as antenna coordinates and radiation patterns is required for path loss extraction. These parameters along with the signal strength measurements are processed to yield measurements of path loss against location. This loss is made up of two components. The first is a distancedependent r component, resulting from the bulk characteristics of the propagation medium, known as median path loss L50 and given by:

For path loss extraction, the effects of antenna radiation pattern are removed. For this, manufacturer's radiation patterns are used, often provided in two planes (azimuth and elevation). However, since three–dimensional (3–D) patterns are required for prediction work, a method to estimate these 3–D patterns having only two available planes was investigated and implemented (Aragon, 2005).
Constants k1 and k2 in equation (10) are tuned using the signal strength measurements described before, to obtain an optimised model, which often represents a best–fit model for the collected data. The path loss exponent n is determined from this tuning process.
The second component for the path loss depends on the characteristics of the nearby propagation environment (local clutter). Subtracting the distance–dependent part of equation (10) from the total loss L yields the latter component, known as shadowing or slow fading Ls, and given by:

First– (mean, standard deviation, probability density function) and second–order (auto–correlation and cross–correlation) statistics of the shadowing are then analysed to yield repre– sentative parameters of the test area.
The derived shadowing parameters are used to generate a set of shadowing predictions for the whole area of interest, mapped onto each prediction point. The result is added to the distance–dependent path loss predictions produced by the propagation model for the area. The outcome has then very similar characteristics to measurements which would have been produced not only at the measurement route but over the whole prediction area, as is demonstrated in this paper, without the need for detailed building geometry, as with raytracing algorithms.
The benefits of MbP have been exploited for various technologies, and have been especially significant in the design of UMTS indoor systems to control and manage interference effectively, as described in (Aragon, 2002) and (Gatzoulis, 2003). Therefore, path loss maps are constructed using MbP predictions across the coverage area, for each antenna. The selection of an optimum arrangement and combination of antennas to produce the desired coverage requirement is preformed in the system optimisation stage, described later in this paper.
Quality–of–Service (QoS) analysis
One of the most useful applications of the traffic mapping process, and perhaps the biggest motivation for its implementation, is the use of the traffic map information to produce zones within the building. These indoor zones are in essence similar to sectors in a macrocell environment. The distinction is that sectors are delimited using antenna radiation patterns primarily, whilst zones are separated by choosing groups of antennas which are isolated by virtue of in–building penetration losses. An example of the selection of these zones is given in figure 4.
If the proposed indoor cell is deployed in an omnidirectional configuration, as shown in figure 4a, all the available carriers will be used in all the cell area, hence not making the most efficient use of the allocated capacity, as it is likely that some areas be more congested than others. As shown in figure 4b, this can be overcome by splitting the carriers proportionally in various zones, which will have different traffic requirements. The amount of carriers per zone is determined by the quality–of–service analysis, which is described as follows.
Circuit–switched services
From the traffic mapping, traffic maps are produced, which contain the number of Erlangs per space for voice services. This can be translated into a required number of channels needed to support a given number of users to a certain grade of service by using the well–known Erlang–B formula:
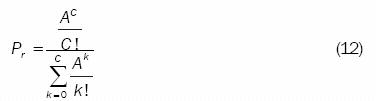
where Pr is the probability that a call is rejected or blocked; A is the total offered traffic in Erlangs and C is the total number of available channels.
Packet–switched services
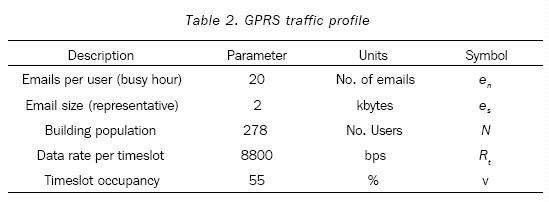
For packet–switched services (data), the Erlang–B formula stated in (12) cannot be applied directly, as the packets of data are not transmitted using a dedicated channel in the busyhour. Assume a traffic profile for data as defined in table 2. The data rate per timeslot has been assumed to be 8800 bits per second, with timeslot occupancy of 55% half of the timeslot is being used transmitting data packets. 278 are assumed in the cell, each sending an average of 20 emails of 2 kbytes of size each.
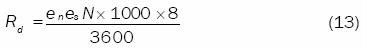
The data rate Rd , in bits per second is then given by:
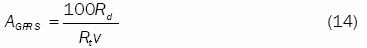
Therefore, the total estimated GPRS offered traffic in ErlangsAGPRS is approximated by:
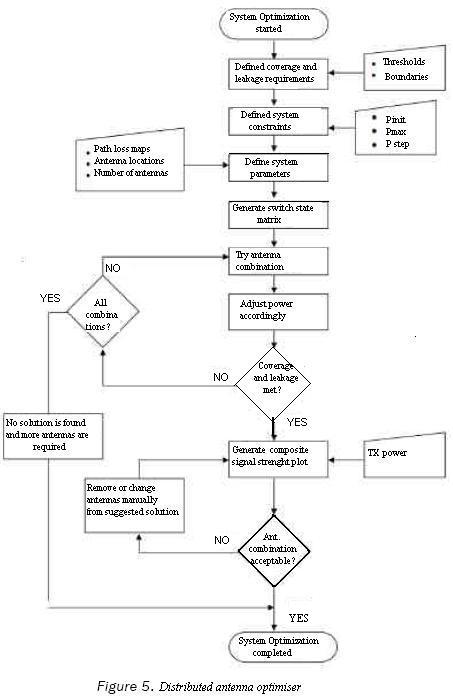
System optimisation
The approach described after the path loss mapping and a detailed QoS analysis is neither the most cost–effective nor the optimum in terms of performance. Planning has been based to this point on placing antennas in excess of those typically required to guarantee the minimum coverage level and to obtain as many measurements as possible, following an initial survey to determine suitable antenna locations. Some of these antennas may not be contributing significantly to the composite coverage of the distributed antenna system, spilling power in excess outside the building. Hence, further action is required to minimise these effects on the final solution, as well as ensuring that once the system has been deployed, optimum performance is guaranteed.
The Distributed Antenna Optimiser (DAO) is a system that was designed and implemented to find an optimum arrangement for a distributed antenna system to meet defined coverage and leakage objectives, as explained in (Aragon, 2004). This process is performed automatically, allowing the radio designer to decide which antenna combination is the most feasible for installation and deployment. A clear definition of these coverage and leakage objectives as well as the areas or contours in which they apply should be made prior to optimising the system, as part of the indoor system requirements. Radio testing is often used after building the network to validate that radio coverage in the site is sufficient, or to adjust various parameters during optimisation to comply with the system coverage requirements.
As described in (Aragon, 2004), the DAO attempts to find an optimum arrangement of antennas based on well–defined coverage and leakage requirements. A switch state matrix is produced, which contains all the possible 2N–1 combinations of the Nantennas.
This matrix is then sorted in ascending order by total number of antennas. The composite power per combination of antennas according to the rules specified by the switch state matrix is computed. CDF's (Cumulative Distribution Function) for coverage and leakage are then calculated for this composite signal strength variable, which are then compared to the coverage and leakage targets specified before, and various flags are set or cleared depending on these comparisons.
The composite coverage Pcomp in dBm at each receiver location in the areas of interest is:
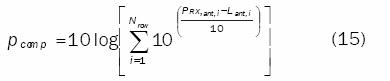
This composite power is computed for the Nr antennas in the switch state matrix row, a received power PRX, ant,i in dBm for the i–th antenna in the row, and an extracted path loss Lant,i in dB for that antenna. This computation is performed over the whole grid covered by the path loss prediction maps. A flow chart for the optimisation process is shown in figure 5.
Case studies
The proposed indoor measurement–based de– sign methodology shown in this paper has been applied for over one hundred buildings across the UK and Europe, including the Netherlands and Belgium, for both GSM and UMTS networks, for which a slightly modified version for system optimisation has been produced (Datta, 2003). The applications range from corporate office buildings to international airports, such as London Heathrow, London Gatwick and London Stansted, amongst others.
Due to the confidentiality involved in the indoor designs which have been produced for cellular operators and building owners alike, we cannot publish specific details of the designs involved. However, for the sake of illustrating the results produced by our method, we will present a case study for Glasgow International Airport, one of the largest airports in the UK, for which a full indoor design was implemented and deployed.
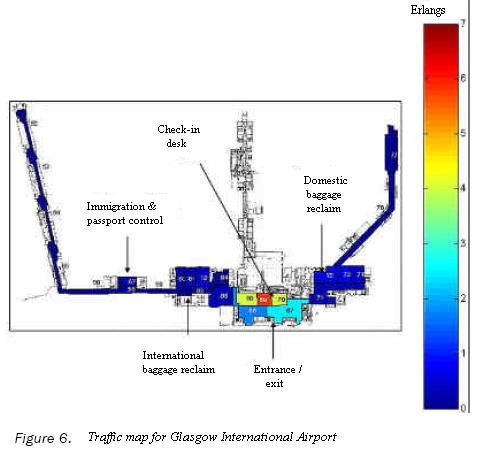
Following the flow chart shown in figure 1, coverage requirements for this airport indicated that a signal strength level of –72 dBm over 95% of the coverage area was required, whereas leakage had to be minimised to no more than –100 dBm over 95% of the leakage area. Traffic was collected on–site for 57 consecutive hours, reporting a measured busy–hour traffic of 51.3 Erlangs. From this, traffic maps were created, as shown in figure 6. An average traffic per user of 30.6 mErl/user was computed from the traffic maps, which is approximated to the traffic generated by a user in the busy hour making one call of approximately 2 minutes of duration.
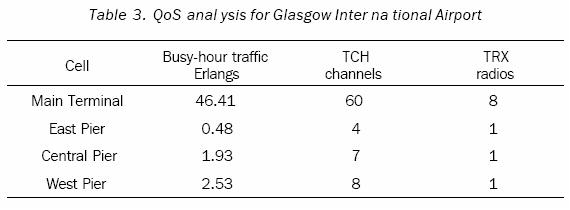
For this airport, four cells were designated, one per each pier (east, central and west), and one for the main terminal building. According to the traffic maps produced, carriers were distributed accordingly, from the QoS analysis, as shown in table 3.
Path loss maps were produced for each of the coverage areas, per antenna, using the MbP path loss prediction approach, as shown in figure 7. These path loss maps were used along with the service requirements as inputs for the DAO, for which an optimised solution was produced. Figure 8 shows simulation results for an optimised solution of five antennas for the main terminal, ground floor building.
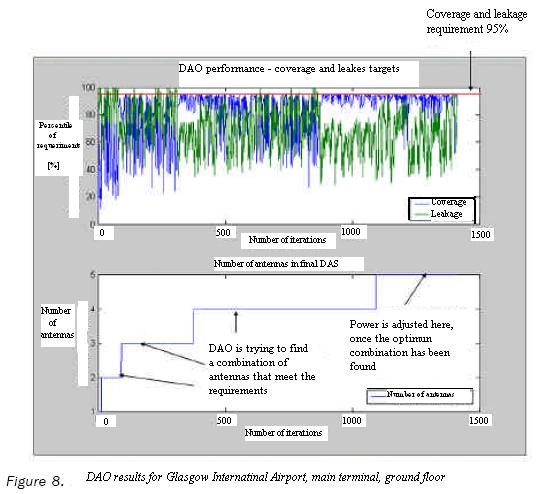
As a result of optimisation, a reduction in the number of antennas was obtained in Glasgow International Airport. A summary of such reduction is shown in table 4. The areas most reduced were the main terminal and the central pier, in which a reduction above 30% was achieved. The power levels per antenna were also reduced at least 1 dB in all cases.
Conclusions
A novel method to design and optimise indoor systems has been proposed in this paper, which has been successfully used for several real applications. The method has been designed for use in 2G, 2.5G and 3G systems, having as a key element the use of carefully calibrated measurements as input to provide accurate path loss predictions.
This method has been demonstrated and assessed in various environments (free space, macrocell, in–building) and scenarios (corporate office buildings, air– ports), as is discussed in detail in (Aragon, 2003).
Capacity has also been accounted for by conducting traffic measurements and elaborating traffic maps of the building, which provide useful information of the distribution of users within the building at specific times, especially during the busy hour.
As mentioned before, the technique has been used extensively for many types of buildings and technologies, and can be extended to upcoming services, such as WLAN and Wi–Max. It has bee demonstrated in this work that the measurement–based approach proposed provides more efficient, cost–effective and accurate indoor solutions than conventional methods of designing in–building systems, showing comparison results which excel other current methodologies. Further work is envisaged to extend the results of this measurement–based approach for the design of other wireless technologies.
Acknowledgments
The author kindly would like to express his gratitude to Red–M (formerly Cellular Design Services), to the Centre for Communications Systems Research, at the University of Surrey and to Consejo Nacional de Ciencia y Tecnología (CONACYT), for their support.
References
Aragón–Zavala A. and Saunders S.R. Three–sector antenna prediction based on omnidirectional antenna measurements. In: Millenium conference in antennas and propagation, AP2000. Davos, Switzerland, April 2000. [ Links ]
Aragón–Zavala A. and Saunders S.R. Measurement–based optimisation of in–building coverage for UMTS. In: International conference on 3G mobile technologies, 3G 2002 (3rd. London, UK). May 2002, pp. 221–224. [ Links ]
Aragón–Zavala A. and Saunders S.R. Inbuilding cellular radio system design and optimisation using measurements. (PhD dissertation). Guildford, UK. Dept. Elect. Engineering, University of Surrey. February 2003. [ Links ]
Aragón–Zavala A. and Saunders S.R. Coverage optimisation based on power control and antenna location in a distributed antenna system. In: International Conference on electrical and electronics eng. (1st, september 2004, Acapulco, Mexico) ICEE–CIE, 2004, pp. 84–89. [ Links ]
Aragón–Zavala A. and Koulinas K. Antenna radia tion pattern estimation in 3–D for indoor environments. In: International conference on electronics, communications and computers (15th, february 2005, Puebla, Mexico) CONIELE–COMP, 2005, pp. 26–31. [ Links ]
Aragón–Zavala A. and Saunders S.R. Traffic mapping for indoor cellular capacity planning. In Peer review, IEE Proceedings on Communications, January 2005. [ Links ]
Aragón–Zavala A., Nikolopoulos V., Belloul B. and Saunders S.R. Accuracy evaluation analysis for indoor measurement–based radio wave propagation predictions. IEE Proceedings on Microwaves, Antennas and Propagation, 153(1): 67–74. February 2006. [ Links ]
Bregenzer T. User mobility model for an indoor environment. In: Proc. of ACTS '96 (November 1996, Granada, Spain). 2:821– 827. Final report, Digital Mobile Radio: COST231 view on the evolution towards 3rd generation systems, European Commission/ COST Telecommunications, Brussels, 1998. [ Links ]
Datta S., Aragón–Zavala A. and Saunders S.R. Automatic optimisation for UMTS indoor coverage using distrib uted antenna systems. In: International Conference on 3G mobile technologies 3G 2003 (4th, 2003, London, UK). June 2003, pp. 42–47. [ Links ]
El–Dolil S.A., Wong W.C. and Steele R. Teletraffic performance of highway microcells with overlay macrocell. IEEE Journal in Selected Areas of Communications, 7:71– 78. January 1989. [ Links ]
Foschini G.J. Gopinath B. and Miljanic Z. Channel cost of mobility. IEEE Transactions on Vehicular Technology, 42:414–424. November 1993. [ Links ]
Gatzoulis L., Aragón–Zavala A., Povey G. and Saunders S.R. Performance analysis of in–building FDD deployment using measured data. In: International Conference on 3G mobile technologies, 3G 2003 (4th, 2003, London, UK). June 2003, pp.167–172. [ Links ]
Guerin R. Channel occupancy time distribution in a cellular radio system. IEEE Transactions on Vehicular Technology, VT(35):89–99. August 1987 [ Links ]
Grayson Wireless [en línea]. Disponible en: URL: http://www.grayson.com [ Links ]
Hong D.H. and Rappaport S.S. Traffic model and performance analysis for cellular mobile radio telephone system with prioritised and non–prioritised handoff procedures. IEEE Transactions on Vehicular Technology, VT(35): 77–92. August 1986. [ Links ]
International Telecommunication Union. ITU–R Recommendation P. 1238: Propagation data and prediction models for the planning of indoor radiocommunication systems and radio local area networks in the frequency range 900 MHz to 100 GHz. Geneva, 1997. [ Links ]
Keenan J.M. and Motley A.J. Radio coverage in buildings. British Telecom Technical Journal, 8(1):19–24.1991. [ Links ]
Kim T.S., Kwon J.K. and Sung D.K. Mobility modelling and traffic analysis in three dimensional high–rise building environments. IEEE Transactions on Vehicular Technology, 49(5):1633–1639. September 2000. [ Links ]
Klepal M., Pechac P. and Mazánek M. New fast approach to wideband propagation prediction in picocells. In: International conference on antennas and propagation. Manchester (11th, 2001,UK). April 2001. [ Links ]
Meier–Hellstern K.S. and Alonso E. The use of SS7 and GSM to support high density personal communications. In: Proc. IEEE International Conference in Communications, (Chicago, IL, 1992). June 1992, pp. 1698– 1702. [ Links ]
Saunders S.R. and Belloul B. Making wireless networks deliver. Ingenia, Royal Academy of Engineering, (12):36–40. 2002. [ Links ]
Tarng J.H., Chang W.R. and Hsu B.J. Three–dimensional model ling of 900 MHz and 2.44 GHz radio propagation in corridors. IEEE Transactions on Vehicular Technology, 46(2): 519–526. May 1997. [ Links ]
Wölfle G., Hoppe R. and Landstorfer F.M. A fast and enhanced ray optical propagation model for indoor and urban scenarios, based on an intelligent pre–processing of the data base. In: IEEE International Symposium on Personal, Indoor, and Mobile Radio Communications (PIMRC), (10th, 1999, Osaka, Japan). September 1999, pp. F5–3. [ Links ]
About the author
Alejandro Aragón–Zavala. Was born in Morelia, Michoacán, México, in 1968. He completed a BSc in electronics and communications engineering at ITESM Campus Querétaro México, in 1991. In 1998, he obtained an MSc with distinction from the University of Surrey, UK, in Satellite Communication Engineering, and in 2003 a PhD in Mobile Communication Systems, with a major in indoor propagation at the University of Surrey, in the UK. He worked as a Project Manager for Hylsa, Puebla, Mexico, for five years, as well as a part–time lecturer for Universidad Iberoamericana, also in Puebla, Mexico. In 1998, he joined Cellular Design Services Ltd. (now Red–M) as a Research Fellow, and in 2000 he became In–building Radio Consultant within the same company. One year later, he was involved in the design and development of indoor propagation prediction tools, and in 2002 he was promoted to Senior In–building Consultant, working as a member of the Radio Technology Group within the same company. He was part of the team who worked in conjunction with BAA, devel oping strategies and recommendations for the deployment of 2G, 3G cellular and WLAN services in all BAA airports. Currently, Dr. Aragón–Zavala is working as Academic Director in the Electronics Department at ITESM Campus Querétaro.

