


Servicios Personalizados
Revista
Articulo
 Inglés (pdf)
 Artículo en XML
 Referencias del artículo
 Enviar artículo por email
Indicadores
-
 Citado por SciELO
 -
 Accesos
Links relacionados
-
 Similares en
SciELO
Similares en
SciELO
Compartir

 Permalink
Ingeniería, investigación y tecnología
versión On-line ISSN 2594-0732versión impresa ISSN 1405-7743
Ing. invest. y tecnol. vol.7 no.2 Ciudad de México abr./jun. 2006
Estudios e investigaciones recientes
Design and Construction of a Blood Flow Detector Probe for a Continuous Wave Bidireccional Doppler Ultrasound System
M. Fuentes*, A. Sotomayor*, F. García*, E. Moreno** y P. Acevedo*
* DISCA–IIMAS. Universidad Nacional Autónoma de México
** CENUS, Instituto de Cibernética Matemáticas y Física, La Habana, Cuba
E–mails:
martin@uxdea4.iimas.unam.mx
soto@uxdea4.iimas.unam.mx
fabian@uxdea4.iimas.unam.mx
moreno@cidet.icmf.inf.cu
pedro@uxdea4.iimas.unam.mx1
Recibido: mayo de 2005
Aceptado: noviembre de 2005
Abstract
The design and construction of a blood flow detector probe for a Continuous Wave (CW) Bidirectional Doppler Ultrasound system is presented. This device is based on two piezoelectric ceramics working in continuous mode and using quadrature phase demodulation for detecting the blood flow Doppler signal. The probe generates the I (In phase) and Q (in Quadrature) Doppler signals as audio. These signals are fed to the line in on the PC sound board for further processing. Oscillator–transmitter and detector–demodulator circuits are integrated into a 1.5 x 9 cm printed circuit board (PCB). Piezoelectric ceramics are placed and connected 1 cm apart the PCB, this achieves noise reduction and increases the probe sensibility. The circuit design allows operation at 4, 5, 8 and 10 MHz depending on the blood flow detection depth in arteries or superficial vessels.
Keywords: Ultrasonic Probe, Doppler signals, Blood flow detector.
Resumen
Se presenta el diseño y construcción de una punta detectora de flujo sanguíneo para un sistema Ultrasónico Doppler Bidireccional de Onda Contiua. Este dispositivo se basa en dos cerámicas piezoeléctricas operando de modo continuo y utiliza demodulación en cuadratura para la detección de la señal Doppler Ultrasónica del flujo sanguíneo. La punta detectora proporciona como salida las señales Doppler I (In phase) y Q (in Quadrature) en rango audible. Estas señales se alimentan a la entrada line in de la tarjeta de sonido en una computadora personal PC, para su procesamiento. Los circuitos oscilador–transmisor y detector–demodulador, han sido integrados en una tablilla de circuito impreso de dimensiones 1.5 x 9 cm . Las cerámicas piezoeléctricas están situadas y conectadas a 1 cm del circuito, logrando con una reducción del ruido y un incremento en la sensibilidad de la punta detectora. El diseño del circuito permite operar a 4,5,8 y 10 MHz, dependiendo de la profundidad de la detección del flujo sanguíneo en arterias o en vasos superficiales.
Descriptores: Punta ultrasónica, Señales Doppler, Detección de flujo sanguíneo.
Introduction
In medical application, ultrasound is extensively used as a diagnostic tool. There is a wide range of medical instruments which are used in this field from simple fetal phones to very sophisticated imaging systems. The main advantage of ultrasound when applied to diagnostic is that it is non–invasive. In Cardiology, the ultrasonic Doppler probe is a very useful instrument to monitor blood flow.
Blood flow velocity in arteries is periodic in time but its frequency spectrum varies during each cardiac cycle, therefore a blood flow Doppler signal is considered a cycle–stationary stochastic Gaussian signal and in short segments (2–20 ms) is considered a quasi–stationary signal. This signal is commonly analyzed using conventional methods such as the fast Fourier transform (Kay et al. , 1981) and also using spectral estimation parametric methods to obtain a better resolution (Ruano et al. , 1993).
In this paper the design and construction of a Continuous Wave (CW) blood flow detector probe is presented. This device determines the blood velocity, and detects flow disturbance by measuring the Doppler frequency shift of an ultrasound beam scattered from the blood flow, using quadrature phase demodulation. Processing the I and Q Doppler signals may provide information about the presence of stenosis and obstruction in arteries (Fish, 1991) (Gosling et al. , 1975). Stenosis is a disease that affects blood flow velocity and pressure producing turbulence, due to this the velocity profile changes modifying the frequency spectrum of the signal, these changes determine the stenosis level.
This probe is compact, and includes I,Q quadrature blood flow signal as an output. Total circuit is integrated in 1.5 x 9 cm printed circuit board. This device can operate within 4 to 10 MHz range.
The main advantage of CW systems is that they measure blood flow high velocities with a high accuracy.
Blood Flow Detector Probe
The simplest blood flow Doppler detector probe is the one described by Sotomura (1960). At present this kind of probes are more compact and efficient, they are used as diagnostic tools in cardiovascular diseases more often.
The basic elements that build the probe are shown in figure 1. This probe is a Continuos Wave (CW) device with coherent demodulation to obtain the I (In phase) and Q (in Quadrature) blood flow Doppler signals.
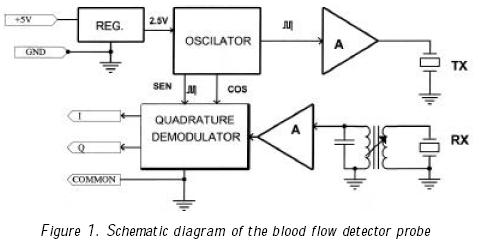
It is worth to mention that the blood flow Doppler signal is actually formed by two components which are the direct and inverse flow. Therefore it is necessary to have two signals in quadrature Iout and Qout to be able to divide the flow direction, this is achieved using signal digital processing in the frequency domain (Evans et al. , 2000).
The transmitter produces an ultrasonic signal that can be defined by the following expression:
 ............................................................(1)
where;
ω0=2π f0= angular frequency, and fo=operation frequency of the ultrasonic transducer.
Considering that the ultrasonic signal received S(t) , it is formed by the carrier and the two resultant blood flow signals (forward and reverse), it is possible to express it as:
 ..............(2)
where A, ω y Φ are the amplitude, angular frequency and phase of each signal respectively. 0, f y r are the carrier, the forward flow signal and the reverse flow signal respectively.
With the aim of preserving the real and imaginary components of the Doppler signal, the signal S(t) is demodulated in quadrature.
This demodulation consists in multiplying by a signal of the same frequency from the transmitter Cos(ω0t) and its signal in quadrature Sen(ω0t).
 .......................................................(3)
 ..................(4)
filtering high frequency and eliminating the d.c. components we obtain:
 ......................(5)
similarly the signal in quadrature is obtained,
 .......................................................(6)
 .....................(7)
then
 is the In phase signal and
 is the signal in Quadrature.
Description of the elements of the probe
Transducer
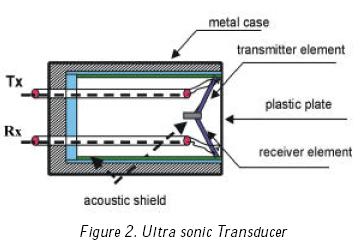
The transducer used in the design of this probe as it is shown in figure 2, it was constructed using two piezoelectric discs PZT–5 with D form, one working as a transmitter and the other as a receiver. The frequency range depends on the application, for example for fetal phones 2 MHz, for blood flow detection in veins and arteries 4–5 MHz and for detection of blood flow in superficial veins 8–10 MHz.
Oscilator–transmitter
In this stage an ultrasonic continuous wave at the operation frequency is generated (4 ,5, 8 or 10 MHz). Also in this stage the signals in quadrature Cos(ω0t) and Sin(ω0t) at the same operation frequency of the transducer are generated. Figure 3 shows a schematic diagram of the circuit, it is worth to mention that when designing the transmitter it is convenient to take into account some characteristics such as power and matching impedance and these must fulfill the security levels recommended by the American Institute of Ultrasound in Medicine (AIUM) (Fish, 1991).
Receiver – Demodulator in Quadrature
The recuperated Doppler signal is very small, therefore it is necessary an RF amplification. Figure 4 shows the schematic diagram of this section. It consists of a RF transformer tuned to the operation frequency of the ultrasonic transducer, a FET transistor used as an RF amplifier in cascade configuration with two bipolar transistors which function is to mix the received signal with the signal in quadrature Cos(ω0t) and Sen(ω0t), advantage is taken of the RC components to limit the frequencies forming a low–pass filter cutting the high frequencies (Equation 4) leaving alone the blood flow Doppler signal. Two miniature trimmers are included in this section to balance Iout and Qout , compensating small errors due to the variation of the electronic components.
If we consider that the human blood flow velocity profile has a range of 20–700 mm/s, and the ultrasonic velocity in tissue is about 1540–1600 m/s (Fish, 1991) (Atkinson, 1975) (Vaitkus et al., 1988), using ultrasonic transducers within 2–10 MHz we are able to estimate the range of the recovered blood flow Doppler signal.
The Doppler signal is given by:
 ...........................................................(8)
So the blood flow Doppler signal lies within 200–10,000Hz, that is the audible range and it is relatively easy to divide the high frequencies from the signal of the detector.
Experiments and Results
To verify the performance of the probe (Figure 5) the I and Q outputs were connected to an amplifier and filter of two channels. The filters used were fifth order band–pass filters with a cut frequency of 300 and 8000 Hz and an amplification of 40–50 dB per channel.
These filters and the probe were designed and constructed as an integral section of a bi–directional blood flow Doppler system at DISCA–IIMAS–UNAM laboratory.
Using MATLAB 6.1 tools, I, Q blood flow signals coming from the probe were acquired using a PC Pentium III audio board, these signals were stored as WAV files. Figure 6 shows these signals.
To verify the frequency spectrum of the acquired I, Q signals, an specific software was developed to display the spectogram of the blood flow signal as shown in figure 7.
Conclusions
The blood flow Doppler detector probe has a good performance, having the transmitter and receiver at a short distance from the piezoelectric discs and also having a good shield gives to the probe good sensibility and low noise. The design of the circuit allows the probe to operate within a range of 4 to 10 MHz depending on the depth of the blood flow detection in veins and superficial blood vessels. Validation of the performance of the probe has been made acquiring real signals associated to the blood flow in arteries, and also processing and displaying these signals as spectograms. Comparison of these spectograms with spectograms produced with commercial equipment has shown the good performance of the detector probe.
Acknowledgements
The authors acknowledge the support of DGAPA–UNAM (PAPIIT–IN120103) (PAPIIT–IN111303).
References
Atkinson P . (1975). A fundamental Interpretation of Ultrasonic Doppler velocimeter. Ultrasound in Med. Biol., 2, pp. 107–111. [ Links ]
Evans D.H and Mc Dicken W.N. (2000). Doppler Ultrasound, Physics, Instrumentation and Signal Processing. John Wiley & Sons, LTD. Second Edition, pp. 101–104. [ Links ]
Fish P.J. (1991). Non–Stationary Broadening in Pulsed Doppler Spectrum Measurements. Ultrasound in Medicine & Biology, Vol. 17, pp. 147–155. [ Links ]
Gosling R.G. and King D.H. (1975). Ultrasonic Angiography in Arteries and Veins. (Eds. A.W. Hascus and L. Adamson). Edinburgh , pp. 61–98. [ Links ]
Kay S.M. and Marple S.L. (1981). Spectral Analysis a Modern Perspective. Proc. of the IEEE, 69, pp. 1380–1419. [ Links ]
Ruano M.G., García–Nocetti D.F., Fish P.J. and Fleming P.J. (1993). Alternative Parallel Implementations of an AR–Modified Covariance Spectral Estimator for Diagnostic Ultrasonic Blood Flow Studies. Parallel Computing, 19, pp. 463 – 476. [ Links ]
Sotomura, S . (1960). Ultrasonic Doppler Method for the Inspection of Cardiac Funtions. Acoust. Soc. Am., Vol. 29, pp. 1181–1185. [ Links ]
Vaitkus P and Cobbold R. (1988). A Comparative Study and Assessment of Doppler Ultrasound Spectral Estimation Techniques Part 1. Ultrasound in Medicine & Biology, 14, pp. 661–672. [ Links ]
Semblanza de los autores
Martín Fuentes. Es ingeniero mecánico electricista (área de electrónica), egresado de la Facultad de Ingeniería de la UNAM. Labora en el IIMAS desde 1983. Ha colaborado en diferentes proyectos institucionales dentro y fuera de la UNAM, tales como: Instituto de Ciencias del Mar y Limnología, Instituto de Biología, Instituto de Geofísica, Museo Universum, Instituto Mexicano del Petróleo y el Departamento de Ultrasónica del ICIMAF–CUBA. Ha realizado estancias de trabajo en España, Cuba y Brasil. Sus áreas de especialidad son la instrumentación sismológica, oceanografía, meteorología y monitoreo atmosférico, así como ultrasónica médica e industrial.
Alejandro Sotomayor. Es licenciado en ingeniería electrónica por el Instituto Superior Politécnico de la Habana, Cuba, desde 1992. Ingresó al Instituto de Cibernética Matemática y Física de Cuba, en el Centro de Ultrasónica en 1994. Posteriormente, obtuvo la maestría en ciencias en la Universidad de la Habana, Cuba. Para el año de 2001, ingresó al Instituto de Investigaciones en Matemáticas Aplicadas y en Sistemas, UNAM. Las líneas de investigación que desarrolla actualmente son el diseño de transductores, instrumentación ultrasónica y procesamiento de señales para medicina y Pruebas No Destructivas (PND).
Fabián García. Egresó en 1984 de la Facultad de Ingeniería de la UNAM con mención honorífica. Recibió los grados de maestro y doctor en el área de sistemas de cómputo por la Universidad de Gales, Bangor, Reino Unido, en 1988 y 1991, respectivamente. Recibió el Premio Nacional de Ingeniería "Emilio Rosenblueth 1996", otorgado por la Academia Nacional de Ingeniería, así como el Premio "Ciencia e Ingeniería de la Computación" en el año 2000. Se especializa principalmente en cómputo de alto desempeño, procesamiento de señales e imágenes, imagenología ultrasónica, tomografía de procesos, computación móvil y redes inalámbricas. Actualmente es investigador titular "B" del IIMAS.
Eduardo Moreno. Es físico por la Facultad de Ciencias de la Universidad de la Habana, Cuba. Desde 1980, labora en el Centro de Ultrasónica (CENUS–ICIMAF), Cuba, con categoría de investigador. En 1994, obtuvo su doctorado en ciencias físicas por la Academia de Ciencias de Cuba, y para mayo de 2000 a mayo de 2002, se desempeñó como investigador del IIMAS–UNAM, así como profesor en el Posgrado en Ciencia e Ingeniería de la Computación de la UNAM. Actualmente es jefe de proyecto en el CENUS–ICIMAF. Las áreas de investigación que estudia son el procesamiento de señales e imágenes, así como imagenología ultrasónica.
Pedro Acevedo. Es egresado de la Facultad de Ingeniería de la UNAM en 1984. Recibió los grados de maestro (Instrumentación) y doctor (Ultrasonido) por la Universidad de Gales, Bangor, Reino Unido en 1987 y 1992, respectivamente. Actualmente es investigador titular "A" y jefe del Departamento de Ingeniería de Sistemas Computacionales y Automatización del IIMAS. Asimismo, es profesor de asignatura en la Facultad de Ingeniería de la UNAM. Sus líneas de investigación son el procesamiento de señales e imágenes, imagenología ultrasónica, diseño, modelado, construcción y caracterización de transductores ultrasónicos. También pertenece al Sistema Nacional de Investigadores del CONACYT.

