


 nueva página del texto (beta)
 Inglés (pdf)
 Artículo en XML
 Referencias del artículo
 Enviar artículo por email
 Citado por SciELO
  Similares en
SciELO
Similares en
SciELO 
 Permalink
Subjective expectations
Assessments on subjective expectations have been extensively used in the economic literature that, since the mid-fifties, has been mainly interested in predicting consumption, saving choices, and retirement planning (Benitez et al., 2008; Biro, 2013; Dominitz and Manski, 1997; Gan et al. 2005; Griffin et al., 2012). How to measure these subjective expectations has changed over time. Since the early 1990’s economists have shown an increased interest in bringing out probabilistic expectations on relevant personal events directly from survey respondents instead of inferring subjective probability distributions from choice data (Manski, 2004). Studies on health outcomes have placed, by far, less importance on individual subjective expectations than research on the economic field has. Mortality expectations, as well as risk perception, associated with health-related behaviors have been studied for the most part regarding smoking behavior (Balia, 2014; Khwaja et al. 2007; Schoembaum, 1997; Smith et al. 2001a). Recently, Delavande and Kohler (2009) introduced a new method for eliciting subjective expectations about HIV/AIDS-related behaviors and events, in an effort to gain insight on the determinants and consequences of HIV-risks in a low literacy and numeracy context.
Probabilistic expectations are attractive because of their potential for allowing inter- and intra-individual responses, for testing internal consistency and external accuracy, and for predicting future outcomes (Dominitz and Manski, 1999). Different studies underwent the task of determining whether subjective survival estimations predict mortality and how accurate subjective survival probabilities are as compared to observed survival (Jylhä, 2011): survival expectations proved to be consistent with observed survival patterns (Bissonnette et al., 2014; Peracchi and Perotti, 2009; Smith et al., 2001a). Several recent studies suggest that subjective forecasts are effective mortality predictors (Perozek, 2008), however there is some controversy on this regard (Elder, 2013). Subjective probabilities of survival have shown to behave and aggregate as population probabilities do and to covary with other variables like socioeconomic status (SES) and smoking as actual probabilities vary with the same variables (Hurd and McGarry, 1995; Rappange et al., 2016a).
The body of research on subjective survival expectations in developing countries is scant and to the best of our knowledge in Latin America is virtually non-existent. For this reason, the main objective of this study is to investigate and compare the determinants of subjective survival expectations as older adults in Chile and Mexico state them.
The organization of the paper is as follows: In section 2, we review selected empirical findings. In section 3, we describe the data and the measures used for the analysis and in section 4 the methodology we employed. In section 5, we show the results of the statistical analysis and in section 6, we discuss the results. Finally, section 7 contains some concluding remarks.
What does the Literature Say on the Determinants of Subjective Survival Expectations?
Tolor and Murphy stated that “the assessment of one’s own life duration is probably a composite, based on at least such factors as one’s estimate of normative (actuarial) data, defensiveness against death anxiety, experiences with death in family members or in close friends, the attitudes of family towards death and dying, age, and relative position in the family” (Tolor and Murphy, 1967: 21). Nelson and Honnold (1980), in accordance with Tolor and Murphy, hypothesized that subjective life expectancy would vary by type of death exposure (death among near relatives) and family size and structure; they also considered in their model the effect of desired longevity. Interestingly, neither Tolor and Murphy nor Nelson and Honnold mentioned the effect of health on subjective survival expectations, probably because they were working with young individuals. Different health conditions as well as perceived health seem to have a substantial impact on subjective life expectancy (Hurd and McGarry, 1995; Ross and Mirowsky, 2002). In general, the literature proposes four main elements as determinants of subjective survival: sociodemographic characteristics, healthy and unhealthy lifestyles, different facets of physical and mental health, and longevity of parents (Zick et al., 2013). These elements can be grouped into four dimensions:
Sociodemographic Dimension
Individual’s chronological age was consistently found to be positively associated with the subjective probability of surviving to age 75 (Finkelstein et al., 2008; Hurd and McGarry, 1995; Liu et al., 2007) and with subjective life expectancy (Brouwer and van Exel, 2005; Mirowsky, 1997). Results regarding the influence of income, education, and marital status on subjective life expectancy or self-reported probabilities of surviving to a given age are somehow less consistent than they are for chronological age (Mirowsky and Ross, 2000; Ross and Mirowsky, 2002). Popham and Michell (2007) found that subjective life expectancy is associated with life-course SES after adjusting for self-rated health and smoking status: those experiencing childhood disadvantages and poor educational attainment have the highest odds of being pessimistic regarding their own survival probabilities. Moreover, Delavande & Rohwedder (2011) suggest that subjective probabilities of survival are a reasonable alternative for estimating differential survival by wealth. Regarding differences in subjective survival expectations by gender, some studies found that men expect a longer life than women do, contrary to actuarial survival expectations (Griffin et al., 2013).
Objective Health and Self-Assessed Health Dimension
As mentioned earlier, health status, as well as different health conditions, has consistently shown to be predictors of self-reported probabilities of surviving to a target age (Bulanda and Zhang, 2009). For example, Hamermesh and Hamermesh (1983) found that having been diagnosed with a life-threatening illness significantly decreased expected longevity by around four to seven years. It was also observed that individuals revise downwards their perceived survival probabilities upon acquiring adverse health information (Benitez-Silva and Ni, 2008; Liu et al., 2007; Smith et al., 2001b). Popham and Michell stated that self-rated life expectancy “may capture something other than simply current health conditions” (Popham and Michell, 2007: 62). Siegel et al. (2003) suggested that self-predicted probability of survival and self-rated health may be conceptually related but they are not the same and they seem to have independent effects on mortality predictions.
Health-related Behaviors Dimension
In addition, individuals seem to be aware of the relationship between their health-related behaviors and their future survival expectations. Smoking is consistently found to be negatively associated with subjective survival estimations (Hamermesh and Hamermesh, 1983; Ross and Mirowsky, 2002; Viscusi and Hakes, 2008). For alcohol drinking, Hurd and McGarry (1995) found that moderate drinking was associated with higher subjective probabilities of surviving to ages 75 and 85 than subjective survival probabilities for complete abstinence. The opposite was true for heavy drinking (five or more glasses per day) relative to complete abstinence. However, heavy drinkers, like smokers, seem to be optimistic regarding their survival chances compared with observed mortality outcomes (Hurd, 2009; Rappange et al., 2016b). However, regular physical activity does not show a clear relationship with subjective survival expectations (Hamermesh and Hamermesh, 1983; Hudomiet and Willis, 2013; Ross and Mirowsky, 2002).
Death Experience Dimension
As Tolor and Murphy (1967) hypothesized, longevity of parents has shown to have an important influence on individuals’ survival expectations. Hurd and McGarry (1995) stated that, as genetic factors help to determine subjective longevity, parental age and parental age at death are used as genetic predisposition markers. Ross and Mirowsky (2002) pointed out that when making longevity estimations people may look to their family history to determine their genetic stock mainly taking into account same-sex parent’s survival history. However, Hamermesh (1985) suggested that individuals base their subjective life expectancies in an unreasonable manner on their relatives’ longevity, especially longevity of their parents and grandparents. The study by Hudomiet and Willis (2013) show evidence that individuals place too much weight on their parent’s age at death when forming their own longevity expectations.
Data and Measures
Data
Data for this project was drawn from the Chilean 2004 Social Protection Survey1 (SPS) and the 2005 Mexican Family Life Survey2 (MxFLS). The SPS is a nationally representative longitudinal survey. The 2004 SPS is the follow-up study of the original 2002 SPS study for individuals 15 years old and over who were affiliated to the Chilean pension system. The 2004 SPS only includes individuals aged 18 and over were they affiliated or not to the pension system. The 2004 SPS sample is composed of 17 000 individuals, 940 of whom were new participants, 2 860 unaffiliated and 13,200 affiliated to the national pension system.
The MxFLS is a longitudinal survey with national, urban, rural and regional representation of the Mexican population. The 2005 MxFLS is composed of 39 000 individuals based on the original 2002 MxFLS sample of 8,440 households with 35 000 individuals from 150 communities in Mexico.
Measures
Self-Reported Probability of Surviving to a Target Age
In the 2004 SPS, the question on subjective survival probabilities changes the target age as follows: “Using a 0 to 100 scale where "0" means there is absolutely no chance, and "100" means that it is absolutely certain:
What are your chances to live to age 65” (individuals aged 50-65)
What are your chances to live to age 75” (individuals aged 65-74)
What are your chances to live to age 85” (individuals aged 75-84)
What are your chances to live to age 100” (individuals aged 85+)
The MxFLS asks the survival probability question only to individuals aged 50-74 and it takes the following form: “To make it easier, we will use a scale from 0 to 100, where 0 is ‘impossible’ and 100 is ‘completely sure’ that it can happen,
How probable is that you will live until 75 years of age?”
Determinants of Subjective Survival Probabilities
In order to study the determinants of the subjective survival probability of reaching a given age, we considered the aforementioned four dimensions (Sociodemographic, Health Status, Health-related Behaviors, and Death Experience). The set of variables included in each dimension is described below:
Sociodemographic dimension
Sex is included in the analysis as the dichotomous variable Female. Marital Status takes into account four categories: Married/Cohabiting, Separated/Divorced, Widowed, and Single. Regarding education, four educational categories were considered: No Formal Education, Incomplete Primary School, Complete Primary School, and More than Primary Education. Age is defined as a continue variable.
Health dimension
In order to assess the relationship between health status and subjective survival expectations the health dimension includes measures of subjective physical health status, diagnosed diseases, and physical functioning. Self-assessed physical health status was defined as a three-category variable: Excellent/Very Good/Good (or Very Good/Good),3 Fair, and Poor/Very Poor. Besides self-assessed physical health, this dimension includes an Index of Self-Reported Chronic Conditions (diabetes, cancer, heart disease, and hypertension).4 This dimension also includes an Index of Physical Functioning.5 The Index of Physical Functioning is a dichotomous variable indicating whether or not the respondent can perform without difficulties at least 85 per cent of the functions described in each of the studies respectively.6
Health-related Behaviors Dimension
The health-related behaviors included in this dimension are smoking and practicing physical activities. It also includes and indicator on body weight status.7 Smoking and practicing physical activities are taken into account by means of two dichotomous variables indicating whether the respondent is currently a smoker and whether he or she practices physical activities on regular bases.8
Death Experience Dimension
Both studies provide parental mortality data. Respondents were asked whether their parents were still alive. Only MxFLS respondents were also asked about the current age of their parents, both father and mother’s age, if they were still alive and, the age at death if they were not.
Methods
The determinants of subjective survival probabilities are studied by means of linear regression analysis where the dependent variable is Self-Reported Probability of Surviving to a Target Age. Due to differences in the wording of the questions according to the age of respondents, we only consider individuals aged 65 to 74 in 2002 and 2005 for the Mexican and Chilean samples respectively. In this age range both studies share the same target age: 75 years.
Different models were evaluated in a nested fashion following the dimensions listed earlier, one model for each dimension. However, instead of the four expected models we only evaluated three models for both studies. This decision is due to the huge amount of missing data that the Chilean study has for the survival of the parents’ question.9
We used Non Linear Square (NLS) methods to estimate subjective life tables fitting a range of mortality functions: Gompertz, Weibull, and logistic. Estimations of subjective survival were done using the answer to the survival question to age 75: the conditional probability of surviving to age 75 given the respondent survived to his or her current age at the time of the survey. In contrast with previous research (like the study by Perozek (2008)), we assume that individuals adopt the same age pattern of mortality to assess survival expectations but allow them to differ in terms of the mortality levels they express. That is to say that subjective expectations of individuals the same age help identify mortality levels, whereas the shape of the mortality curve is identified using individuals of different ages.10
Results
Tables 1 and 2 describe the analytical sample composition for males and females in both surveys, the Chilean SPS and the Mexican MxFLS respectively. In relation to the Health Dimension, differences between males and females in the Chilean sample are mainly regarding the prevalence of hypertension, difficulties walking long distances and dressing. These prevalence, that are higher for females than for males, are reflected in the Index of Chronic Conditions, where the prevalence of having zero chronic conditions is lower for females than for males. The Index of Physical Functioning shows that the percentage of individuals with less functioning limitations is lower for females than for males. Regarding the Mexican sample, the percentage of those who report not having hypertension, diabetes, and heart disease is lower for males than for females. Results for males compared to females with respect to the Index of Chronic Conditions, difficulties walking and climbing stairs, as well as for the Index of Physical Functioning are similar to those obtained for the Chilean sample.
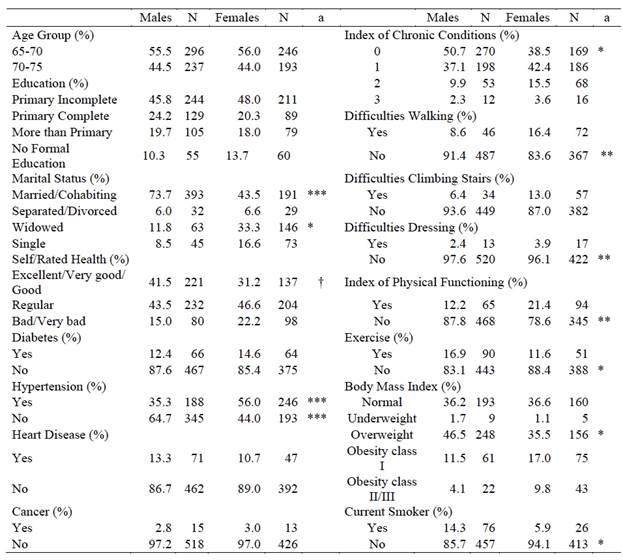
a: Difference in proportions between males and females. Statistical significance: †: p < 0.1; *: p < 0.05; **: p < 0.01; ***: p < 0.001
Table 1: Chile: Social Protection Survey (SPS) 2004. Descriptive Statistics

a: Difference in proportions between males and females. b: Difference in proportions between Chile and Mexico. Statistical significance:†: p < 0.1; *: p < 0.05; **: p < 0.01 ***: p < 0.001
Table 2: Mexico: Mexican Family Life Survey (MxFLS) 2005. Descriptive Statistics
Table 2 shows that for males and females the prevalence of self-reported hypertension and heart disease is higher in the Chilean sample than in the Mexican one. No statistical significant differences were found regarding diabetes. Consistently, for both males and females, the percentage of individuals with no chronic conditions is higher among individuals in the Mexican study. On the contrary, the percentage of males and females reporting difficulties walking long distances and climbing stairs is higher among those in the Mexican sample. Another important difference between samples is found in the Sociodemographic Dimension where the percentage of individuals with no formal education is higher among those in the Mexican sample.
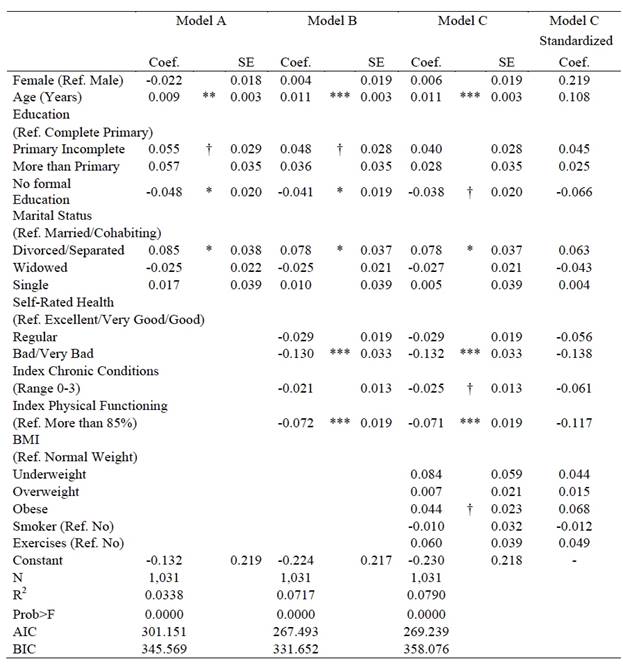
Tables 3 and 4 show Models A, B, and C including the Sociodemographic, Health, and Health-Related Behaviors dimensions in a nested way for Chile and Mexico, respectively. In general, all variables included in each dimension have the expected sign. However, there are differences between samples. Age is highly significant in both cases, although its contribution explaining the dependent variable seems to be greater in the case of Chile. The coefficients related to education are also as expected, however only for the Mexican case having no formal education, compared with having complete primary school, significantly decreases subjective survival expectations. Regarding marital status, only among individuals in the Chilean sample the coefficients associated with being separated/divorced, widowed or single, as compared with being married/cohabiting, have the expected negative sign although not statistically significant. On the contrary, among individuals in the Mexican sample only the coefficient associated with being widowed, although not statistically significant, has the expected sign. More surprising is the coefficient associated with being separated/divorced: its sign is in the opposite expected direction and statistically significant at the five per cent level. This last result needs more insight.

***: p < 0.001; **: p < 0.01; *: p < 0.05; Ɨ: p < 0.1
Table 3: OLS Models: Chile. Determinants Subjective Survival to Age 75
***: p < 0.001; **: p < 0.01; *: p < 0.05; Ɨ: p < 0.1
Table 4: OLS Models: Mexico. Determinants Subjective Survival to Age 75
Regarding the Health dimension, self-rated regular and bad/very bad health, compared with excellent/very good/good health, as expected, significantly decrease subjective survival probabilities among individuals in both samples. However, their contribution explaining the dependent variable seems to be greater for the Chilean sample. The coefficients associated with the indexes of Chronic Conditions and Physical Functioning have the expected sign for both samples. Nevertheless, only among individuals in the Mexican sample they are statistically significant (at the 10 per cent and 0.1 per cent level, respectively).
About the variables included in the Health-related Behaviors dimension, the coefficients associated with BMI are in the opposite direction in both cases. Moreover, for the Chilean sample it is statistically significant at the 5 per cent level and for the Mexican sample at the 10 per cent level. That is to say, being obese, as compared with having normal weight, increases subjective survival probabilities of reaching age 75. It is worthwhile remembering that the category obese encompasses the categories obese classes I, II, and III. The coefficients associated with being a current smoker and practicing physical exercises on regular bases, although not statically significant, have the expected sign for the Mexican sample. Among individuals in the Chilean sample, although these coefficients also lack statistical significance, they are in the opposite direction. That is to say, the coefficient associated with being a current smoker is positive (increasing subjective survival expectations) and the one associated with practicing exercises is negative (decreasing subjective survival expectations).
We decided to test separately other aspect related to the Health dimension: mental health. Depressed individuals may manifest a greater pessimism than non-depressed ones. It was shown that depressed individual are less likely than the others are to predict that their own future outcomes would be more positive than future outcomes of similar individuals (Alloy and Ahrens, 1987). The Chilean survey includes a question about having ever been diagnosed with depression; 8.0 per cent of the analytical sample reported a depression diagnosis. Instead, the Mexican survey includes an instrument for measuring severity of depression symptoms.11 The instrument was meant to discriminate between depression and anxiety: 14.9 per cent of the analytical sample was identified as having anxiety12 and 3.0 per cent as having mild and severe depression.13 We collapsed these two categories into one named just depression. The variables associated with depression are not comparable between countries. They are included in Models D. Tables 5 and 6 show Model D estimates for Chile and Mexico, respectively. Among individuals in the Chilean sample, the coefficient associated to having ever been diagnosed with depression is not statistically significant; moreover, it is in the opposite expected direction. On the contrary, among individuals in the Mexican sample, the sign of the coefficients associated with anxiety and depression are as expected, both negative. However, only the coefficient associated with anxiety is significant.
***: p < 0.001; **: p < 0.01; *: p < 0.05; Ɨ: p < 0.1
Table 5: OLS Models: Chile. Determinats Subjective Survival to Age 75
***: p < 0.001; **: p < 0.01; *: p < 0.05; Ɨ: p < 0.1
Table 6: OLS Models: Mexico. Determinants Subjective Survival to Age 75
In the case of the Mexican sample, we also estimated a fifth model, Model E, incorporating to Model D the Death Experience dimension. This dimension includes a variable reporting whether the same-sex parent was dead. Table 6 also shows Model E estimates for Mexico.
In order to compare the performance of Models A, B, and C, we use the Akaike´s information criterion (AIC) and the Bayesian information criterion (BIC). These two methods vary in the weight that they give to simplicity, the fewness of parameters, with the penalty term being larger in BIC than in AIC (Forster, 2000). Lower values on each of these two criteria indicate a better fit. Results of applying the AIC and BIC criteria were similar. They both favor Model B (Tables 3 ) and 4. In other words, Model B is the most parsimonious. For these samples, the Health-related Behavior dimension does not increase the explanatory power to the models.
Figure 1 shows predicted subjective survival probabilities for both Mexico and Chile. Predictions are based on Model B in both cases. Although conditional subjective survival probabilities for both males and females increase with age, subjective survival expectations for Chileans are much higher than for Mexicans. Chilean females unlike Mexican females, report, as expected, subjective probabilities of surviving to age 75 that are significantly greater, although only at 10 per cent level, than those reported by males are.

Source: SPS-2004 and MxFLS-2005
Figure 1: Subjective Survival Expectations. Linear Predictions (95% CI)
We compared results obtained adjusting the aforementioned mortality functions to the subjective data with published life tables.14 In the case of the Chilean study, we found that the logistic data offers a better fit than the Gompertz and Weibull functions. In the Mexican case the Gompertz and the logistic functions yielded similar results. Therefore, we estimated subjective life expectancy at birth s e 0 by means of non-linear regression analysis fitting a logistic survival function for both samples. Results show that se0 = 77.2 and se0 = 79.1 for Chilean males and females respectively and se0 = 74.9 and se0 = 75 for Mexican males and females respectively. Subjective life expectancy at birth among females in the Chilean study is higher than subjective life expectancy at birth among males. On the contrary, subjective life expectancy among females in the Mexican study is similar than subjective life expectancy at birth among males.
Discussion
The main objective of this study is to investigate and compare the determinants of subjective survival expectations as are stated by adults aged 65 to 74 years in Chile and Mexico. Results show that the determinants of subjective survival expectations are consistent for both, Chile and Mexico, with those reported by the literature for the US and Europe. Both studies show that age is an important determinant of subjective probabilities of surviving to a given age. In the same way, the Health dimension is highly relevant in determining subjective survival. However, contrary to what was expected, smoking as a health-related behavior was not a significant determinant of subjective survival in neither study. In fact, adding the Health-related dimension to a model including sociodemographic and health variables did not add explanatory power to the model.
The unexpected opposite signs of the coefficients associated with smoking and exercising among individuals in the Chilean sample may be related to the age of respondents, particularly for being a current smoker. Including in our models a variable indicating number of cigarette packs smoked per month instead of status as current smoker does not change results. It is possible that respondents who survived to age 65 and more and are current smokers think that they are already too old for them to be affected by smoking. Changing the age range to 50 to 64 years and testing the determinants of subjecting survival to age 65 among individuals in the Chilean study results were somehow different. Although still not significant, the coefficient related to being a current smoker is in the expected negative direction. Similar results were obtained when analyzing the Mexican sample. Interestingly enough, Balia (2014) identified two groups of smokers. One of them seemed to attribute less damaging effects of smoking on health and mortality, the group being composed of “hard-core smokers.” The second group, that was less frail and less addicted than the first one, on the contrary, seemed to be more rational assessing health status and survival probabilities regarding the consequences of smoking. The author concluded that the heavy smokers, who were in general older than the others, might have believed that they did not have time left for smoking to affect their mortality risk. This seemingly lack of awareness of the damaging effects of smoking on health and on the long run, on longevity, is in contrast to estimates obtained from mortality data. For example, Palloni et al. (2015) showed that differences in life expectancy at age 50 between observed mortality and its counterfactual, life expectancy at age 50 in case the fraction of deaths attributable to smoking would be eliminated, that is in the absence of smoking, are large: around four years for Chile and two years for Mexico. These differences in life expectancy between countries reflect the stages of the smoking epidemic that each country is undergoing, with Chile at an advance stage and Mexico at an early one.
Results regarding subjective survival and relative body weight status suggest a similar lack of awareness of the consequences of being obese. For both samples the coefficient associated with being obese as compared with having normal weight are positive and statistically significant. According to the Pan American Health Organization (2014), in Chile, Mexico, and United States of America the prevalence of obesity and overweight among individuals 20 years and older reaches 70 per cent. Particularly for Mexico, Palloni et al. (2015) estimated that under current conditions of overweight and obesity prevalence, diabetes incidence and related mortality, individuals are likely to experience losses in life expectancy at age 50 of between 1 to 2 years. These losses are somewhat less than those associated with smoking prevalence in some countries of the region. More research is needed particularly to understand the results regarding the body weight status being as both samples are from countries where the environment contributes to promote gaining weight, an obesogenic environment (Mackenbach et al. 2014). We should stress that health is not mediating the relationship between subjective survival and health-related behaviors. We evaluated a model with only this dimension adjusted for demographic characteristics and the coefficients associated with the variables included in the Health-related behavior dimension are not substantially different form the coefficients obtained in model C.
Some caveats are in order: to compare the determinants of subjective probabilities of surviving between both studies we redefine different variables. Among them the index of physical functioning, the index of chronic conditions, and the variable associated with mental health. To ensure that the definition used for the index of physical functioning does not affect the results for Chile, we run the models with different index definitions. There were no significant changes in the results. Moreover, we run the models not using an index but with a set of dummy variables, one for each of the questions asked in the study that were part of the index. Except for having difficulties walking and climbing stairs, none of the other dummy variables were statistically significant. However, the coefficients related with these variables were in opposite directions, positive the one associated with walking long distances and negative the one associated with climbing stairs (both significant at the five per cent level). These two results could be affecting the lack of significance of the coefficient related to the physical functioning index. Regarding the unexpected result for climbing stairs, it may be due to the wording of the questions.15
Regarding the index of chronic conditions, we tested separately the four conditions that comprise this index. In the case of the Chilean study we found that although the coefficients associated with each of them were in the expected direction (except for cancer, but this result may be due to the very small prevalence of the condition in the sample) none of them were statistically significant.
As mentioned earlier, the Mexican study includes an instrument meant to measure the severity of depression symptoms. The Mexican instrument discriminates between anxiety and depression. Even though only the coefficient associated with anxiety was significant, the coefficient associated with depression was in the expected direction. This result may reflect the low prevalence of individuals classified as having symptoms of depression, only three per cent among individuals in the analytical sample. Surprisingly enough, because depression is consistently found as decreasing survival expectations (Griffin et al., 2013; Hudomiet and Willis, 2013), among individuals in the Chilean sample the coefficient associated to having ever been diagnosed with depression is not statistically significant and is in the opposite expected direction. One possible explanation of this result lies in the wording of the survey question and its interpretation. Having ever been diagnosed with depression may be understood as ever been diagnosed with a depression episode. As a depression disorder, these episodes should last at least for two weeks (Belló et al., 2005). Despite the fact that the prevalence of depression in Chile is very high (Bossert and Leisewitz, 2016), because life expectancy in Chile is also relatively high we may speculate, as Hamermesh (1985) did, that people extrapolate improvements in longevity when estimating survival while being aware of the level and changes of current life tables, independently of their depression symptoms.
Results obtained for life expectancy at birth are accurate compared with 2000-2005 published estimates.16 The UN World Population Prospective estimates of life expectancy at birth e 0 are e0 = 74.6 and e0 = 81 for Chilean males and females respectively (se0 = 77.2 and e0 = 79.1 for males and females). While e0 = 72.4 and e0 = 77.4 for Mexican males and females respectively (se0 = 74.9 and se0 = 75 for males and females). In both cases, males overestimate their future life expectancy (around two and three years Chilean and Mexican males respectively) while females underestimate it (around two years both Chilean and Mexican females).
There are several hypothesis trying to explain this “anomaly,” as Mirowsky (1999) called it: First, as mortality rates are higher among men than among women, men may think there is more room for decreasing mortality rates among them than among women. Second, they may sense they have higher life expectancy than women do, because in general men show to be in better health than women are (Read and Gorman, 2005). In the same way, their higher SES may suggest them that they have a higher life expectancy than actuarial estimates indicate because of the inverse relationship between SES and mortality (Adler et al., 1994; Elo, 2009: Lynch et al., 2000; Marmot et al., 1997).
An important property of self-reported probabilities of any kind is the high frequency of what Hurd and McGarry (1995) called “focal-point responses.” A focal-point response is found when the answer given to the question regarding the respondents’ beliefs on the probability of occurrence of any given future event corresponds to a probability of zero, one half, or one. Focal point responses are not rare; on the contrary, surveys usually show a fair amount of them in response to questions on subjective expectations that allow numerical scale answers.17 One of the problems with the fifty percent chance responses is the difficulty, or impossibility, of distinguishing if they are the respondents’ expression of the belief that their chances are fifty percent (Gärdenfors and Sahlin, 1982) or of the inability to express their beliefs in a probabilistic manner (Fischhoff and Bruine de Bruin, 1999). A fifty percent response may allow uncertain respondents to answer a question numerically instead of giving a “don’t know” answer (Bruine de Bruin et al., 2000). Balia (2014) states that, under the rationality assumption, an individual who is uncertain would consider his or her chances to live until a target age or die before it to be equal and therefore give the fifty percent answer. For testing the sensitivity of the results to focal-point answers, we run different models, particularly omitting answers that represented 0.5 probabilities of surviving to age 75. Results did not differ in any quantitative or qualitative way. Excluding focal-point answers when estimating subjective life expectancy do not yield significant different results either.
One of the limitations of the present study is related to differences in the subjective survival question between surveys. We only considered individuals aged 65 to 74 in 2002 and 2005 for the Mexican and Chilean samples respectively because in this age range both studies share the same target age: 75 years. We run our models for the Mexican sample using the whole available age range, 50-74 (the question was asked to individuals 50 years old and over). Results did not vary qualitatively although we gain statistical power. For the Chilean, sample because the question varies the target age according to the respondent’s age at survey, in order to analyze the determinants of subjective survival, which in our case was age 75, we should have changed our research objective altogether asking for the determinants of surviving at least 10 years more from current age. This analysis remains to be done.
The other important limitation is that the analysis of the effect of parent’s survival status on respondent´s subjective survival expectations could not be done for the Chilean study because of the amount of missing values in the answer to this question (more than 70 per cent). We studied the likelihood of not answering the question on survival status of parents and found that the odds of not answering the question being female are four times the odds of not answering it being male. As expected, the odds of lacking information on parental mortality for individuals with complete primary education and for individuals with more than primary education are 60 per cent and 40 per cent, respectively, the odds of lacking this information for individuals with incomplete primary education. On the contrary, the odds of not answering this question for individuals with no formal education are more than two times the odds for individuals with incomplete primary education. This last result is consistent with findings by Kleinjans and van Soest (2014). One possible explanation is that individuals with less education and cognitive capacity may find it more difficult to express expectations as probabilities (Bago D’Uba et al., 2015). Unfortunately, the Chilean survey does not provide information on cognitive ability of respondents.
Despite this limitations subjective survival estimations have the same properties shown in the fair amount of studies that analyzed data from the United States and Europe. Results obtained in the present study highlight the need of a better understanding of how individuals estimates their survival expectations.
Conclusions
Survival expectations are responses to questions about probabilities of the surviving age that could be attained by respondents in the future. Work on survival expectations is relatively new and part of a larger literature on individual expectations (Manski, 2004). Much like self-rated health (Idler and Benyamini, 1997), subjective survival was also found to be a significant mortality predictor even controlling for sociodemographic factors and health-related conditions (Elder, 2013; Hurd et al., 2001; Hurd and McGarry, 2002; Smith et al., 2001a). This line of research has seldom been addressed for Latin American countries.
The importance of subjective survival expectation has been growing rapidly as researchers uncover patterns, determinants and remarkable consistency with individual health status and changes thereof (Liu et al., 2007), past and current health-related behaviors (Falba and Busch, 2005; Khwaja et al., 2006, 2007, Scott-Sheldon et al., 2010), experiences of health shocks and individual self-reported health (Smith et al., 2001b). There is still much to be done on this topic. For example, an important point that we did not address, and is worthwhile exploring, particularly for Mexico, is the influence of the violent environment on subjective survival expectations. We may hypothesized as individuals with experience of violence or crime (robbery, assault, aggression) feel more vulnerable and this may be reflected on their survival expectations. Finally, explaining, at least part, of the process by which individuals determine their future survival may help on determining differentials in health and mortality across societies and cultures.

