


 nueva página del texto (beta)
 Inglés (pdf)
 Artículo en XML
 Referencias del artículo
 Enviar artículo por email
 Citado por SciELO
  Similares en
SciELO
Similares en
SciELO 
 Permalink
Introduction
Type 2 diabetes (T2D) mortality in Mexico showed a growth rate 143 per cent higher than the growth rate from all other death causes during the last decade. This unprecedented trend which implies a 5.06 per cent annual growth rate, is consistent with an epidemic behavior among mortality causes in Mexico.
In 2012, diabetes took the life of 85 055 individuals in México. Excluding heart failure, which is overrepresented in mortality statistics,1 T2D has become the single most important cause of death in the country. According to the national health information system SINAIS, this single death cause represents 14 per cent among 3 862 possible death causes documented in the country.
T2D is a major public health problem in the country yet until recently the study of biological factors overshadows the importance of contextual determinants such as geographic location and others to explain this epidemic.
Among academics studying the border, there has been a growing recognition on the link between border geographic proximity and health outcomes. Thus, increasing diabetes rates and obesity-related to US-influenced consumption styles (Campbell, 2005: 209) represents an active research line.
The continuous population movement between twin communities along the US-Mexico border exerts a constant cultural influence that extends beyond consumption (Mondragón and Brandon, 2004: 180). Empirical evidence indicates that geographic proximity to the border not only shape Mexican population consumption patterns but influence health care expenditures made by the Mexican-American population living in communities across the border on the US side (Manzanares 2015:46). This feature is another expression of such shared social environment.2
To provide insight into the recent T2D epidemic growth, the study of social determinants has become a key element. The recognition of strong cultural affinities shared by the population along the US-Mexico border, led to the identification of common health risk factors, particularly in the Texas-Mexico border region after pioneer binational studies conducted by the centers for disease control and prevention CDC emphasize the high prevalence of obesity in this area. (CDC, 2010).
Texas border population obesity over proportion (Fisher-Hoch et al., 2010) has been extensively documented. While the corresponding situation in the Mexican border side is currently facing increasing attention from a public policy perspective in states such as Nuevo Leon, Coahuila, and Tamaulipas. From a local perspective, less attention has been paid to expenditure consumption patterns and how these are linked with both mortality rates due to T2D or health care expenditures at the household level.
In México, this awareness has resulted in a pioneer set of regulations released in july 2014 (Salud, 2014), this regulation strategy points out to a basic concept: information availability via mass media for products classified as non-healthy and a set of caloric intake and total energy content labeling standards.
Notwithstanding a common hypothesis found in the literature considering the relationship between diet and health in the border communities refers to the lack of affordable, healthy food items to integrate a diet (Tisone et al., 2014), the present study departs from this view and proposes that deliberate decisions made by individuals reflecting their preferences contribute to explain health outcomes related to T2D.
In this instance, even though budget allocation processes may reflect individual choices and willingness to pay, these processes are also determined by information quality about the products properties (Florence, 2011). These attributes are often outside the consumer domain and rather attached to the cultural context in which the individual interacts. Therefore, to explain T2D epidemic, and to conduct an effective prevention campaign, the location may be an important element to consider along with expenditure patterns. In this study, it is argued that in border communities cultural frameworks collide and a mixture of consumption practices result, given the influences of two often different systems of values, therefore, location is seen as a relevant determinant of consumption decisions.
The aim of the study is to analyze the relationship between consumption patterns and T2D mortality rates from a geographic perspective with a focus in Coahuila, a Mexican state on the border with Texas. Expenditure patterns are inferred using micro data from the national household expenditure survey 2012 while mortality data comes from the National Health Information System SINAIS 2012. Using this information T2D age-adjusted mortality rates are estimated for every region in the state and a set of socioeconomic covariates are explored including educational attainment levels, health care insurance status and occupational characteristics depending on the content of physical activity implied by the type of job.
By using this approach I intend to offer a complementary view about the possible social causes that relates to this public health threat at the US Mexico border region.
Previous studies
Type II diabetes social determinants constitute a relevant research area in the Texas-Mexico border region given its epidemic growth during the last decade. Despite traditionally overshadowed by a clinical approach, that is rather oriented towards explaining biological determinants at the individual level, economic factors such as consumption patterns and social eating behaviors frequently associated with information available through food advertisement and marketing (Patrick and Nicklas, 2005) are increasingly gaining importance to encourage prevention strategies from a public health perspective.
Two extensively documented behavioral risk factors in the literature concerning T2D are inadequate diet (Wali et al., 2014) and lack of physical activity (Aguiar et al., 2014). Both factors with deep social implications. In the first case, unhealthy lifestyles associated with diets containing energy dense foods that negatively affect the metabolic energy intake-expenditure balance had been linked to a relative greater availability of low price per calorie processed foods at the community level (Ortiz-Hernández, 2006), as well as with an increased availability of beverages with added sugar.
This food market feature, as can be expected, may be exacerbated on poverty settings, yet, consumer's preferences are also formed by the way individuals process available information about food items. Hence, an important element to consider explaining consumption patterns relates to individuals educational background.
Mexican American population at the Texas-México border offers a paradoxical view regarding T2D. This population segment is often characterized by higher poverty incidence (US Census, 2012) despite this fact, their health status as measured by key health indicators such as infant mortality, life expectancy, mortality from cardiovascular diseases, mortality from major types of cancer, and measures of functional health (Kyriakos, 1986) is generally regarded as being closer to the white not Hispanic population rather than to the African American population, a demographic group with a stronger affinity at the income level. However when T2D is considered an important exception to this paradox emerges, and it occurs at a disproportionately higher rate for the Mexican American population (Martorell, 2005, West et al., 2001, Texas Health Insitute, 2010), Why? A vast amount of research has documented the higher T2D rates among the MexicanAmerican population living in communities along the Texas-Mexico border, with pioneer studies conducted during the seventies (Kyriakos, 1986); the key findings from these research efforts, strongly emphasize biological (genetic) risk factors, together with an important condition: obesity; which in turn, as Weinsier et al. (1998) among others demonstrates, is directly related to consumption patterns.
Therefore, consumption appears to be a relevant argument to understand the epidemic. This process reflects the way in which border residents integrate their diet facing the availability of high energy and caloric content food items often denoted as unhealthy.
Moreover, economic measures particularly on the side of fiscal policy, have been adopted in Mexico to control unhealthy consumption patterns, a recent example is the tax imposed on unhealthy food items approved after recognizing that price elasticity of demand for most of this products is greater than unity (Salud, 2014: 83). Regardless that evidence on health indicators from these and other similar measures is yet to be assessed, from a public policy perspective, recognizing the link between T2D epidemic and its social determinants appears to be gaining acceptance.
Regarding the lack of physical activity as a risk factor, scientific evidence provided by studies conducted during the nineties (Weinsier et al., 1998) suggest that reduced physical activity is the most important current factor explaining the rising prevalence of obesity, a T2D key determinant in westernized societies (Day and Bailey, 2011). Hence analyzing the association between T2D and social determinants such as occupational status according to its inherent physical activity environment may also prove useful to design preventive measures from a public health perspective.
Nevertheless until recently, on the Mexican side of the border, relative less attention has being devoted to studying the relationship between T2D and consumption patterns.Withal, research efforts are often limited to the main metropolitan areas of the country: Mexico city (Florence, 2011), Monterrey and Guadalajara and while some studies focusing on the border region with a binational perspective (CDC, 2010) sponsored by the Pan American Health Organization (PAHO), Centers for Disease Control and prevention U.S. (CDC) and Mexican Health Secretariat3 had been conducted, it can be argued that the US-Mexico Border is not homogeneous and cultural behaviors that may be common in communities along the lower Rio Grande Valley on the Texas-Mexico border, may be in stark contrast with those observed in areas such as Tijuana-San Diego. Accordingly, in the present study, I explore geographic proximity to the border considering local consumption patterns, this approach towards understanding this epidemic and deliver useful information to design custom prevention policies.
Statistical analysis
Data and methods: two main information sources are studied, data on consumption patterns comes from the 2012 release of the National Expenditure Household Survey (ENGASTO) an official source containing microdata explicitly developed by the National Institute of Geography Information and Statistics (INEGI) to follow consumption patterns. The 2012 micro data set is the first edition of ENGASTO which is a continuous survey released annually. To allow comparability from an international perspective this data source follows international standards corresponding to the Classification of Individual Consumption According to Purpose, COICOP, designed by United Nations Statistics Division.
The survey sample contains data at a state level and once the sample weight is applied it allows conducting statistical inference for individual states. In particular, Coahuila sample represents 790 911 households with a population of 2 852 165 individuals.
A second analysis stage relies on death records obtained from the National Health Information System SINAIS (2012), this database contains 55 variables including a cause of death that comply with the International classification of decease ICD 2010 and links this key variable to other 27 characteristics specified at the person death certificate, including geographic identifiers. The 2012 national database contains 602 354 records, with 15 200 death records for Coahuila state.
Statistical analysis is organized into exploratory data analysis (EDA) and an inferential stage. For EDA, density functions based on a Gaussian kernel estimators are built to detect consumption patterns across selected food items.
To study T2D trends in time and spatial distribution, a geographic concentration measure called local diabetes mortality index (LDMI) is constructed for every year in the period between 2004-2012.This measure compares diabetes mortality at a particular state relative to the observed national levels controlling for the relative population size in every geographic entity.
Results are complemented with a classic approach estimating age-adjusted mortality rates (AAMR), at several geographic scales including state, country and for every region within Coahuila. To study the association between social determinants and diabetes death, odds ratios OR are obtained by estimating a logistic regression model based on mortality records.
Results
Food items expenditure patterns
Over the last three decades, extensive literature has documented from a clinical perspective the importance of a healthy diet (Jensen and Sherman, 2014; Koloverou et al., 2014) as a prevention mechanism against chronic degenerative diseases development including T2D, yet evidence suggest that once T2D develops, a strict food regime should be followed in order to delay the rate at which complications arise, in particular regarding those associated with the cardiovascular system, (Kayal, 2011; Fowler, 2008).
According to the information released through the national expenditure survey 2012, 79.6 per cent of the households in the country reported expenditures on cola and flavored soft drinks, with an average annual household expenditure of $271.5, this figure represents seven per cent of the total household budget allocated food non-alcoholic beverages. The proportion allocated to this single item reveals a potential adverse consumption behavior considering that Division 01 from the Classification of Individual Consumption According to Purpose which refers to expenditures on food and nonalcoholic beverages and contains 232 food items. Another 47 per cent of the households reported purchases in food prepared by ambulatory vendors a common fast food that includes, tamales, tacos de canasta, burritos, tortas, camote enmielado o con leche, hamburgers and Hot-dogs, which are known to contain high fat concentrations, thus associated with adipose tissue formation. With an average annual expenditure reaching $317.6.
The Map 1 shows mean annual household expenditures for cola and flavored soft drinks across the 32 Mexican states.

Source: Data from ENGASTO INEGI 2012.
Note: estimation excludes households that did not report soft drinks consumption.
Map 1 Mean annual household expenditures on Cola and Flavored soft drinks as % of total expenditures in food and non-alcoholic beverages
It is found that the highest mean expenditures in the country took place in Nuevo León, $390.8 and Coahuila with $361. Nonetheless, when this amount is normalized as the fraction of total expenditures allocated to food and alcoholic beverages, Yucatan appears now as number one in the country by a marginal 0.05 per cent. Yet Nuevo Leon and Coahuila still rank as the nation's second and third place respectively, with their expenditures representing 12.8 per cent and 12.6 per cent, relative to total food expenditures, and these figures are 56 per cent higher than the national level.4
Figures on household food items expenditures in Coahuila are especially useful to understand the current T2D epidemic in this border State. Apparently this state population is integrating a diet loaded with fructose and refined sugar, both elements known to contribute to the formation of visceral adipose tissue. (Colditz et al., 1995; Kayal, 2011; Mokdad et al., 2003).
In turn, as has been demonstrated by clinical studies, approximately one-third of obese individuals exhibit a decrease in beta-cell mass caused by beta-cell apoptosis (Day and Bailey, 2011), a process which renders these individuals unable to compensate for their insulin resistant (IR) state and the resulting hyperglycemia, leading to a T2D diagnosis (Rochette et al., 2014: 2709).
Table 1 below, shows household level expenditure patterns for selected food items in Coahuila state. The contrast is clear when comparing annual expenditures and households share by item within the state.
Table 1 Coahuila annual mean household expenditures 2012. (Selected items)
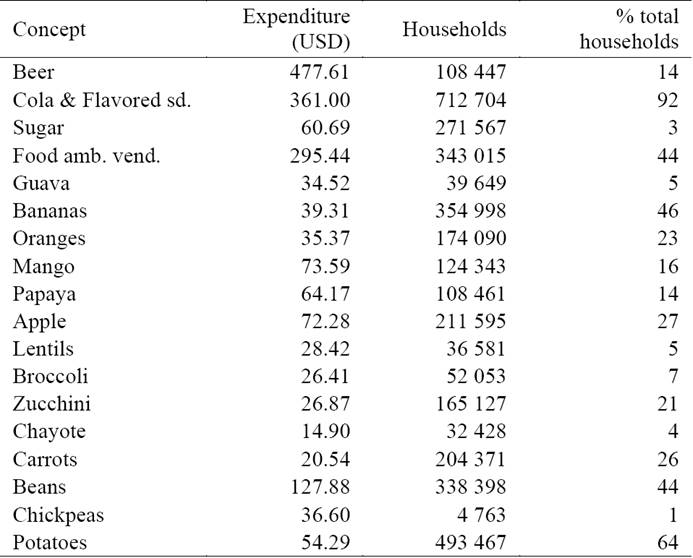
Source: estimations applying microdata from ENGASTO 2012. INEGI.
Note: codes based on the Classification of Individual Consumption According to Purpose, COICOP, recommended by ONU. A $12.95 Peso-dollar exchange rate considered as of september 2012.
Not only does Coahuila state households allocate the third largest annual average amount to purchase cola and flavored soft drinks in the country, but as Table 1 reveals, this preference is a widely spread practice, reaching 92 per cent of the total state households.
At the same time, it is found that average per household amount allocated to consume products which are known obesity contributors such as food prepared by ambulatory vendors and those containing high glucose levels such as sugar or cola and flavored soft drinks and beer (Salud, 2014) is 82 per cent higher compared to the combined amount dedicated to a variety of generally accepted healthy food items in the category of fruits and vegetables. The later basket integrated by Guava, Bananas, Oranges, Mango, Papaya apple, Lentils, Broccoli Zucchini, Chayote, Carrots, beans and, potatoes and chickpeas. The former reaching $1 195.36 and the latter amount being $655.13.
Whereas a commonly contended hypothesis to justify this pattern has referred an availability issue often linked to unaffordability settings (Popkin, 1994), a fact as shown by this particular data apparently is that Coahuila's population express a higher willingness to pay for some processed food items that are associated with an increased risk to develop T2D.
Likewise, an effective management involves a carefully designed strategy that places an emphasis on personal habits, and as has been extensively documented by diabetes behavioral determinants literature, diet becomes a key control element in this context. This focus on a diet does not deny the importance of biological risk factors, neither its implications to achieve a successful management strategy one this condition has been diagnosed.
Again, empirical evidence suggests that educational attainment levels (EAL) influence consumption patterns through the way in which individuals process information. To explore this peculiarity Figure 1 represents household expenditures using density curves split according to households head EAL as a proxy. Considering a healthy eating perspective, two representative food categories are examined: apples and food sold by street vendors.

Source: estimation using data from ENGASTO INEGI 2012.
Note: household's head educational attainment level. USD dollars.
Figure 1 Household expenditures by educational level. Coahuila State. a) Apples b) Food street vendors
In Apple's case, higher education households, tend to concentrate their expenditures above those with lower educational level, as we may expect considering the correlation between education level and household income, on the other hand when food sold by street vendors (an unhealthy alternative) is considered, the pattern changes and no longer does higher income households (with bachelor's degree) tend to consume significantly more than those households with lower educational level (elementary school).5
Nonetheless, affordability has been a traditional consumption driving factor, in this particular scenario, evidence suggests that education may influence consumer's preferences and purchasing decisions regarding diet.
Health care expenditures Patterns
T2D chronic nature becomes a relevant expenditure issue from the pecuniary point of view since it imposes a social burden not limited to the individual, this financial burden extends to the entire health care system indeed and its contingent to health care coverage types, which in turn reflect socioeconomic inequalities. Recent health care cost data by Rodriguez et al. (2010), estimate an annual per patient cost ranging between $2 740.3 and $3 550 US dollars,6 whether the patient presented complications or not (Rodriguez et al., 2010: 417).7
Despite financial aspects linked to TD2, achieving an effective treatment, given the metabolic imbalances taking place in the presence of hyperglycemia, a main metabolic process underlying T2D, a combination of behavioral changes together with the use of stage-specific medications is required.8
Early treatment stages, usually focus on insulin sensitizers, prescriptions containing Pioglitazone + Metformin a kind of Thiazolidinediones (TZDs) whose action allow lowering blood glucose levels (Ohira et al., 2014) by increasing the muscle fat and liver's sensitivity to insulin. This medication market value is $45.32, at 2012 prices. The second treatment stage generally adds an antihyperglycaemic such as Glibenclamide, this prescription is intended to stimulate the pancreas to produce insulin. Its market price being $18.93 per package considering the generic version, a low-cost alternative.
A third stage, aims to inhibit protein dipeptidyl peptidase-4 (DPP-4) which have a dual effect by increasing insulin amounts released in the body, and decreasing the amount of glucose produced (Sicras-Mainar and Navarro-Artieda, 2014), regular market value in 2012 for a 28 pill pack was $122.6 enough to last for a month considering a typical daily 100-mg pill dose.
At this stage, the treatment may include insulin to help blood glucose control; with a commercial cost of $13 per package of five cartridges. Among other features, clinical trials and management guidelines recommend insulin for patients who are not able to achieve metabolic control goals within a three-month time span, (Kuri et al., 2007: 67). Even so not all patients reach this stage, it has been estimated that a high percentage of patients diagnosed with T2D will require insulin during the next 5-10 years of their lives after diagnosis.
In order to identify insulin out of pocket expenses and the financial burden within Coahuila state health care system, the following table shows households who reported insulin expenditures by health care provider and mean annual household insulin expenditures in 2012.9
Table 2 Mean household expenditures by health care provider. Households with insulin expenditures. 2012 Coahuila

Source: estimations INEGI ENGASTO 2012.
Usually, active labor force population has access to public health coverage, via one of the main national health care institutions the Mexican Social Security Institute (IMSS) and the State Workers Social Security and Social Services Institute ISSSTE, however for those individuals who are consuming insulin in Coahuila, one in five isn't affiliated with any state institution, and still 12.2 per cent is affiliated with Seguro Popular a special coverage designed to provide health care to lower income families, this population segment represents a particular financial load that adds to the total T2D social burden.
There is also clear evidence of a wider financial load if we consider household mean annual health care expenditures that correspond to division six from the Classification of Individual Consumption According to Purpose (COICOP), a division that includes eight broad health-related categories including a group called pharmaceutical products in which insulin is recorded, Coahuila state bears the highest annual household health expenditures in the country: $1 220.00.
The Map 2 shows mean health annual household expenditure at the Texas-Mexico border states, an area known for its high T2D prevalence among the Hispanic population, (Texas Health Institute, 2010; CDC, 2010).

Source: INEGI ENGASTO 2012, Texas Health Institute.
Note: 2012 Prices. Division 06.
Map 2 Insulin expenditures as % of total health expenditures per household in Mexican border States with Texas. Diabetes population diagnosed by County in Texas, % of total population
The financial burden linked with T2D reflects underlying social disparities and suggests a complex challenge for the health system. Traditional health care institutions in the country such as IMSSS or ISSSTE already face financial constraints, according to estimates by Rodriguez et al. (2010), T2D total cost at the biggest health care institution in the country, Mexican Social Security Institute (IMSS), accounted for 3.1 per cent of their total programmable budget during 2000-2004.
Hence, controlling T2D epidemic growth translates into a public health priority with broad social benefits, in particular, a focus should be placed in areas of the country such as the northeastern states were evidence reveal that behavioral practices related to consumption and diet patterns constitute a key social determinant.
Diabetes mortality
In order to distinguish T2D geographic distribution and detect spatial concentration patterns, both across time and within Coahuila state five regions a relative mortality index called Local Diabetes Mortality Index (LDMI) is built. This is a measure nested on principles from economic locational indicators research developed in the regional analysis context and given its geographic approach is a measure that has been considered in health related fields such as biostatistics and empirical epidemiologic studies, efforts by Beyene and Moineddin (2005), Moineddin et al. (2003) or Wright (1994) provide contributions to this research line.
The following LDMI specification is constructed for every year in the period 2004-2012 to determine T2D mortality behavior across time:
Diabetes records based on the international classification of disease 2010 ICD-2010 codes E100-E149 are analyzed relative to mortality in all other disease categories. This measure compares the state level j to the national level N and may take two important benchmarks, a LDMI > 1 denote a higher mortality rate in a particular state relative to the national level. Whereas an LDMI < 1 expresses a lower concertation at location j relative to the national level. Following this criteria, any LDMI = 1 imply that both geographic areas have the same diabetes concentration levels. Figure 2 show the results.

Source: estimation using data from SINAIS 2004-2012.
Figure 2 LDMI. Texas-Mexico border States and selected Mexican southern states. 2004-2012
Using this approach, reveals a higher Coahuila T2D mortality relative to the country with an increasing trend particularly after 2008. To determine what social determinants other than diet and consumption patterns influence this trend? Is an issue that deserves supplementary research. An important T2D risk factor that links key social behaviors and should not be dismissed despite the fact that it has been extensively documented is obesity. According to the national health and nutrition survey, ENSANUT 2012,10 the northern region which includes Coahuila and Tamaulipas states present the highest type 1, 2 and 3 obesity rates in the country (Barquera et al., 2012: 155).
It can be argued that Coahuila's state age population structure generate a bias regarding the LDMI patterns depicted by Figure 2, however in order to control for this issue a contrast for diabetes death age distributions is performed using a Kernel density function this allows to distinguish differences between Coahuila age distribution and the corresponding national age structure.
First, the resulting age distribution (right Figure 2) in fact, indicate a possible bias affecting the LDMI estimation, since diabetes deaths concentration in Coahuila tends to be higher than the national between 60 and 80 years, this feature translates into an LDMI overestimation. In order to control for the population structure age-adjusted mortality rates per 100 thounsand individuals is estimated following the standard direct method approach and distinguishing between males and females rates at the following geographic scales: the national level, Coahuila state and within the five state's regions. Results are shown in Map 3 below.
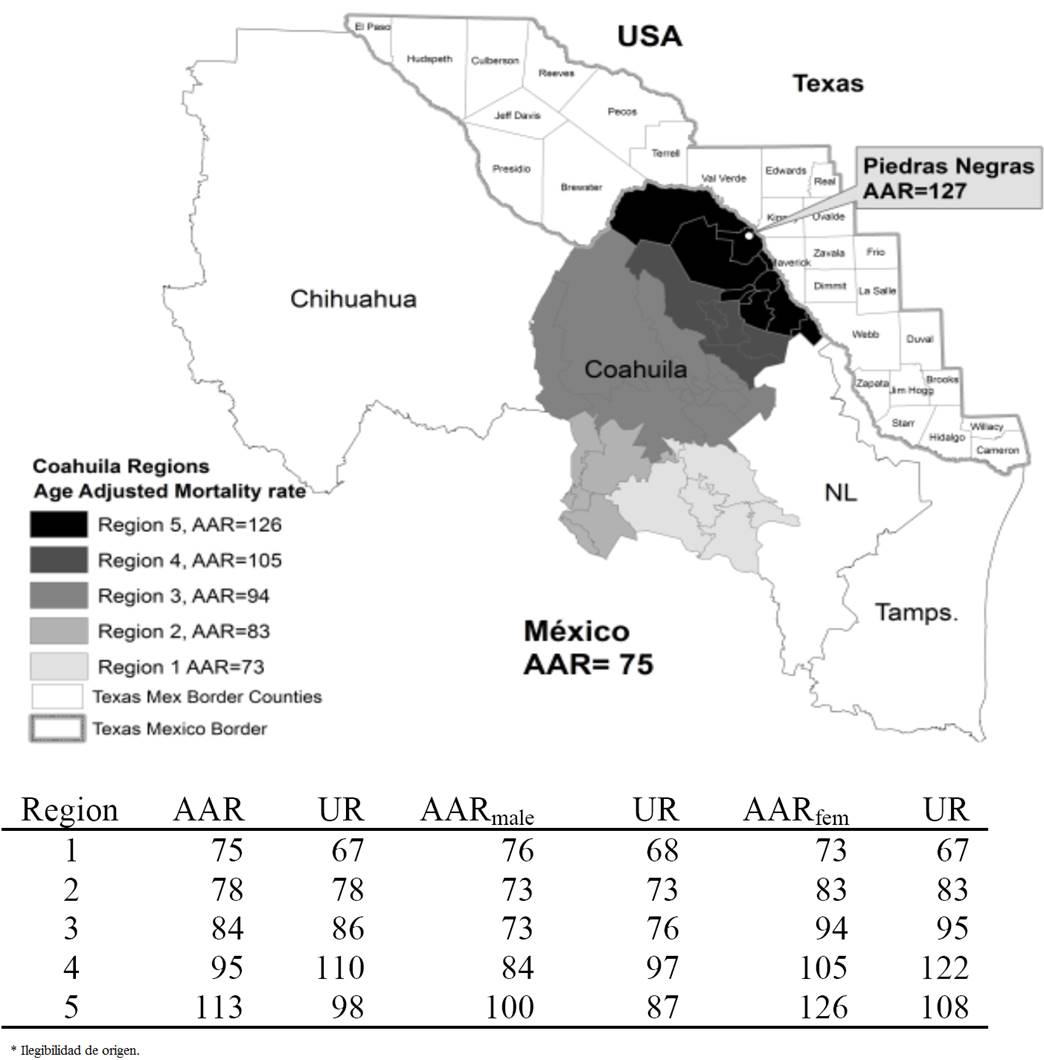
Source: Data from National System of Health SINAIS 2012.
Note: UR = Unadjusted raw mortality rate. Rates per 100 thounsand.
Map 3 Diabetes Age-adjusted Mortality rates. Coahuila state Regions. 2012
Secondly, death age distribution reveals significant negative social impacts connected to T2D in Coahuila, the average death age for a patient with T2D in Coahuila is 68 years this represent on average seven years of potential life loss.
Additionally, diabetes age distribution exposes that one in four diabetes patients in this border state is dying prematurely at an age of 59 or younger fact that reflects both a social impact and the need to implement public policy at the prevention level.
Other adverse social effects for these border communities such as productivity losses are evident from this data since 55.6 per cent of the registered deaths occurred at an age of 59 or younger in Coahuila were classified as not participating in the labor force anymore; this issue points to new research lines regarding T2D social impacts, nonetheless, this subject is beyond the scope of this work and will not be developed further.
An important pattern arising from the age-adjusted mortality rate is that not only does the previous trend is confirmed with a higher diabetes mortality rate in Coahuila relative to the national level, besides is now clear that as we move closer to the Texas Border within the state, we found higher diabetes mortality rates, reaching the highest levels in the region covered by the following municipalities Acuña, Jimenez, Piedras Negras, Naval, Villa Unión, Zaragoza, Morelos, Allende, Guerrero, and Hidalgo, all municipalities at the Texas-Border region.
In order to study the relationship between border proximity and diabetes mortality rates inferential analysis is performed constructing a logistic model to estimate Odds ratios OR for diabetes death controlling for five socioeconomic variables including whether the individual was a Coahuila border resident. The regression considers the 2012 public mortality records provided by SINAIS which originally contains 602 354 cases, though after adjusting the model for missing values at every control variable included, 356 557 records remain for the final model specification. During 2012, there were 85 055 reported deaths in Mexico due to diabetes with an estimated 75 persons per 100 thounsand age-adjusted mortality rate.
The model specification analized is:
Dichotomous variable diabetes indicates whether or not this is the patient's reported cause of death, applying definitions given by the international classification of disease in codes E100 through E149, it takes values 1 in a positive case, 0 otherwise.
The following independent variables are analyzed as well:
Sex with values 1: Male (base category), 2: Female; age group with categories: 0-19, 20-29, 30-39, 40-49, 50-59, 60-69, 70-79 and +80. 30-39 being the base category.
Border: 1 if the individual is a register Coahuila-Texas border resident, 0 otherwise as the base category.
Educational attainment: without schooling as the base category, Incomplete elementary, Elementary, senior high dropout, Senior high, High school dropout, High school, Bachelor's, Postgraduate, Not specified.
Healthcare institution: 1 without medical coverage as base category, 2: IMSS, 3: ISSSTE, 4: Seguro popular. Occupation: Education workers, Management position, Truck drivers and mobile machinery operators, Administrative workers intermediate level, Administrative Workers lower level, Not employed and Agriculture workers as the base category. Table 3 and Figure 3 presents results.
Table 3 Logistic regression. Diabetes deaths 2012.

Source: estimation using data from SINAIS 2012.
* Statistically significant coefficient at α = 0.05

Source: Estimation using data from SINAIS 2012.
Figure 3 Diabetes death predicted probabilities by sex and residence place, (down). Male vs. Female Probabilities contrast at National level (up)
Discussion and conclusions
The Texas-Mexico border represents a particularly relevant case regarding the T2D prevalence, and while this geographic area is already considered as an epidemiological unit, evidence suggests that growing T2D mortality trends represent a public health challenge not limited to the health care system.
From a public health perspective, one of the challenges already identified by health officials to manage T2D epidemic is effective implementation of preventive strategies. To achieve this goal, empirical evidence analyzed in this work suggest that social determinants become a central component, in particular when behavioral risk factors such as consumption patterns and diet are examined in a geographic context, potential preventive measures at a local level emerge.
While more investment in health infrastructure may contribute to managing T2D prevalence, and certainly more physicians will be useful to detect new cases and more blood glucose readers may help inform patients their biological markers towards T2D, this work argues that it is important to tackle the causes of the causes.
That is, why are some individuals in these communities showing increased glucose blood levels? (a biological marker for T2D from a clinical perspective). What is the fundamental cause of this cause? From a social perspective, in this work, it is argued that economic factors related to consumption are important determinants.
A relevant question to contribute in designing effective preventive strategies is: what social behaviors are linked with this T2D trend? Studying T2D geographic distribution aims toward explaining this public health threat. Several authors, including the prominent work by Wilkinson and Marmot (2007), during the last decade, provide a solid case towards the social determinants of health paradigm in which the classic epidemiological approach, focused mainly on clinical observation can benefit from the social perspective.
The present work draws a specific connection between geographic proximity to the border, local consumption patterns and mortality data in a first effort to understand underlying diabetes social determinants for Coahuila.
Results indicate that location is a key T2D deaths determinant in this particular case and significantly higher rates were found for municipalities at the Coahuila border region with OR = 1.44 CI 1.251.66.
Although results allow emphasizing the argument for policies oriented to improve information quality on food items; the argument regarding healthy food items affordability explored by Tisone et al. (2014) and others, could not be dismissed and is rather proposed as an active research line for additional studies.
Currently, the recognition of social determinants behind this epidemic is claiming special attention in México and has led to the implementation of specific regulations, including fiscal measures, on the other hand to build effective intervention strategies, given the complexities arising in a social setting such as the US-Mexico Border where two different systems of cultural values collide, a multidisciplinary approach with a local level perspective can contribute to control this public health threat.
It appears important to evaluate cultural frameworks and learned habits in relation to healthy lifestyles at the US-México border, despite individuals genetic structure, which is a valuable approach on its own right.
In this regard, it is suggested that preventive strategy design may improve by incorporating insights from the social determinants paradigm to cover the lack of information on T2D epidemic at a local level.

