


 nova página do texto(beta)
 Inglês (pdf)
 Artigo em XML
 Referências do artigo
 Enviar este artigo por email
 Citado por SciELO
  Similares em
SciELO
Similares em
SciELO 
 Permalink
Introduction
Population projections are one of the most important demographic techniques for decision-making. With them, policy makers have a quantitative reference for allocating resources efficiently. Since the first population projections done by Edwin Cannan in 1895 for England and Wales, the cohort-component method has been the most widely used population projection technique. It consists in projecting each demographic variable (mortality, fertility and migration) separately and then, with the outputs and using the balancing equation of population change, the total population is projected by age and sex. Along this process, some subjective assumptions have to been done to extrapolate the levels and trends of each demographic variable.
To assess the likelihood of such projection, some variants are calculated simulating extreme scenarios of population growth but them have strong conceptual and statistical issues (Lee, 1998; Keilman et al., 2002). According to Shripad Tuljapurkar a probabilistic population forecasting is the most honest way to inform what we know and what we do not know about the population dynamic of the future. It is also a better way to indicate the risk of decision making related with population issues (priv. comm., June 27, 2013).
Since late 1960's some probabilistic methodologies has been proposed to solve these problems (Sykes, 1969; Le Bras, 1971; Saboia, 1978, 1977; Heyde & Cohen, 1985; Cohen, 1986; Alho and Spencer, 1985; Alho, 1990; Alho and Spencer, 2005; Lee, 1993, 1974; Lee and Carter, 1992; Lee and Tuljapurkar, 1994; Lutz, Sanderson and Scherbov, 2004; Hyndman and Booth, 2008). Usually, probabilistic projections have been made for developed countries, where migration is mainly influenced by immigration flows. But, when a probabilistic forecast is applied to a developing country, usually migration is mainly influenced by emigration and the final output in the total population forecast by age could results in negative figures (mainly in the lower prediction intervals).
In this context, when the components of population dynamic are forecasted, the international migration represents a methodological challenge. Usually, experts recommend keeping migration rates constant along the forecasting horizon. It is the best bet when we do not know anything about the intrinsic dynamic of this variable. In the last U.N. World Population Prospects 2010 two assumptions were stated about future net migration: in the first (called normal migration assumption) the projected levels of net migration are kept constant until 2015 when it is assumed that net migration will gradually decline, and in the second (called zero-migration assumption) the international migration for each country is set to zero starting in 2010-2015 (UNPD, 2012: 12). On the other hand, some national population bureaus try to guess a trend. For example, the last population projection, made by the Mexican National Population Council (CONAPO), assumes that net migration will rise again to the levels reached in 1995 in the long run, which is quite controversial (CONAPO, 2012: 88).
Nevertheless, in some developing countries there are reliable information about migration or it is possible to estimate it indirectly. This is the case of Mexico. The most reliable recent estimation of the Mexican population (SOMEDE, 2011) is used to apply the method proposed in this paper. In such estimation, the Mexican international migration comes from both the Mexican and the U.S. census from 1970 to 2010, the Mexican demographic surveys of households and the American Community Survey (ACS) for several years. The immigration flows come from Mexican data sources and the emigration flows come from U.S. data sources (the emigration flow to other countries different than U.S. comes from Mexican data sources, but it is relatively small). Four kinds of migration flows are accounted: The Mexicans who go for living to U.S., those no-born in Mexico who go from Mexico to U.S., those (Mexicans and non-Mexicans) who go to live to other country different than U.S. and the immigrants to Mexico (included the return flows) (SOMEDE, 2011: 85).
Some procedures were used to fit, correct (mainly for digit preference) and smooth the information. The final result is presented by sex and single age yearly for period 1960-2010 as it is shown in Figures 1 and 2 (SOMEDE, 2011: 86-89). According to such results female and male net migration have been affected mainly by emigration flow. In the whole period, the net migration has been negative. Just very recently (from 2005) we find positive figures in the first ages, mainly because the return of families and children born in foreign countries (mainly in U.S.) from Mexican parents.
Source: Own calculations based in SOMEDE (2011).
Figure 1 Female net migration by age and year, Mexico 1960-2010.
Source: Own calculations based in SOMEDE (2011).
Figure 2 Male net migration by age and year, Mexico 1960-2010.
Figure 1 shows female net migration by single age and year from 1960 to 2010. The net result of migration flows in such period starts with a loss of 14 740 people in 1960 and it ends with a loss of 346 852 people in 2000 -its highest historical level in absolute values- it increased around 24 times in 40 years. From 2001 to 2010 Mexico lost fewer people than before. In 2001 the loss of female population was 251 350 people and in 2010 such loss was around 35 195 females. As the figure shows, the historical age-pattern is concentrated in children and working ages.
On the other hand, Figure 2 shows male net migration by single age and year from 1960 to 2010. The net result of migration flows in such period starts with a loss of 13,704 people in 1960 and it ends with a loss of 424,347 people in 2000 -an increase of almost 31 times in 40 years-. In 2001 the loss of male population was of 305,475 people and in 2010 such loss was 5,654 males -six times fewer than women-. Like women net migration, the historical age-pattern of male net migration is concentrated in children and working ages.
In the last years, Mexican migration to United States has decreased unexpectedly by several causes: According to Passel,
[t]he standstill appears to be the result of many factors, including the weakened U.S. job and housing construction markets, heightened border enforcement, a rise in deportations, the growing dangers associated with illegal border crossings, the long-term decline in Mexico's birth rates and broader economic conditions in Mexico (Passel et al., 2012: 6).
These factors were unpredictable at the beginning of 21st century, when migration from Mexico to U.S. was at its highest levels: in 2000, the annual immigration from Mexico to U.S. was around 770 thousand people and in 2010 it drops down to 140 thousand per year approximately (Passel et al., 2012: 8).
The migratory phenomenon is very complex and it depends in many exogenous and highly uncertain factors. The past population projections could not foresee the strong impact that the recent world economical crisis would have in the demographic dynamic, mainly in the migration component.1 That happened because the method in which they are based does not take into account the migration's inherent uncertainty that arises from such complexity mentioned above.
In literature we find very few works about forecasting migration stochastically; it contrasts with the huge amount of work to forecast mortality (e.g., Lee and Carter, 1992; Wilmoth, 1993; Booth et al., 2002, 2005, 2006; Booth, 2006; Miller and Lee, 2004; Hyndman and Booth, 2008; Hyndman and Ullah, 2007; Girosi and King, 2006; García-Guerrero and Ordorica, 2012; among too many others) and fertility (e.g., Lee, 1993; Hyndman and Booth, 2008; Hyndman and Ullah, 2007) in a probabilistic way. The reason of this is the lack of long reliable migration time series by age and sex.
In the above literature we also find two kind of recent approaches: Those that forecast total migration amounts (Miller and Lee, 2004; Bijak, 2011; De Beer, 1997) and one that do it considering the age and sex structure (Hyndman and Booth, 2008). The main lack of the first kind of approach is that if it is required an estimation of migration's age pattern, then it is necessary to set some assumptions about such age pattern. Usually, the model proposed by Rogers and Castro (1982) is used to solve this issue.
In the second kind of approach we find the works of Lee and Tuljapurkar (1994) and the work of Hyndman and Booth (2008). The main goal of those two papers was forecasting the total population by age and sex by the cohort-component method. Lee and Tuljapurkar limited their work to use the U.S. Census Bureau's migration projections -which are deterministic- and Hyndman and Booth propose a method where they forecast stochastically the international migration by age and sex using a functional data perspective. Hyndman and Booth estimate net migration using the residual of the demographic growth-balance equation and then they fit it according to the coherent functional model to demographic data just as they do it with mortality and fertility (Hyndman, Booth and Yasmeen, 2013).
The present paper is ascribed to this general theoretical line attempting to contribute to the related methodological discussion.
In this context, the aim of this paper is to propose a method for modeling and forecasting migration by age and sex consistently with the whole population dynamic. This forecast assess the uncertainty related with net migration, emigration and immigration, and it can be used as an input for total population forecasts -by age and sex-. This model does not depend of other data sources than the volume of migration by age and sex.
Methodology
Following the ideas of Lee (1993)), the historical levels of net migration by age and sex are a linear function which depends of three unknown parameters: the net migration index, gt, which is only time-dependent with tε[1,n]; the age schedule of net migration ax for xε[0,ω+], where ω+ is the last open age group, and the migration intensity at each age, b x. Then, the net migration by age and sex is defined as2
this expression is based on the well-known Lee-Carter model (1992). To guarantee that equation (1) is unique, it is necessary to constraint it to
Thus, the age schedule can be calculated as the average net migration along time,
for each xε[0,ω+].
The net migration index is obtained summing over all ages the vector formed by subtracting the age schedule from the net migration vector at time t. Mathematically,
for each tε[1,n].
Finally, to estimate the migration intensity, equation (1) is solved by ordinary least squares. It is,
for each x ε [0, ω+].3
The total net migration (NM) for each year is the sum over all ages of the equation (1), that is,
Where
is the mean historical net migration. Then, transforming logistically NM it is possible to incorporate two prior constrains.That is,
where L and U are the lower and upper bounds (Alho, 1990: 524) of total net migration -they will be also called lower and upper migration sustainable levels (MSL) respectively-, and zt is called modified net migration index4
Now the issue is to find appropriate values for the MSL. As a rule of thumb we can set that if the main historical migration flow has been emigration, then L = min (NMt) and U = -min (NMt), and if the main historical migration flow has been immigration, then U = max (NMt) and U = -max (NMt) or L = 0. This rule is easy to apply when the MSLs are close to their limit, but if the historical minimum is quite far from such limits then a nonlinear optimization method could be used (like the Levenberg-Marquardt nonlinear least-squares algorithm found in the R-package minpack.lm). Furthermore, if our knowledge about the constraints is limited "but rather leads to some probability distribution [...] estimation could be carried out using Bayesian methods" (Lee, 1993: 192).
After the estimation process, the main task is forecasting the modified net migration index as a time series process using the Box and Jenkins approach (Chatfield, 1989).
Results
Parameter estimation and forecasting
Following the method described in section 2, the parameter that determines the trend, age pattern and intensity of net migration are shown in Figures 3 and 4. The coefficient of determination is for females and for males.
Source: Own calculations based in SOMEDE (2011).
Figure 3 The three parameters estimated according to equations (2), (3), (4), Mexico, females.
Source: Own calculations based SOMEDE (2011).
Figure 4 The three parameters estimated according to equations (2), (3), (4), Mexico, males.
Such age pattern indicates that migration has an intrinsic labor character and because familiar reunification, it is intensified in the first ages of life. Moreover, the intensity parameter indicates that net migration is strong in labor ages. Finally, the trend parameter indicates that such trend is descendant but it is quite hard to say that such trend will continue falling down continuously. That is because of the high volatility of migration phenomenon and the recent changing trend.
For model (6), the predefined bounds (sustainability limit levels) are set as L = 500 000 and U = 500 000 for males and L = -400 000 and U = 400 000 for females. The lower bound refers to the maximum level of negative net migration that the Mexican demographic dynamic can support.
After its estimation the modified net migration index is modeled and forecasted as a time series process.5 For males, the best fit was a random walk ARIMA(0,1,0), that is
with
For females, the best fit was an integrated moving average process ARIMA(0,1,1), that is
With
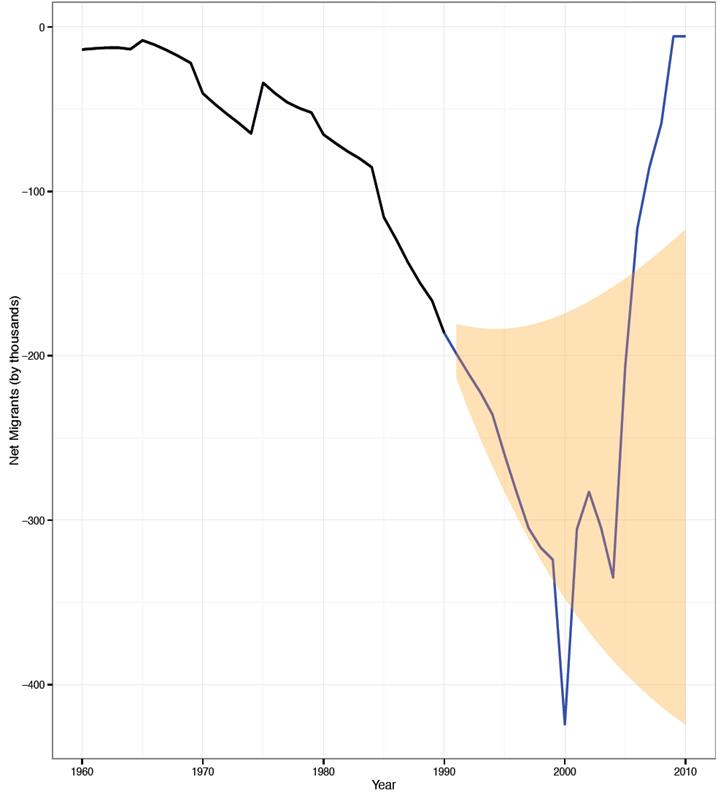
This model implies that in the median the net migration remains without change along the projection horizon. That is because the model errors are independent and identically distributed random variables, its distribution is assumed normal with zero mean and the variance mentioned above. In Figures 5 and 6 the female and male net migration estimated and forecasted are shown respectively with its 95 per cent prediction intervals. The gray lines are a sample of the ten thousand simulations and blue lines are the percentiles 2.5, 50 and 97.5.
Source: Own calculations based in SOMEDE (2001).
Figure 5 Net migration estimated 1960-2010 and forecasted 2011-2050, females, Mexico.
Source: Own calculations based in SOMEDE (2011).
Figure 6 Net migration estimated 1960-2010 and forecasted 2011-2050, males, Mexico.
Note that in both cases, the prediction intervals are wider than one could expect, but it only reflects the high degree of uncertainty of Mexican net migration. By other side, as it was noted before, in the median the net migration remains constant at the last level estimated.
The differences between female and male median net migration forecast is that the latest remains constant and closer to zero than the first. Other difference is that males' net migration prediction interval is wider.
On the other hand, the procedure described before was repeated for emigration and immigration separately, also by age and sex. The lower bound was fixed in zero for both sexes and the upper bound was fixed in one million for males and 800 thousand for females. The best time series model for the modified emigration index is a random walk. For female emigration the coefficient of determination was R2 = 0.96 and for males it was R2=0.936. The model´s variance is
Thus, as it is shown in Figure 7 males' emigration uncertainty is wider than females. Actually, both 95 per cent confidence intervals did not reach their respective upper bounds even in the long run.
Source: Own calculations based in SOMEDE (2011).
Figure 7 Total emigration by sex, Mexico 1960-2050.
For immigration the same procedure and the same lower and upper bounds were used. The best time series model for the modified emigration index is also a random walk. For female emigration the coefficient of determination was R2= 0.98 and for males was R2 = 0.98 Their respective model's variance is
Male immigration uncertainty is wider than female's, like in the emigration, Figure 8. But 95 per cent confidence intervals almost reach their respective upper bounds even in the long run. This behavior reflects that immigration is more volatile than emigration for three reasons: the intrinsic variability of each migration flow, the uncertainty in its data quality and in the method of estimation.
Calculating both the net-migration by single-age and sex, its 95 per cent and 67 per cent predictive intervals (orange and yellow shades, respectively in Figure 9) the prediction intervals are also wider for males than females and they are also wider as the forecasted year is far away from base year. Other characteristic of the single age net migration forecast is that in the median it remains negative except in the very first ages. It means that in the future it is likely the predominant migration flow remains been dominated by the emigration.
Source: Own calculations in SOMEDE (2011).
Figure 9 Mexico's net migration by single-age and sex for three selected years, and its 95% and 67% prediction intervals (orange and yellow shades, respectively).
Similarly, in the future emigration and immigration by single-age and sex (Figures 10 and 11) the prediction intervals are also higher and wider for males in working ages than females. They are also wider as the forecasted year is far away from base year. The prediction interval width is very similar in early ages for same years. The only exception is in 2050 when the prediction interval in females younger than 15 years old is wider than males. On the other hand, prediction intervals are relatively wider for emigration than immigration for both sexes.
Source: Own calculations in SOMEDE (2011).
Figure 10 Migration from Mexico by single-age and sex for three selectedyears, its 95% and 67% prediction intervals (orange and yellow shades, respectively).
Source: Own calculations in SOMEDE (2011).
Figure 11 Immigration to Mexico by single-age and sex for three selected years, its 95% and 67% prediction intervals (orange and yellow shades, respectively).
Testing the predictive power
With the aim of assess how well the model captures migration's uncertainty we repeat the forecasting procedure described above assuming a shorter period of time, in this case we choose the period 1960 to 1990. Then we forecast the migration from 1991 to 2010 and see if the observed values between 1991 to 2010 fell into the 95 per cent prediction interval. With this test it is possible to assess the model for short, mean and long horizon.
After the estimation procedure described in equations (2) to (6), the modified net migration index is modeled and forecasted as a time series process. The coefficient of determination is R2 = 0.98 for females and R2 = 0.92 for males.
For males, the best fit was an autoregressive integrated moving average process ARIMA(1,1,1), that is
with
For females, the best fit was an integrated autoregresive process ARIMA(1,1,0), that is
With
Figures 12 and 13 show the estimated level of net migration and the prediction interval of 95 per cent for females and males, respectively. In these figures, it is clear that females' model is better than males'. So it is possible to state that the model forecasts well in short, medium and long terms.
Source: Own calculations in SOMEDE (2011).
Figure 12 Prediction power test for female net migration forecast model. Mexico 1990-2010.
Source: Own calculations in SOMEDE (2011).
Figure 13 Prediction power test for male net migration forecast model. Mexico 1990-2010.
In the case of female net migration, in short term the estimated values are over the upper prediction limit but just for around five thousand people. At the end of the forecasting interval the estimations are over again the upper prediction interval but just by few hundreds people.
In the case of male net migration, the model looks like less able to forecast rare events. A preliminary proof of it is that both the highest historical level and the lowest are outside de 95 per cent prediction interval (representing the 20 per cent of forecasted years).
So it is possible that those rare events were completely out of sight of the model and because Mexican migration is stronger in males than females the uncertainty is higher in them. It means that males are exposed to more rare events than females -at least with the information we have-.
Similarly, after estimation procedure described in equations (2) to (6), the modified emigration index is modeled and forecasted as a time series process. The coefficient of determination is R2 = 0.99 for females and males.
For both sexes, the best fit was a random walk with an estimated variance of
Figure 14 show the estimated level of emigration and the prediction interval of 95 per cent for females and males, respectively. In this figure, it is clear that females model is a little bit better than males'. The only issue with male's model is the out-layer in 2000.
Source: Own calculations based in SOMEDE (2011).
Figure 14 Prediction power test for emigration forecast model. Mexico 1990-2010.
Finally, the modified immigration index is modeled and forecasted as a time series process. The coefficient of determination is R2 = 0.98 for females and males. For both sexes, the best fit was also a random walk with an estimated variance of
Figure 15 show the estimated level of emigration and the prediction interval of 95 per cent for females and males, respectively. In this figure, it is shown that the model forecast very well the immigration to Mexico.
Discussion and final remarks
The model here proposed is inspired by the previous work of Lee (1993) and it is based in a logistic function. It allows constraining the main function -the total net migration, immigration or emigration- to certain bounds.
This is a key to forecast migration consistently with the population dynamic, specially in migration context where emigration is the dominant flow. If migration is forecasted regardless its impact on the entire population dynamic -according to the balancing equation of population change- then it is possible to get negative figures, which is senseless. That means the model here proposed allows getting sustainable migration levels for the entire demographic dynamic.
One of the main advantages of this model is that it allows to model and forecast each migratory phenomenon separately or the net migration. One of the limitations is the way of estimating the MSLs. Here we used a heurist which uses the experience of the demographer about this phenomenon. But we recognize that further research is needed with the aim of offer an objective way of estimating such parameters.
One of the most interesting results is that the best time series model for migration is a differentiated moving average random process -i.e. an ARIMA(0,d,q) -. It means that, in average, it is better to forecast net migration without change than assuming some future fluctuation -thinking in a deterministic way. For a moving average process with one difference -without a drift-, the trend is determined by its order -q- so after q-years in the future, all the uncertainty will be concentrated in a purely random process with zero-mean. It means that after q-years the trend is constant along the forecasting period (Chatfield, 1989: 31-35).
The uncertainty associated to Mexican migratory phenomenon is pretty high but for sure the method here proposed helps to assess the whole uncertainty of population dynamic. After testing the predictive power of the method we conclude that it models and forecasts very well the net migration. Some improvements could be made, for example, using a Bayesian approach to model and forecast the modified migration index' sustainable limits. This model is also applicable to immigration and emigration separately. Other interesting developments will be mix the method here proposed with the functional data perspective.

