


Servicios Personalizados
Revista
Articulo
 Inglés (pdf)
 Artículo en XML
 Referencias del artículo
 Enviar artículo por email
Indicadores
-
 Citado por SciELO
 -
 Accesos
Links relacionados
-
 Similares en
SciELO
Similares en
SciELO
Compartir

 Permalink
Papeles de población
versión On-line ISSN 2448-7147versión impresa ISSN 1405-7425
Pap. poblac vol.13 no.51 Toluca ene./mar. 2007
The many Mexicos. Stochastic forecast 2001-2050*
Los muchos Méxicos: proyección estocástica 2001-2050
Katja Kesseli y Carlos Galindo
University of Helsinki/ Netherlands Interdisciplinary Demographic Institute
Abstract
Demographic data from Mexico has serious problems of coherence. Most recent estimations are increasing the discrepancies instead of reducing them. Based on analysis of inconsistencies in demographic data, we made a stochastic forecast of Mexican population for the period 2001-2050. The stochastic forecast is composed of random simulations of four different scenarios, which are given by dissimilarities on demographic estimations of the period 1985-2000. This technique allowed us to take into account the uncertainty embedded in Mexican data. Our results imply that is very unlikely (probability 0.07) that Mexican population size in 2005 was lower than 103.2 millions as published in the recent official population count. This result adds up to requests made by other researchers about revisiting and composing consistent demographic estimations.
Key words: stochastic forecast, consistent demographic estimations, data evaluation, Mexico.
Resumen
La información demográfica en México presenta problemas de coherencia. Las estimaciones más recientes incrementan las discrepancias en lugar de reducirlas. Basados en un análisis de las inconsistencias entre varias fuentes, realizamos una proyección estocástica de la población mexicana para el periodo 2001-2050. La proyección se compone de simulaciones aleatorias de cuatro diferentes escenarios dados por las mayores divergencias en las estimaciones del periodo 1985-2000. Esta técnica nos permitió considerar la incertidumbre embebida en los datos mexicanos. Nuestros resultados implican que es muy poco probable (0.07) que el tamaño de la población mexicana en 2005 fuera menor a 103.2 millones de personas, como fue publicado en el reciente Conteo de Población. Este resultado se suma a las peticiones de otros investigadores sobre la necesidad de revisar y realizar estimaciones demográficas consistentes.
Palabras clave: proyección estocástica, dinámica poblacional, evaluación de fuentes, estimaciones inconsistentes, México.
Introduction
Here we performed a stochastic forecast of Mexican Population for the period 2001-2050. We chose the stochastic approach because it allowed us taking into account the uncertainty embedded in present demographic data and its future behaviour. The assumptions on levels and trends of demographic variables are expressed in terms of predictive probability distributions, i.e. we ascribed probability values to different scenarios. Based on analysis of problems in Mexican data we considered four initial scenarios. Then, using the Program for Error Propagation, we generated one thousand simulations for each scenario (simulations consist on assigning random values to the future behaviour of demographic variables according to selected probability distributions). The simulated future trends are applied to the initial population of each scenario using the cohort-component method (linear growth model with a Leslie matrix). The Leslie matrix is built with age-specific fertility and mortality rates for both sexes at each time step, net-migration is given in absolute numbers also for both sexes at each time step. The set of all the random simulations for all the scenarios is the outcome of the stochastic forecast. The results are presented in the form of prediction intervals.
This paper is divided in two major sections. First we present the dataset used in the stochastic forecast, which includes jump-off populations, and fertility, mortality and migration levels and trends (description of problems in Mexican demographic data is based only in public information, and does not refer to any confidential data or personal communications). In this section we also assign future scenarios. Then we add a small description on how the future uncertainty is quantified in probability distributions. The second part of this paper is the presentation of our results.
Dataset
Jump-off populations
Today there is no agreement on the amount of Mexican population. Two national institutes are related to population figures and estimates: The National Institute of Statistics, Geography and Informatics (INEGI) which is in charge of Vital Statistics and National Census; and the National Population Council (CONAPO) which is in charge of population estimations and projections. INEGI (2006) has just published definitive results of their Second Population Count (a fast national census), and they claim that in October 2005 Mexican population consisted of 103.1 millions. The actual counted population was slightly less than 100.5 millions; INEGI (2006) added to this number more than 2.8 millions that were assumed to live in more than half a million houses where no information was collected. On the other hand, Conapo (2003) projected that in the middle of2005 Mexican population should consist of106.5 millions. The main reason of disagreement is that INEGI does not publish official estimates of undercounting of any national census, so Conapo makes its own estimations of under coverage and population size.
There are several reasons why undercounting in Mexican census is expected: huge territorial extension and geographical diversity, several communities where ethnic tongues are spoken, regions with high rates of no-response, organizational problems and etcetera. In the recent population count of 2005, besides problems mentioned above, there were major difficulties related to the period chosen for data collection (the month of October): after the raining season in Mexico (June to October) unpaved roads are flooded and some of them can not be used, the season of tropical storms and hurricanes starts in August and ends in October, so there were many flooded and displaced communities during this month (the 2005 Atlantic basin hurricane season was the most active and destructive season on record according to Gray and Koltzbach 2005); also major agricultural cycles start in October (sowing season of cotton, beans, maize and wheat, and harvesting season of maize, sugar crane and coffee), many communities moved to the fields to work and lived there during this month; and finally, two major national celebrations that last almost the entire month (El Festival Internacional Cervantino y Las Fiestas de Octubre) influenced population labour mobility in the centre of Mexico (information from several sources listed in References section, among them The Tropical Meteorology Project, Servicio Meteorológico Nacional, Centro Nacional de Prevención de Desastres CENAPRED, Secretaría de Turismo (SECTUR), Secretaría de Agricultura, Ganadería, Desarrollo Social, Pesca y Alimentación (SAGARPA), and Conapo). Because of these problems the figures reported for 2005 are highly controversial. Data validation is needed for achieving demographic coherent trends.
We decided to avoid using the controversial figures of 2005. The next most reliable estimation can be taken from the 2000 Population Census conducted by INEGI (2006). Even if INEGI does not give an estimation of undercounting, the data has been fully published and its quality can be assessed. The census considers usual resident population, referring to the people that live most of the year inside Mexican territory (is not de facto population because residents can be outside the country for a brief period, but is not de jure population in the European sense of legal residency).
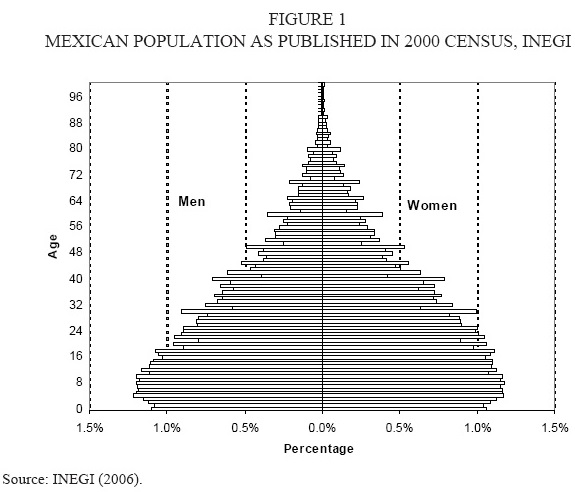
The total population actually counted in the 2000 census was 95.4 millions. INEGI estimated that more than 425.7 thousand houses were not included in the census, so they assumed that 4 persons lived in each one of these houses (5 persons for the state of Chiapas), so the total published population was 97.5 millions. Conapo (2003) corrected the 2000 census population: age heaping problems and undercounting were corrected using Luther and Rutherford method; Conapo also considered that the inclusion of 4 persons inside the uncounted houses led to bias, they assumed that only 1 person lived in each of these houses and distributed these persons only on working ages; they also corrected the excessive age declaration or rejuvenation effects using the Gray method based on moving averages. Conapo applied these corrections to the population for every State in Mexico and they estimated total population size of 100.5 millions.
If we compare the population counted by INEGI (95.4 millions) and their total published population (97.5), then the census undercoverage was 2.2 per cent. If we use counted population and corrections made by Conapo (100.5 millions) the undercounting was 5.1 per cent. If we think about INEGI's total published population and Conapo corrections the undercounting was 3 per cent. The estimations of undercounting using corrections by Conapo are reasonable numbers if we consider that the US Census Bureau (2001) estimated an undercounting in the 2000 US census of 2.3 per cent, Statistics Canada (2001) estimated a gross undercoverage in their 2000 census of 4 per cent and a net undercoverage of three per cent, and National Statistics UK (2006a) estimated that the undercount in their 2001 census was equal to 6 per cent in England and Wales.
Thus we have two possible starting populations, the one published by INEGI and the one corrected by Conapo (taken to 1 January 2001). We decided to use both as jump-off populations (Figures 2 and 3); each starting population will imply a different forecasting scenario, all scenarios combined will shape a final forecast named Many Mexicos. The published population by INEGI has heaping problems and includes almost 2 million people with age not-specified.
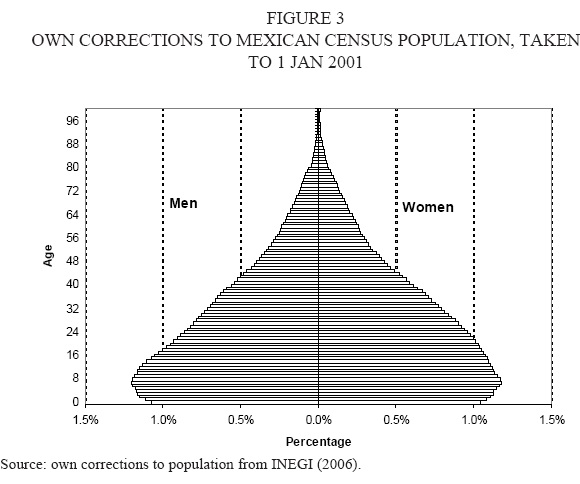
To correct these problems we made five years age groups, then we used the correction method (1/16) for age and sex distribution proposed by UN, and finally we distributed the individuals with not-specified age by giving bigger weights to those ages which are usually undercounted (infants, very old people, and working individuals living alone). Single age groups were obtained using Karup-King multipliers. This population was also taken to 1 January 2001 (figure 3).
Vital rates
Conapo (2003) used its own corrected 2000 population to reconstruct population dynamic trends in the period 1990-2000. Then they used estimated trends to make a population projection until year 2050. Ordorica (2001) showed that the estimated births from Conapo differ significantly from the registered births in the Vital Statistics (collected by INEGI), then this author explained that considering the different birth rates, from Conapo and Vital Statistics, the estimated population growth and net migration were also significantly different; his conclusion is that a revision is needed for coherence in Mexican demographic data. The estimations of migration by Conapo become more problematic when compared to estimations of the US Census Bureau. The main destination for Mexican emigration is the United States; for example, Alba (2000) estimated that 96 per cent of Mexican emigrants in 1995-2000 went to this country. Durand and Massey (1992) explain that estimations of migration between these two neighbour countries have been controversial since the 30's; they quote Corwin when he refers to the estimates of undocumented migration as a numbers game. These authors also give examples of several papers that participated in this migration debate arguing for 'false assumptions' and 'wishful calculations'. The emigration estimates of Conapo (2003) in 19902000 were based on the assumption of eight million Mexicans living in the United States, but the US Census Bureau (2006) counted 9.2 millions in the 2000 Census. Furthermore, the estimated emigration trend by Conapo, which always increases during the whole period 1990-2000, contradicts other estimations. Ordorica (2001) estimated that Mexican emigration was 40 per cent higher than Conapo figures for the period 1990-1995, and Alba (2000) estimated a smaller amount of emigrants than Conapo for the period 1995-2000, and the combined estimations of these two authors give numbers somewhat closer to the amount of Mexicans counted in the US Census.
Given this lack of coherence in Mexican demographic data, the different estimations of vital rates suggest different scenarios. For some scenarios we used vital rates estimated by Conapo (2006b) and for other scenarios we used vital rates estimated from Vital Statistics. These last rates are not published by INEGI, so we made our own estimations derived from registered births and deaths. With our estimation of vital rates we calculated net amounts of Mexican emigration. Our goal was to achieve a migration estimation coherent with calculations of Ordorica (2001) and Alba (2000), and therefore coherent with figures of US 2000 Census.
Population for own estimation of vital rates
Population data can be obtained from national census, information about births and deaths can be obtained from Vital Statistics. We assumed that both sources have the same underestimations problems, so when rates are calculated then the under coverage from both sources cancels out. We acknowledge that these sources, and our assumption, are subject to criticisms and that they present serious problems, but we also believe that they can be used as a starting point for avoiding the vicious cycle of lack of demographic coherence.
Data about births with the age of the mother (needed for age specific fertility rates) is only available for the period 1985-2000; therefore we made our estimations only for this period. The census data for years 1970, 1980, 1990 and 2000 is available from INEGI (1996, 2006). Populations are given by five years age groups with different last open groups, to make them comparable we set all published populations with highest age group of 85 and more (this also avoids problems of excessive age declaration in higher ages). We also corrected these populations using the 1/16 method of United Nations. From INEGI (1996) we know that 1980 census faced many problems. The total published population of 1980 was estimated using an undercoverage survey (Conapo 2003). This has been the only Mexican census with a post-survey to correct for undercounting; in this sense the 1980 population differs from all the others. We want to use comparable populations over time, even if we have to assume similar undercounting problems, so we can not work with 1980 corrected population. Instead we used information from 1970 and 1990 censuses to estimate a coherent population trend that includes the year 1980.
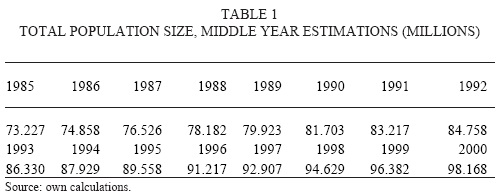
We reconstructed the mid-year population classified by sex and 5 years age groups for all the reference period 1985-2000. First we distributed people whose age was unknown into all the age groups. We gave bigger weights (a 2 per cent increase from proportional distribution) to age groups that usually present underestimation problems (small children, young adults living alone and old people). Second step was moving census populations towards mid-year estimations. The growth rates were calculated for different periods in-between 1970-2000 based on census data (we assumed geometric growth). The adjustment of 1980 was done using growth rates from the periods 1970-1980, 1980-1990, and 1970-1990. Using these rates, populations of 1970, 1990, and 2000 were taken to middle years. Population of 1980 was estimated as the average of forward projection of 1970 population and backward projection of 1990 population using the adjusted rates. The mid-year population for years 1985 and 1995 were also calculated as the average of forward and backward projections. The last step was to formulate mid-year population for every year of the first and second half of 80's and 90's decades. The first half of each decade was formulated using forward projections and the second half using backward projections (results shown in table 1 and figure 4).
Fertility
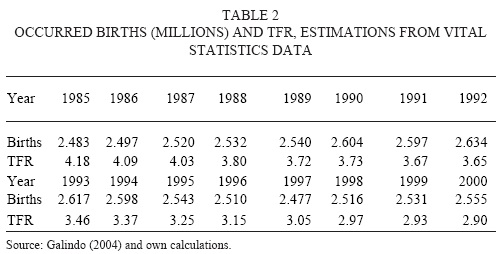
We used the registered births to estimate fertility rates. The main problem of birth registries in Mexico is the timing of birth registration. It is parent's duty to register the newborn child in the Register Offices but there is no maximum age specified by law at which parents have to register their child. So it is common that births are registered some years after actual birth year. Because of this problem most recent fertility rates are lower than expected and comparison over time is questionable. There is also the problem that some children are registered more than once. Galindo (2004) dealt with these problems and estimated occurred and registered births for each year during the period 1950-2000. Basically this author made projections following the behaviour of birth registries for each age of the registered child, then using Lexis diagram the projected registered children were ascribed to a given year of birth; in this way all years were made comparable.
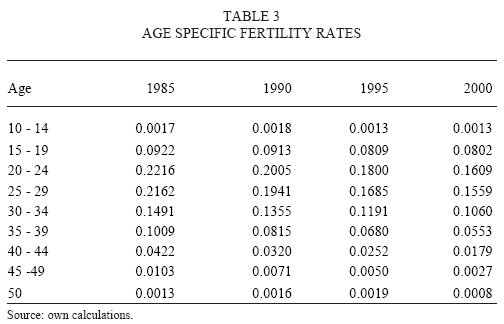
From Vital Statistics we obtained the age of the mothers of registered births at age 0 of the newborn for every year in the period 1985-2000. Data for previous years was lost in the 1985 earthquake in Mexico City, this was the main reason why we restricted our study period only the years already mentioned. Using the age pattern of the mothers from Vital Statistics, the total estimated births by Galindo, and our population estimates, we calculated the age specific fertility rates for each year during the period 1985-2000 (results shown in figure 5 and table 3). Here we believe that is very important to note that these data, age-specific fertility rates from Vital Statistics, have not been estimated before and it will be very fruitful, for future research, to analyze it and compare it with official estimations (which are not based on Vital Statistics).
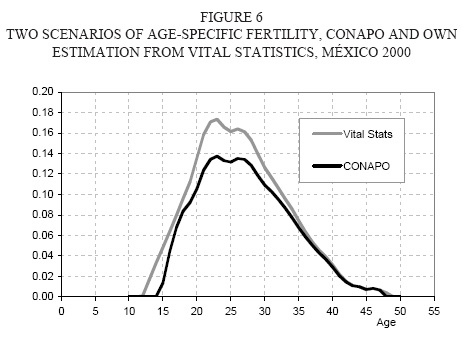
Finally, we need age-specific fertility by single year age groups, for the year 2000, in order to forecast future behaviour. We estimated single year rates using Karup-King multipliers. Thus we obtained two scenarios for fertility, the one estimated by Conapo (2003) and another one estimated from Vital Statistics data. Both scenarios are shown in figure 6.
Fertility forecasting assumptions
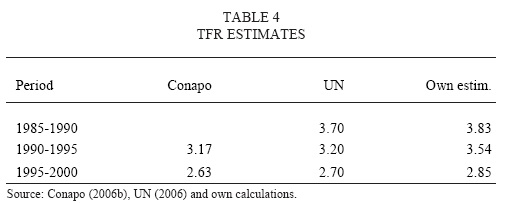
We also need to make assumptions about the future behaviour of the Total Fertility Rate (TFR) and the Mean Age at Childbearing. Mexican TFR presents a steady decline in several estimations as it can bee seen in Table 4 (we made our TFR estimations using the age-specific fertility rates described above).
Conapo (2006b) and UN (2006) assume a steady decline of Mexican TFR until it reaches the value of1.8 and then they keep it constant. In order to explore also a different scenario, we argue that Mexico shares many common features with other countries that have seen their fertility reduced to lower levels. For example, Mexico as Italy and Poland has strong family traditions, the majority of people are catholic, its unemployment rates are high, there is a big proportion of precarious jobs, there is no universal health insurance, there is no unemployment governmental insurance, and the state does not guarantees schooling and health services for all children.
These characteristics lead us to believe that Mexican people will face the same problems on family formation and childbearing as people in Italy and Poland, and so, Mexican fertility will reduce to low levels as in these two countries (Italy 2000 TFR 1.21, Poland 2000 TFR 1.48, UN 2006).
We assumed that TFR will decline with a linear trend (as suggested by the historical data) and it will reach a low level of1.4 children per woman. This level is assumed to be reached in 17 years and from then on, TFR will stay constant until the end of the forecast period. In figure 7 we plotted the two expected scenarios, the one assumed by Conapo (2006b) with a high fertility level of 1.8 in the long run (which is high when compared to the European fertility experience) and other low level scenario of a low fertility level of1.4 in the long run.
We found no assumptions from Conapo for the mean age at childbearing (all parities). Our estimations show a decline, starting from more than 28 years in 1985 to almost 27 years in 2000. The decline has not been linear and sometimes the mean age has also increased as shown in figure 8. However, this behaviour might be due to problems with our data. We expect that Mexican women will keep reducing their fertility, which might imply a further reduction in the mean age at childbearing; but we also expect that Mexican women will start postponing having children, which will increase or at least will held constant this fertility indicator. Furthermore, a usual trend (seen in many countries) is that when fertility declines the mean age of childbearing increases. For simplicity, we decided keep constant this indicator during the forecasting period.
Mortality
We used the number of registered deaths from Vital Statistics and our estimations of Mexican population to perform our own estimation of mortality rates. Mortality rates were estimated for men and women separately, the rates show a slight but continuous decrease over the period 1985-2000 (shown in figure 9). Mortality rates were estimated for five years age groups, the higher open age interval was 85 and more years.
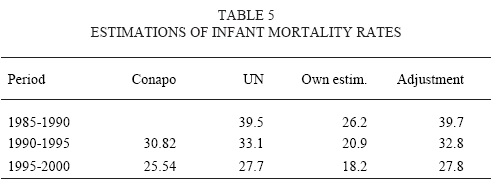
Estimations of mortality rates, from Vital Statistics data, yielded reasonable values except for infant mortality. Table 5 shows a comparison of several estimates of this indicator. It is a well-known problem that infant mortality is under registered in developing countries, so it is highly probable that our calculations underestimate this phenomenon. We adjusted to our infant mortality rates using UN (2006) estimated values as a target. This adjustment is also shown in Table 5. Here we consider that is important to note that more research is needed in order to achieve accurate estimations of Mexican infant mortality and its under-registration.
For the year 2000 we estimated age specific mortality probabilities from the mortality rates. Using Karup-King multipliers we obtained single year estimations. For the old ages, 81 and more years old, we used a linear extrapolation on the log scale. Then we compared our estimates with the ones from Conapo (2003). Estimations from both sources turned out to be very similar (shown in figure 10), the only noticeable differences occur at young ages. Because the strong similarities among estimations we decided to have only one mortality scenario given by our mortality probabilities.
Mortality forecasting assumptions
We need to assume a future mortality trend for the forecasting period. Our starting mortality conditions are given by the age specific mortality probabilities of the year 2000. So we calculated this indicator for all the years of the reference period 1985-2000. From these values we were able to obtain their rates of decline. We decided to assume a future mortality behaviour given by the average of 1985-2000 rates of decline. However, we decided not to apply these rates of decline to all the forecasting period.
This decision is based on the fact that Mexican mortality is still declining due to improvements in young ages, but further mortality decline in future years would have to occur at older ages (with important expenditures on medical treatments against chronic diseases), this will slow down the overall peace of decline. Therefore the average decline will be applied first 20 years, and then the value of the rates of decline will be halved and applied till end of the forecast period.
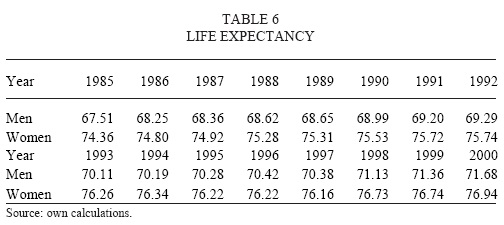
Because the assumption of the future mortality trend is too arbitrary, we also calculated values of life expectancies for men and women for all the years in 1985-2000. As shown by Oeppen and Vaupel (2002) the «best practice» life expectancy follows a linear trend. The fit of the linear trend for both sexes, against our estimations of life expectancy, seems acceptable (around 95 per cent value for R2 for both sexes, slightly higher for men). If we follow this trend till 2050, we obtained a convergent trend for both sexes towards 84 years old. We do not expect Mexico to follow during all the forecasting period a 'best practice' trend, so we believe that Mexican life expectancy will be lower than this value for both sexes at the end of the forecasting period (this is also the reason why we reduced by half the rates of decline after 20 years). So, this value, along with the assumptions of Conapo (2006b) will be useful to evaluate our mortality assumptions. Estimations of life expectancies are shown in figure 11.
Migration
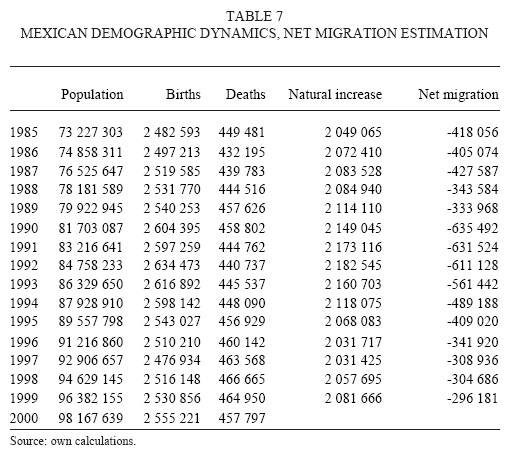
So far we have gathered information about size and age structure of the population, births and deaths. It is just a matter of combining these data in the basic demographic equation to achieve migration estimates. According to Conapo (2006) almost 3.7 millions emigrated to United States during the period 1990-2000. However, the US Census Bureau (2006) estimates that almost 4.9 millions Mexicans immigrated permanently to US during this period (figures of US residents born in Mexico). According to the data we gathered and estimated, Mexican net emigration in 1990-2000 was almost 4.6 millions. Here is important to note that our estimation is a coherent trend of population dynamics for the period 1990-2000, and it is a worthy result that the difference between our accumulated net migration and the figures of the US Census Bureau is so small (results shown in table 7). The difference between our estimations and those of the US Census Bureau might imply that we are underestimating the number of births. We tried to compensate this underestimation of emigration in two different ways; we ascribed a high uncertainty to the emigration future trends, and we only considered emigration rates when calculating age specific migration (we did not allow net immigration in any age group).
Calculation of age specific migration rates involves detailed information by age, which means that all the problems of lack of coherence of Mexican demographic data will accumulate. We estimated migration rates for the period 1995-2000 because most of our data is organized in five years age groups. Results can be seen in figure 12, but as we mentioned before, all the problems of coherence in Mexican demographic data became obvious when matching all the information in the basic demographic equation (final calculation of migration rates, table 7). In order to avoid underestimation of Mexican emigration, and taking into account that immigration in certain age groups can be an artefact due to bad data, we decided to consider only net emigration rates (only positive values in figure 12). This last decision implied that age specific migration rates needed adjustment, so we used the function proposed by Rogers and Castro to simulate the emigration pattern by age. When applying the function we used positive numbers for emigration; that is why the function is adjusted on the positive side of the y-axis. It is important to note that the adjusted function never crosses the x-axis, as the estimated original pattern does, so the adjusted rates result in higher emigration estimations (shown in figure 12).
With the adjusted function we recalculated net migration for the year 2000 (absolute numbers). So we obtained an adjusted age specific pattern of emigration, which is shown in figure 13. If we apply this age pattern of net migration over ten years we would reach almost 4.8 millions emigrants. This new estimation of emigration is closer to the numbers reported by the US Census Bureau. We decided to have only one migration scenario given by this estimation. However, it is important to note here that more detailed research is needed in order to achieve coherent demographic trends.
Forecasting migration assumptions
Migration is the most capricious demographic phenomena. Its behaviour depends on so many factors that it is very difficult to make accurate assumptions even for short-term periods. We considered that because of the expected fertility reductions and consequent aging of Mexican population, emigration might reduce by the year 2050 to the half of its present level. Of course, the main reason to assume a decrease on Mexican emigration is the revival of the anti immigration policies in the United States (building a wall between both countries and so on). We show this assumption in figure 13. However, we acknowledge that this assumption can be subject to severe criticism. As explained in the next section, we ascribed a high value of uncertainty to migration in order to compensate the shortcomings made on the estimation and assumptions of future trends of this demographic variable.
Uncertainty
The main idea of a stochastic forecast is to take into account the uncertainty about future behaviour of demographic variables. We used the Program for Error Propagation (PEP) to produce 1000 stochastic simulations for each scenario suggested by the evaluation of Mexican demographic data made above. In each simulation the program generates random values of demographic variables; the random values are generated according to our forecasting assumptions but also according to a certain level of uncertainty. In all scenarios we allowed the fertility rates to double or halve their values on each random simulation. The same level of uncertainty was ascribed to mortality probabilities. For net migration we allowed an uncertainty of four per thousand, which means that if the starting population is close to 100 millions, the standard deviation for net migration in the next time point will be 400 thousand. If our net migration estimation is almost 480 thousand emigrants per year, then we are allowing migration in the next time point to reduce to 80 thousand or to increase to almost the double of its original value. This high level of uncertainty might seem exaggerated but Mexican emigration is highly dependent on political and military decisions of the United States; actions as the 'technological wall' and displaying the National Guard along the Mexican border can reduce drastically Mexican migration. Ascribing a high value of uncertainty to Mexican migration does not respond to an assumption of possible flow reversals (though this may also happen), but to the lack of consistent data.
Scenarios
From Mexican data brief analysis made above, we decided to implement 4 different scenarios. Scenarios are given by the starting 2000 populations specified as the published and corrected census population (figure 3) and the corrected population estimated by Conapo (figure 2). These two jump-off populations will be combined with the two possible fertility scenarios specified above, which are given by Conapo and own estimations from Vital Statistics (both shown in figure 6), their assumed future trends will correspond to the one suggested by Conapo (2006b) and the one we assumed from Vital Statistics data (both shown in figure 7). Assumptions of mortality and migration will be the same in all scenarios.
1. Scenario 1, Jump off population and fertility given by Conapo.
2. Scenario 2, Jump off population given by Conapo, fertility estimated from Vital Statistics.
3. Scenario 3, Jump off population estimated from 2000 Census, fertility given by Conapo.
4. Scenario 4, Jump off population estimated from 2000 Census, fertility estimated from VS.
The many Mexicos
Many national and international population offices, like the one from United Nations (2006), rely on forecasting alternative scenarios. Each scenario usually represents different interpretations of current demographic trends (fertility, mortality and migration, in low, medium and high scenarios). Recently the limitations of this approach have been pointed out. Using stochastic renewal processes is an interesting alternative to forecasting simple scenarios. The main idea is to portrait the following fact: assumptions about future behavior are less reliable the more we look into de future, i.e., our ability to make accurate guesses, based on our knowledge, declines as faster as we try to predict future behavior. Stochastic forecasts allow to make evident, and to quantify, this decrease of predictive accuracy.
Instead of the conventional scenarios for fertility, mortality and migration, probability distributions, for each demographic variable, are used. Population dynamics are obtain with cohort-component book-keeping, where the distributions of all demographic variables are put together, and the outcome is a joint probability distribution, which can be seen as the predictive distribution of future population. All probability distributions used here can be understood as a quantification of the future uncertainty.
Here we are using stochastic approach and different scenarios to portray another degree of uncertainty. Mexican data have serious problems of coherence; there is no general agreement on demographic levels and trends. There is no agreement even on population size on census years. And, therefore, there is no agreement on population size today. A fast population count was performed in 2005 but published results only fueled controversy. As mentioned above, stochastic forecasting is used to characterize future uncertainty; we decided to combine it with different initial scenarios that portray past and present demographic uncertainty. Furthermore, we decided to start forecasting in year 2001, so we could estimate probabilities, given past levels and trends (period 1985-2000), than can be associated to current population levels (year 2005). As far as we have look into literature, this is the first time stochastic approach is used in this way.
To show results we use, as it is generally done, median values of the predictive distributions. These values can be seen as the best guess we can make given available data. The spread of the distribution around the medians, i.e. the confidence intervals, should be taken as guidelines for users; they represent how much uncertainty is embedded in the forecast. We believe that future uncertainty cannot be stressed enough, and stochastic approach is a suitable way of emphasize it to no expert users of demographic forecasts.
The many Mexicos set will be given by the combination of the four scenarios mentioned above. Figure 15 shows the projections of the four scenarios, the solid lines represent the median values of each scenario, and the doted lines theirs 80 per cent confidence intervals according to the colours specified on the graph. Table 8 shows means and medians of two selected years, 2005 and 2050.
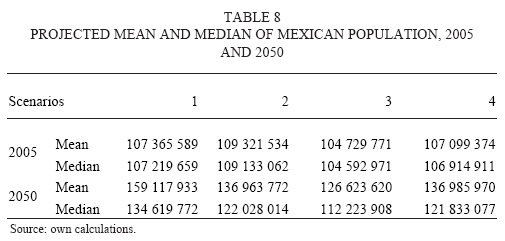
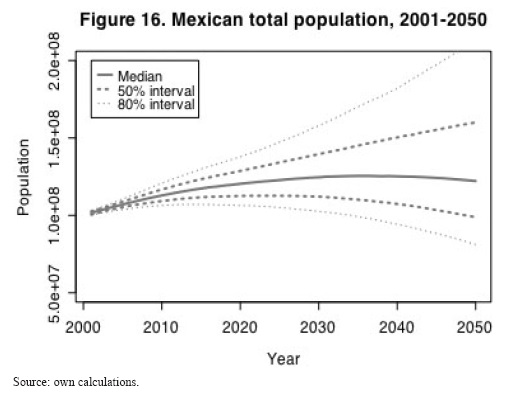
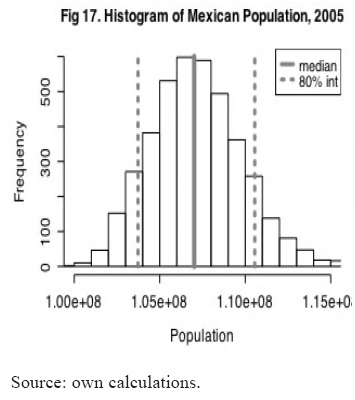
As shown in figure 15 and table 8, scenario three is the lowest one. The median value for the 2005 population according to this scenario is 104.6 millions; the probability that Mexican population in 2005 was lower than 103.2 millions is less than 0.22. For the other scenarios this probability is less than 0.03. But the accurate evaluation of uncertainty in Mexican demographic data is given by the combination of the four scenarios. Therefore, considering all scenarios, the probability that 2005 population was lower than 103.2 millions is less than 0.07; the median value for 2005 population is 107.1 millions; the 80 per cent confidence interval for this value is given by 103.7 millions low bound, and 110.5 high bound; the 50 per cent interval is given by 105.3 and 108.8 millions respectively. The results of all scenarios combined are shown in graphs 16, 17 and 18. These results were expected due to all problems related to the data collection period of the recent population count (problems explained in the dataset section). These results add to the requests of building coherent demographic historical series made by several researchers (e.g. Ordorica, 2001). This problem is not only of demographic interest; we must remember that demographic data is useful for economic and political analysis, therefore achieving coherent population data series is of general interest.
The stochastic forecast, all scenarios combined, gave a median value of life expectancy in the year 2050 of 76.4 years for men and 80.9 for women. The 50 per cent confidence interval for men is given by 71.7 and 80.8 years; for women is given by 76.5 and 85 years.
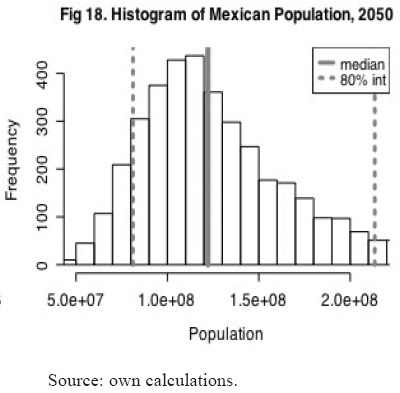
Our median values are slightly lower than the UN (2006) estimates of 78.9 and 83.5 years of life expectancy at birth for men and women respectively, however these values are inside of 40 per cent confidence intervals around our median values. The mean value for 2050 population is 140 millions, however, from figure 18 we can see that the distribution is notoriously skewed to the right. The median 2050 population value is 122.2 millions. From figure 16 we can notice the great uncertainty embedded in the forecast. The 50 per cent confidence interval is given by 98.7 millions as low bound and 160 millions as higher bound. UN (2006) population estimates for 2050 are inside a 60 per cent confidence interval around our median value (their medium variant value 139 millions, low variant 114.8 millions and high variant 166.7 millions).
Perhaps the most interesting result of our forecast is within the age distribution. In Figure 19 we present 3 wide age groups (0-14, 15-64, and 65-100) which are commonly used to calculate dependency ratios. The proportion of young population (0-14) will decline; meanwhile the proportion of old population will increase. These two trends will create first increase the proportion of working-age population, reaching a peak around year 2025 and then this proportion will decline as the proportion of old population increases. This small window of opportunity given by the biggest expected share of working-age population (demographic bonus) and then the problems associated to aging population will compel important challenges to Mexican society.
Discussion: despite uncertainty
Mexican demographic data has serious coherence problems. Levels and trends estimated by several institutions and researchers are inconsistent. Most recent estimations are increasing the discrepancies instead of reducing them: according to existent Mexican demographic data there is a very high probability (0.93) that Mexican population size in 2005 was bigger than the 103.2 millions recently counted by INEGI (2006). Thus, there is a real need to elaborate coherent estimations of Mexican population dynamics. Fortunately, problems with census under coverage and inconsistent demographic estimates are not new for demographers and do not only occur in Mexico. There are many international examples of how these problems can be surmounted. Perhaps the most recent example is the One Number Census project (National Statistics UK, 2006b), which allowed British demographers, administrators and politicians to elaborate coherent demographic estimations according several information sources.
Disregard of the uncertainty and lack of coherence in Mexican data there will certainly be two important challenges for Mexican society: provide employment to the increasing proportion of working-age population, which will reach a maximum level around the year 2025; and make the necessary previsions to overcome the problems of an aging population after the year 2030. The forecasted Mexican dependency ratio 2001-2050 is shown in figure 20. Therefore, despite all things we do not know about Mexican population, it is clear that the most impeding need today, in demographic and economic areas, is to create jobs and economic opportunities.
Bibliography
ALBA, F., 2000, "Migracion internacional. Consolidación de los patrones emergentes", en Demos, Carta demográfica de Mexico, 13. [ Links ]
CENAPRED, 2006, Atlas Climatológico de Ciclones Tropicales (Serie Especial), Centro Nacional de Prevención de Desastres, Available at www. 3.4.2006, http://www.cenapred.unam.mx/es/DocumentosPublicos/. [ Links ]
Conapo, 2003, Proyecciones de la Población en México, de las entidades federativas, de los municipios y de las localidades 2000-2050 (documento metodológico), Consejo Nacional de Población, Available at www. 3.4.2006, http://www.conapo.gob.mx/00cifras/metodo/metodo.htm. [ Links ]
Conapo, 2006a, Por que los resultados preeliminareis del Segundo Conteo de Población y Vivienda difieren de las proyecciones de población del Conapo, Consejo Nacional de Población, Available at www. 11.3.2006, http://www.conapo.gob.mx/difieren_nota.htm [ Links ]
Conapo, 2006b, Indicadores demográficos básicos, Consejo Nacional de Población, Available at www. 11.3.2006, http://www.conapo.gob.mx/. [ Links ]
DURAND and Massey, 1992, "Mexican migration to the United States: a critical review", en Latin American Research Review, 27, 2:3-42. [ Links ]
Galindo, C., 2004, Recuperación de los nacimientos ocurridos y registrados durante 1950-2000 en México, su importancia y sus implicaciones, (Maters' thesis), El Colegio de México, Ciudad de México. [ Links ]
GRAY and Klotzbach, 2005, Summary of 2005 atlantic tropical cyclone activity and verification of author's seasonal and monthly forecasts, The Tropical Meteorology Project, Available at www. 3.4.2006, http://hurricane.atmos.colostate.edu/Forecasts/2005/nov2005/. [ Links ]
IBARRAN and Lubosky, 2005, «Mexican immigration and self-selection: new evidence from 2000 Mexican census', Discussion Paper num. 1308-05. Institute fro Research on Poverty. Available at www 14.3.2006, http://www/irp.wics.edu. [ Links ]
INEGI, 1996, Estados Unidos Mexicanos: cien años de censos de población, Instituto Nacional de Estadística, Geografía e Informática, Aguascalientes. [ Links ]
INEGI, 2006, Información estadística, estadísticas por proyecto, censos nacionales, Instituto Nacional de Estadística, Geografía e Informática, Available at www. 01.06.2006, http://www.inegi.gob.mx/est/. [ Links ]
NATIONAL STATISTICS UK, 2006a, Census 2001: results and information, Office of National Statistics United Kingdom, Available at www. 01.06.2006, http://www.statistics.gov.uk/census2001/census2001.asp. [ Links ]
NATIONAL STATISTICS UK, 2006b, The one number census, an estimate of the whole population, Office of National Statistics United Kingdom, Available at www. 01.06.2006, http://www.statistics.gov.uk/census2001/onc.asp. [ Links ]
OEPPEN and Vaupel, 2002, "Broken limits to life expectancy", en Science, 296. [ Links ]
ORDORICA, M., 2001, "Hoy. Un momento importante para revisar las estimaciones demográficas", en Papeles de Población, núm. 28. [ Links ]
PRICEWATERHOUSE, Coopers, 2001, Census study: census 2000 undercount could cost states billions, US Census Monitoring Board, Available at www 3.4.2006, http://govinfo.library.unt.edu/cmb/cmbp/reports/080601.pricewaterhouse/downloads.asp.htm. [ Links ]
SAGARPA, 2006, Sistema Integral de Información Agroalimentaria y Pesquera, Secretaria de Agricultura, Ganadería, Desarrollo Social, Pesca y Alimentación, Available at www. 3.4.2006, http://www.siap.sagarpa.gob.mx/index.html. [ Links ]
SECTUR, 2006, Ferias y festividades, Secretaría de Turismo, Available at www 3.4.2006, http://www.sectur.gob.mx/wb2/sectur/Ferias_y_Festividades. [ Links ]
SERVICIO METEOROLÓGICO NACIONAL, 2006, Ciclones: información histórica y tabla de ciclones que afectaron a México 1970-2005, Comisión Nacional del Agua, Servicio Meteorológico Nacional, Available at www 3.4.2006, http://smn.cna.gob.mx/ [ Links ]
STATISTICS CANADA, 2001, Coverage, 2001 census technical report, reference products: 2001Census. Available at www 3.4.2006, http://www12.statcan.ca/english/census01/Products/Reference/tech_rep/coverage/index.cfm. [ Links ]
THE TROPICAL METEOROLOGY PROJECT, 2006, Dr. Gray's tropical storm forecast, Available at www. 3.4.2006, http://hurricane.atmos.colostate.edu/Forecasts/. [ Links ]
UNITED NATIONS, 2006, World population prospects: the 2004 revision, United Nations Population Division, Available at www. 3.11.2006 http://esa.un.org/unpp/. [ Links ]
US CENSUS BUREAU, 2001, An evaluation of the 2000 Census, US Census' monitoring board final report to congress, US Census Bureau, Available at www. 3.4.2006, http://govinfo.library.unt.edu/cmb/cmbp/reports/final_report/fin_sec3_evaluation.pdf. [ Links ]
US CENSUS BUREAU, 2006, Census of Population Housing 1990, 2000, US Census Bureau, Available at www4.4.2006, http://www.census.gov/main/www/cen2000.html. [ Links ]
* Acknowledgements: thanks to Juha Alho for useful comments and guidance. This research was possible thanks to the financial support of the University of Helsinki, the Netherlands Interdisciplinary Demographic Institute, and the Consejo de Ciencia y Tecnología del Estado de Aguascalientes, and also to the Max Planck Institute infrastructure and working environment.
Información sobre los autores
Katja Kesselt. Socióloga por la Universidad de Helsinki, Màster en Ciencias Sociales por la Universidad de Helsinki, European Research Master in Demography por la European Doctoral School of Demography y el Max Planck Institute for Demographic Research, candidata doctoral por la Universidad de Helsinki. Se ha desempeñado, entre otros cargos, como coordinadora de proyecto en el Centro Nacional de Investigación y Desarrollo para el Bienestar y la Salud (Finlandia), investigadora visitante en el Instituto Estoniano de Demografía en la Universidad de Tallin. Actualmente es investigadora en el Departamento de Políticas Sociales en la Universidad de Helsinki. Su principal línea de investigación es la fecundidad en Europa del Este. Correo electrónico: katja.kesseli@helsinki.fi
Carlos Galindo. Actuario por la Universidad Nacional Autónoma de México, Maestro en Demografía por El Colegio de México (primer lugar del Premio Gustavo García Cabrera 2004), European Research Master in Demography por la European Doctoral School of Demography y el Max Planck Institute for Demographic Research. Se ha desempeñado, entre otros cargos, como diseñador de procedimientos de información en el Instituto Nacional de Estadística, Geografía e Informática, socio-consultor en IΝΑΡΕ Consultores, fellow del Netherlands Interdisciplinary Demographic Institute. Actualmente es consultor independiente y asesor del Consejo Nacional de Población. Su principal línea de investigación es la Demografía Matemática. Correo electrónico: cgalindo@colmex.mx y calorsglx@gmail.com

