


 nova página do texto(beta)
 Inglês (pdf)
 Artigo em XML
 Referências do artigo
 Enviar este artigo por email
 Citado por SciELO
  Similares em
SciELO
Similares em
SciELO 
 Permalink
1 Introduction
Infectious diseases are the leading cause of death in the world. About 13 million people die annually from these diseases. The dengue virus has one of the highest infection rates per year. It is estimated that at least half of the world's population is at risk and estimates that there are between 100 and 400 million infections per year.
The problem is that there is still no specific treatment for dengue, and early detection of severe dengue-associated disease and access to appropriate hospital care only reduces mortality rates of the severe type to less than 1% [32].
Dengue transmission occurs by the bite of the female Aedes aegypti vector and by larval transmission of the mosquito, this species is present in all tropical regions, which are characterized by high temperatures and moderate to high relative humidity [20].
In the second case, the mosquito lays its eggs in natural and human-created (artificial) water containers, transmitting the virus orally. In Peru, dengue disease has manifested itself at different times, but it was not a serious problem in the past, to the point that it disappeared in 1956.
However, there was a reintroduction of the dengue vector, detected in 1984 in Loreto, which then spread to the San Martin region and the central jungle, and up to 2011 it was identified in 269 districts and 18 regions (almost one third of the country) [4].
Recently, in 2019 and 2020, the cumulative incidence of dengue per 100,000 population increased by 12.73% with 15,338 and 18,818 dengue cases in 2019 and 2020, respectively [18].
Likewise, for the year 2020, the official Health Minister indicates that Peru ranks third in the Americas with the highest mortality rate for dengue with data from cases reported in the Peruvian surveillance system out of a total of 48,858 dengue cases, including 72 deaths [18].
During 2019, there was evidence of an increase in dengue cases due to the low budget on the part of the state for fumigation of infected areas. Then, there was a decrease in cases coinciding with the appearance of COVID-19, which caused a quarantine declaration that prevented the correct capture of dengue cases.
One of the modern solutions being employed in medicine is the use of Machine learning (ML) tools. This branch of artificial intelligence (AI) uses algorithms, expressed as sets of mathematical methods which explain the relationships between variables.
1.1 Objectives
The present study focused on answering the question of whether it is possible to find an optimal ML model to associate dengue cases with climatic conditions in the city of Iquitos, located in Loreto. This is deployed in the following specific objectives:
− Compare the performance of different ML models using meteorological and categorical variables.
− Identify an optimal model for the classification of dengue cases in the city of Iquitos.
− Compare results obtained with previous research to complement the analysis and avoid possible biases.
The hypothesis is that there is an ML model that can effectively classify dengue cases in the city of Iquitos and provide valid and reliable results based on model validation indicators.
2 Literature Review
After learning about the usefulness of this discipline, many authors who have applied ML models in the medical field investigate the prediction of dengue spread in San Juan (Puerto Rico) and Iquitos (Peru), using climatic variables with three different models (Interpolation, Gradient Boosting Regression [GBR] and Random Forest [RF]) to predict the number of dengue cases reported each week, with GBR being the model that presented the best performance for this type of study, with an MAE of 24.11 and 7.36 for San Juan and Iquitos, respectively [1].
Likewise, they investigated dengue in Malaysia using ML models (CART, Artificial Neural Network [ANN], Support Vector Machine [SVM] and Naive Bayes [NB]), these models focus on climate data from tropical locations where SVM showed the best prediction performance (Accuracy = 70%, Sensitivity = 14%, Specificity = 95%, Precision = 56%); however, the test sample increased to 63.54% compared to 14.4% for the unbalanced data; likewise, in this study, a binary variable was created for the prediction of dengue outbreak based on weekly incidence data in Selangor [24].
Adding to the topic, dengue in Indonesia was investigated with ML models reaching the conclusion that Random Forest with 10-fold cross-validation is the most accurate algorithm (58%) for predicting dengue in critical phase [28]. Also, they used meteorological data from 5 provinces and ML models (Support Vector Regression [SVR], reductive linear regression model, GBM, NBM, LASSO and GAM) to predict the occurrence of dengue in China, the most accurate was SVR model [12].
And they used ML to investigate infectious diseases where dengue is also included, for this they used 7 supervised models (SVM, Decision Tree, RF, NB, ANN, Bootstrap Aggregating and AdaBoost) and unsupervised learning methods (PCA and K-main) [31]. Similarly, in a paper they applied 4 ML models (general additive modeling, seasonal autoregressive integrated moving average or SARIMA, random forest, and gradient augmentation) to predict dengue in Manila, for this they used meteorological data, reported dengue case data and population statistics [5].
Finally, a study compared regression and time series statistical models with ML algorithms to predict dengue cases and outbreaks 4 to 12 weeks in advance, using meteorological data and dengue case reports, resulting in an error rate of 21% and 33% lower in ML models than in regression and time series [3].
We also found sources that explain the classification of dengue types using ML models. SVM technique was applied to identify whether machine learning identifies and classifies dengue with patient symptom data.
The result with cross-validation of 10 shows a performance of SMV algorithm with sensitivity of 0.4723, specificity of 0.9759, accuracy of 0.9042 and hazard ratio of 0.8343 [11].
Following the events that occurred in the year 2020 with the emergence of the pandemic caused by COVID-19, many researches have focused their efforts on presenting solutions. Firstly, an ML model for predicting COVID-19 based on symptoms was exposed; this model, consisted of 8 binary features in the form of a simple questionnaire and presented 0.9 AUC with 95% CI: 0.892-0.905 [33].
An unsupervised model for community detection using a COVID-19 dataset was exposed, with a Principal Component Analysis (PCA) algorithm and the K-Means method to efficiently cluster countries according to similarities in the different COVID-19 cases counted [7]. The most frequent symptoms of COVID-19 affected patients were studied to predict in advance the key features of a patient, the models they used are: Convolutional Neural Network, Neural Network with Cross-Validation and Random Forest.
Authors Vaishya et al. collected more recent information on AI for COVID-19 from previous studies to identify its possible application for this disease, during the work they identified 7 possible applications for COVID-19 [29].
Similarly, another example of unsupervised learning whose objective was to test the effectiveness of predictive analytics to determine an area infected by an epidemic disease, with a backpropagation method to analyze a large set of diverse data categorized into physical network (population density and hotspot), geographic (climate and geodemography), clinical studies (clinical case classification and vaccination follow-up) and social media (geographic mapping) [13].
Another point evaluated above is the preference of Machine Learning over Big Data. In another source they explain that Big Data reduces its quality when incomplete data is presented, or disease peculiarities appear by region.
For this, they propose a joint Decision Tree and Map Reduce model for structured and unstructured data to help predict sub-diseases that may arise because of a main disease, obtaining an accuracy of 94.8% in the model [30].
Regarding the national level, the use of artificial intelligence to optimize the diagnostic process of tuberculosis was presented in the eRx project, which consists of an application that reads X-ray images based on artificial intelligence methods using convolutional neural networks, which detects pulmonary anomalies and preliminary clinical evidence of the disease [9].
3 Methods
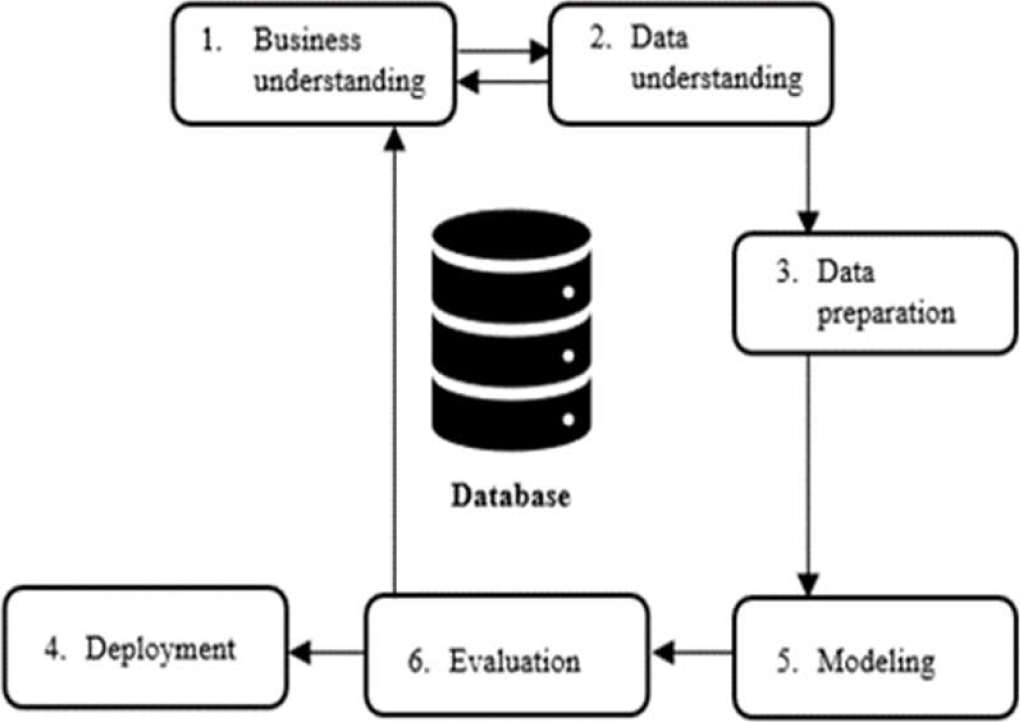
The present research employed the CRISP-DM methodology which consists of 6 phases: business understanding, data understanding, data preparation, modeling, evaluation, and deployment. The ML models to be built are of the supervised type and include data on dengue cases and meteorological conditions, and a target variable called "Class" was generated as a dependent variable.
Then, based on the most representative studies previously cited, the supervised models with optimal parameters and showing the best results were selected.
3.1 Algorithms
3.1.1 Support Vector Machine (SVM)
It is a supervised learning technique used to analyze data used in regression and classification. In addition to linear classifications, SVM efficiently performs nonlinear classifications by making use of the "kernel trick", which implicitly maps the input data to a higher dimensionality space by drawing margins between the classes.
The distances drawn between the two are maximized, thus reducing the classification error [16].
The parameters defined for this model are Cost (C) of 1.00, Regression loss epsilon (ε) of 0.10 and Kernel function of Polynomial type (1):
With the values of g = 0.06, c = 0.5 and d = 2.5.
3.1.2 Decision Tree (DT)
It is a supervised learning algorithm widely used for classification problems. It works by splitting the data into two or more related sets, first measuring the entropy of each point; then relying on the variables with maximum gain or minimum entropy to split sets, and finally repeating these two steps over and over again [26].
The parameters used for the construction of the model are minimum number of instances in leaves of 15, maximum node division of 5 and maximum depth of 150.
3.1.3 Random Forest (RF)
It is a supervised learning method used for classification and regression. This model is built with several fused decision trees, in order to obtain a more accurate prediction [15].
The parameters needed to build the model are number of trees of 50, number of attributes to be considered in each split of 2 and maximum node split of 50.
3.1.4 AdaBoost (AB)
It is a statistical classification meta-algorithm that trains weak trainees to adapt to successive errors, so that as the training is replicated on new trainees, they improve their performance.
The parameters established for model building are number of estimators of 15, learning rate of 0.1, fixed seed for random generator of 10, SAMME.R ranking algorithm (updates the weight of the base estimator with probability estimates) and square-type regression loss function.
3.2 Performance Metrics
The present study compared the models detailed above, seeking the best result for the classification of the target variable.
It is noteworthy that, neural techniques were not employed due to the limited data set used to test the models.
Next, to evaluate the performance of the models, the area under the ROC curve (AUC) will be calculated to ensure the correct fit.
In addition, the model validation indicators will be found: Accuracy (2), Precision (3), Recall (4) and F1 (5):
*TP: True Positive, TN: True Negative, FP: False Positive, FN: False Negative.
4 Data Collection
For the acquisition of the data set of dengue cases, the virtual health situation room, CDC Peru, was used.
This page shows reported cases including confirmed, probable and suspected cases by Epidemiological Week (SE), ordered demographically by department and sex, and also includes the cumulative incidences per 100,000 inhabitants in the area studied.
The records collected correspond to the districts of the city of Iquitos: Iquitos, Belen, Punchana and San Juan Bautista, ranging from SE 1 of 2010 to SE 18 of 2022.
From the dengue records, a categorical variable "Class" was generated that classifies cases into four groups (A, B, C and D), taking the maximum and minimum value of cases and dividing them by ranges.
Meteorological data were collected from the National Meteorology and Hydrology Service of Peru (SENAMHI) website, where the stations of San Roque, Amazonas, Puerto Almenara and Moralillo were selected, and the independent numerical variables corresponding to maximum and minimum temperature in degrees Celsius [°C]; dry and wet bulb temperature in degrees Celsius [°C] at set hours 07, 13 and 19h.
Were extracted, total precipitation in the area [mm] and wind speed [m/s], ranging from SE 1 of 2016 to SE 4 of 2022 [25].
Data cleaning was performed, with more than 1900 records, detecting missing values for meteorological data on some days of each year, for which the missing data were filled in by applying statistical tools, as appropriate; except for the variable "total precipitation in the area", where the highest value of the week was chosen, since it has the greatest impact on the tropical behavior of the climate.
Finally, there were 243 records for San Roque, 213 for Amazonas, 257 for Puerto Almenara and 246 for Moralillo.
5 Results and Discussion
5.1 Numerical Results
For San Roque station, the Decision Tree model presents an AUC with a lower performance than the others, but with respect to the rest of the parameters, its results are optimal. Meanwhile, for the rest of the models, good results are shown, evidencing a good model fit.
In the case of the Amazonas station, the best performance is presented by the SVM algorithm in all the indicators obtained, while the Decision Tree model shows the worst performance in AUC.
With respect to the two remaining models, they present an AUC that shows an optimal fit, above 0.8.
Continuing with the Puerto Almenara station, the best performance is shown by the AdaBoost algorithm; it should be noted that, although there are higher values, as in the case of Random Forest, they could be considered over-adjusted because they are very close to 1.
Finally, at Moralillo station, all the results obtained are optimal, including those of the Decision Tree model, which could be considered the least over-fitted, but if the Recall is also analyzed, the Random Forest algorithm shows a more adequate value of 0.874, which counterbalances with the possible over-fitting shown in AUC.
5.2 Graphical Results
The ROC curve (figure 2) shows that the fit is correct for all algorithms being above 0.5 and below 1, only with respect to the Decision Tree algorithm a drop-in performance can be seen.

The results of the Moralillo station (figure 3) show an optimal classification in all algorithms, being the dataset that shows the best relationship with the meteorological variables.

5.3 Proposed Improvements
The tables previously shown show the performance of the ML implemented on the climatic data of the four Iquitos stations. It is also observed that the best accuracy is provided by the SVM algorithm with a result ranging from 0.873 to 0.970.
From the data obtained, it is observed that the SVM algorithm classified optimally in most of the stations keeping similarity with a research indicating that this algorithm is the best predictor in terms of precision and accuracy of dengue outbreaks without overfitting in Malaysia [24].
Random Forest is a regression model that better captures nonlinear dynamics as is the case of the atmospheric variables used in this research because there are seasons with higher rainfall and temperature that condition the appearance of dengue-carrying mosquitoes [3].
To obtain an optimal classification, the Decision Tree, SVM, Random Forest and AdaBoost models were compared with a 5-fold cross-validation, all of them having a good Recall, but SMV was identified as optimal due to its accuracy and AUC values.
In this research, there were certain limitations with the meteorological data since information was not found for all months of the year, which made obtaining results complicated.
Part of the data used in Orange for this research was completed with statistical tools according to each variable. A similar data manipulation was performed in the research of the authors Anuranjan et al., who cleaned the data by interpolation [1].
Likewise, the results obtained are similar in methodology, data search procedures, ML models and obtaining results to the main reference papers used.
These provided information to complement the analysis of the results and confirm the hypothesis proposed.
Finally, it is considered that in order to obtain more accurate results in this research, more support tools such as the use of R or Python programming, search methods and data manipulation are required.
5.4 Validation
Validation allows the performance of the model to be tested, to corroborate whether the results shown correctly quantify the relationships between variables and that when new data are added there is no need to adjust the model or over-fitting occurs.
The cross-validation method separates the data, first performing training and then validation. Orange Data Mining software was used for the modeling.
The clean data was tested by cross-validation with 5 folds, dividing the data into five equal parts. In the same way happens for 10 folds. The complete results for 10 folds are shown below.
As can be seen, in this validation the model can learn better as in the case of AdaBoost, so it is correct to select this number of folds.
Table 7 shows the comparison of validations using a sample of the San Roque station with the DT model.
Table 1 Recollected data sample
| Features | 2017 | 2018 | 2019 |
| T Max (°C) | 31.97 | 29.31 | 32.58 |
| T Dry Bulb (°C) [h] | 24.57 | 23.69 | 25.15 |
| T Dry Bulb (°C) [h] | 30.03 | 28.46 | 31.50 |
| T Wet Bulb (°C) [h] | 28.09 | 26.66 | 27.63 |
| Precipitation (mm) | 19.90 | 09.20 | 43.30 |
| Dengue cases | 54 | 14 | 49 |
Table 2 Results of validation indicators (San Roque)
| Model | AUC | CA | F-1 | P | R |
| DT | 0.718 | 0.934 | 0.902 | 0.873 | 0.934 |
| SVM | 0.952 | 0.975 | 0.965 | 0.956 | 0.975 |
| RF | 0.987 | 0.934 | 0.904 | 0.876 | 0.934 |
| AB | 0.967 | 0.992 | 0.992 | 0.992 | 0.992 |
Table 3 Results of validation indicators (Amazonas)
| Model | AUC | CA | F-1 | P | R |
| DT | 0.417 | 0.977 | 0.965 | 0.954 | 0.977 |
| SVM | 0.895 | 0.995 | 0.993 | 0.991 | 0.995 |
| RF | 0.821 | 0.986 | 0.982 | 0.981 | 0.986 |
| AB | 0.818 | 0.995 | 0.993 | 0.991 | 0.995 |
Table 4 Results of validation indicators (Puerto Almenara)
| Model | AUC | CA | F-1 | P | R |
| DT | 0.589 | 0.934 | 0.902 | 0.872 | 0.934 |
| SVM | 0.994 | 0.977 | 0.970 | 0.970 | 0.977 |
| RF | 0.996 | 0.949 | 0.931 | 0.917 | 0.949 |
| AB | 0.970 | 0.996 | 0.996 | 0.996 | 0.996 |
Table 5 Validation result of 10 folds - San Roque
| Model | AUC | CA | F-1 | P | R |
| DT | 0.796 | 0.942 | 0.919 | 0.909 | 0.942 |
| SVM | 0.956 | 0.971 | 0.96 | 0.953 | 0.971 |
| RF | 0.985 | 0.934 | 0.906 | 0.88 | 0.934 |
| AB | 1.000 | 1.000 | 1.000 | 1.000 | 1.000 |
Table 6 Validation result of 10 folds - Moralillo
| Model | AUC | CA | F-1 | P | R |
| DT | 0.969 | 0.927 | 0.905 | 0.896 | 0.927 |
| SVM | 0.994 | 0.955 | 0.949 | 0.95 | 0.955 |
| RF | 0.977 | 0.882 | 0.837 | 0.801 | 0.884 |
| AB | 0.991 | 0.996 | 0.996 | 0.996 | 0.996 |
Table 7 Comparison of validations
| Method | AUC | CA | F-1 | P | R |
| 80/20 train/test | 0.712 | 0.939 | 0.91 | 0.881 | 0.94 |
| 5 folds cv(*) | 0.718 | 0.934 | 0.90 | 0.873 | 0.93 |
| 10 folds cv | 0.796 | 0.942 | 0.92 | 0.909 | 0.94 |
(*) cross validation
6 Conclusion
We were able to compare the performance of four ML models relating meteorological variables to dengue cases, obtaining optimal results in most of the performance indicators.
The SVM was identified as the optimal model for the classification of dengue cases in the city of Iquitos, due to its good performance.
The results obtained were compared with other research that applied similar techniques, since the research is similar in methodology, data search, ML models and obtaining results to the main reference papers used.
These provided information to complement the analysis of the results and confirm the hypothesis proposed.

