


 nueva página del texto (beta)
 Inglés (pdf)
 Artículo en XML
 Referencias del artículo
 Enviar artículo por email
 Citado por SciELO
  Similares en
SciELO
Similares en
SciELO 
 Permalink
1 Introduction
An estimated 1,957 million tons of fruits and vegetables were produced worldwide in 2018, harvesting mainly bananas, citrus fruits, apples, melons, grapes, tomatoes, various alliums, brassica, and cucumbers [1]. The inedible fraction of fruits and vegetables, known as urban organic waste (UOW) [2], is usually dumped in landfills, which generates undesirable impacts on the environment and the health of the population [3].
An alternative is the reusing UOWs practice known as the composting process, which is the aerobic decomposition of organic matter under appropriate conditions [4].
Decomposition and humification (oxidative biological transformation) of organic matter is a consequence of microbial activity through complex metabolic processes [5]. The final product of the composting process is compost. That is a nutritious, homogeneous, stable, and mature material. The compost involves pathogen-free nutrients that benefit the soil and plants, minimizing pollution [6].
Compost and other alternative technologies can help address the global fertilizer crisis [7], compensating for nutrient deficiencies in the soil to increase crop yields. The composting process involves several parameters, including humidity, aeration, pH, temperature, and carbon and nitrogen (C/N) ratio. These depend on the compostable materials; for instance, the organic waste proportion determines the C/N ratio content [7]. The initial C/N ratio is considered one of the key factors affecting the composting process and compost quality [8]. Carbon is the energy source for microorganisms, nitrogen contributes to the organic matter degradation, and both serve the protein synthesis and microbial growth [9]. Nitrogen and carbon losses occur because of the metabolic activities of microorganisms during the composting process [10,11].
Therefore, a C/N ratio is set within 25-40 at the composting start to finish around 10-20 [6]. Green and fresh organic materials contain more nitrogen, whereas brown and dry matters comprise more carbon than other materials; in practical terms, the compostable matter color is a good indicator of the carbon and nitrogen content [9].
Although composting is a well-known process for recycling organic waste, the practical utilization of UOWs still offers various challenges [12]. Besides the heterogeneity of UOWs, their qualitative characteristics, such as the stages of decomposition, which change color over time, and affect their quantitative characteristics (pH, humidity, carbon, and nitrogen content), are aspects scarcely reported. Commonly, different laboratory methods evaluate the C/N ratio, requiring reagents and specialized equipment, among other expensive resources that could be unavailable.
Practical estimation of the C/N ratio of UOWs is one of the keys to fulfilling local demands for better management of residues. In addition, it helps compost producers to obtain products that maintain the same properties, regardless of the organic waste used. In this context, the present work estimates the C/N ratio based on qualitative (color and maturity stage) and quantitative (weight) characteristics of the UOWs through the classification of images using Convolutional neural networks (CNN).
This proposed preprocess is a preliminary systematic framework to support compost production at household and tiny community levels, recycling the organic waste while conserving resources as a sustainability practice. For this purpose, a dataset of individual images of UOWs was generated as ground truth, associating each of them with the weight and decomposition stage of the UOW.
Determining the C/N ratio for five UOW in three decomposition stages was performed through a systematic literature search and complemented with laboratory analyses. Data of C/N ratio was arranged in a lookup table. For the automated UOW classification, three CNNs architecture models were trained.
The experiments consisted of training the models to classify the UOWs in their three stages of decomposition, which obtained appropriate accuracy. In addition, linear regression models were generated to predict the weight of the UOWs based on the variables of weight and the number of pixels in their images. The classification and weight of each UOW are related to the UOW C/N lookup table for estimating its C/N ratio.
2 Classification Algorithms
Digital image processing allows the interpretation of images and autonomous machine perception, including image storage, transmission, and representation [13]. Object detection and classification support a wide range of applications, such as security, robot vision, and consumer electronics [14].
In this context, deep learning techniques have emerged as a powerful strategy for learning feature representations directly from data, leading to advancements in detection and classification tasks [15]. Deep learning algorithms composed of multiple layers of processing detect features at different abstraction levels from data [16].
CNNs are deep learning algorithms based on artificial neural networks for classification and pattern recognition tasks, identifying the geometric similarity of the object shapes [17].
Automatic food analysis has been an application field of these algorithms, developing systems to locate and recognize various foods. Also, to estimate their quantity for tracking user diets, maintaining a healthy weight, and monitoring food-related health problems such as obesity and diabetes. A dataset of 20 different food categories was assessed with four CNNs combined with Support Vector Machines (SVM) in the task of recognizing food categories and states [18]. Deep architectures [19] were used for simultaneous learning of ingredient recognition and food categorization corresponding to images of given dishes for retrieving recipes.
Then deep learning features and semantic ingredient labels are applied to effortlessly recall recipes. CNNs have also been applied for identification in videos [20]. Objects and ingredients are explored in cooking videos and the most frequent objects are analyzed through a deep model based on Resnet CNN as a solution to the stage identification problem [21].
Another deep learning approach based on CNN Inception is proposed to identify different cooking states from images. The effect was analyzed in terms of different parameters such as batch size, optimizer, and frozen convolutional layers [22].
The automatic classification of fruit can assist in supermarket pricing, packaging, transportation, harvesting, and mapping on farms. Initial studies used near-infrared imaging devices, a gas sensor, and high-performance liquid chromatography to scan the fruit [23, 24]. Recent works implement deep learning techniques for fruits and vegetable classification using or modifying some previously trained CNN with a large data set.
When there is a small new dataset, the suggested technique relies on data augmentation, which consists of applying transformations to data [25]. In the case of images, the data augmentation applies geometric (zoom, flip, rotation, and cropping) or photometric (color fluctuation and edge enhancement) transformations [26].
A previous study created a 15-class fruit image dataset with a data augmentation technique and proposed a five-layer CNN [27]. To improve the performance of the proposed model, early stopping, and variable hyper-parameters were used. Some works have used eight and thirteen layers and kernels of 3×3, 5×5, and 7×7 [23, 28].
Several works have applied CNN for the classification of waste using images. For instance, a multi-layer deep learning system classifies waste into five recyclable categories: paper, plastic, metal, glass, and others (fruits, vegetables, plants, and kitchen waste) in urban public areas [29]. An automatic system using the CNN algorithm separates waste into biodegradable and non-biodegradable [30]. A CNN mobile application classifies waste into three categories: trash, recyclable, and compostable [31]. However, none of these works classifies fruit or vegetable wastes.
This work proposes the classification of UOWs using CNNs, focusing on the inedible fraction of fruits and vegetables (peels and cores). The above facilitates estimating the C/N ratio of different UOWs and establishing the appropriate proportions before starting the composting process. Another contribution from this project is a database of UOW images since there is no such database available.
This document contributes to the United Nations Sustainable Development Goals for Latin America by promoting the reuse of UOW which makes up approximately 50% of the waste generated in cities [3] through the household composting process.
Hence, it pretends to avoid the impact of the final disposal of UOWs on landfills, which propitiate the generation of toxic and greenhouse gases, water and soil contamination, and landscape degradation in the surrounding population.
Household composting releases five times less ammonia, methane, and nitrous oxide than those industrial which consumes up to 53 times more resources (transport, energy, water, and infrastructures) and produces volatile organic compound emissions [32].
Some commercial devices compost household waste by mixing it while maintaining humidity and temperature. However, the resulting product is deficiently stable to be applied immediately afterward in gardening or agricultural activities. Although they are compact devices, their price is like a large appliance [33].
Besides, the application of machine learning techniques provides automatic classification of UOWs before passing through the composting process. That allows enhance the management of the composting process and estimate the final product quality.
It would help to avoid energy consumption due to the use of electronic equipment and laboratory reagents Furthermore, the design purpose of a CNN model from scratch is to have a compact model, which is expected to be embedded in a low-power processing board or a mobile device such as a smartphone.
3 Methodology
The system for estimation of the C/N ratio of UOWs is composed of two parts: 1) an index database of selected UOWs for this study, 2) an Automatic C/N ratio estimator for UOWs (Fig. 1). An index is a numerical correlation of a particular UOW in a digital image with its qualitative (color and stage of decomposition) and quantitative (weight and C/N) characteristics.

3.1 UOW Index Database
The creation of the UOWs index database involved a series of activities that are described in the following sections.
3.1.1 UOWs Selection and Collection
A detailed query allowed the identification of the most statistically consumed fruits and vegetables in Mexico [34] to select and collect their inedible fraction as UOWs [7,–37].
3.1.2 UOW Images Capture
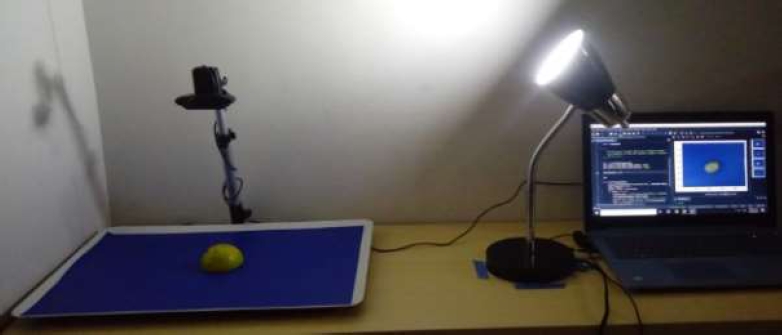
Digital images were captured under controlled conditions of the collected fruits and vegetables UOWs, using a systematic capturing algorithm developed in the PythonTM programming language [38] with the OpenCV (Open source Computer Vision) library [39]. This algorithm tagged and stored the images automatically through a Logitech c920 webcam located overhead plane at 0.30 m and a white light source from a 5 W LED lamp.
The UOWs were laid in an extended pose on a flat and blue background to create contrast with their natural colors, minimizing occlusion and allowing the separation of the UOWs from this background by creating corresponding filters, since the blue color is one of the three channels in the RGB color space. Images dimensions are 960 × 720 pixels in JPG format (Joint Photographic Experts Group).
3.1.3 Weight Measurement
After capturing the image, the weighed of each UOW, expressed in grams (g), was measured by a digital balance, trademark Queen Sense with a resolution of 0.01 g and a range from 0.01 to 500 g, and recorded in the index database.
3.1.4 Class Assignation
In this study, a class is the type of UOW and a stage of decomposition. The decomposition stage of the UOWs was categorized as initial, middle, and advanced, mapping the UOWs value to a class specified by predefined thresholds. Additionally, a color scale is related to each UOW class based on the Von Loesecke [40] maturity and color scale of postharvest bananas.
3.1.5 Decomposition Stage Determination
The UOWs are separated from the blue background of each captured image to assess their stage of decomposition based on the oxidation process, which is shown mainly with dark brown and black characteristic colors, although gray and white colors could be present in organic wastes due to fungi colonization [41]. The UOW decomposition stage
where
3.1.6 C/N Ratio Determination
A systematic search of the C/N ratio content for the selected OUWs followed the methodology based on criteria for review, selection, and evaluation of scientific material published on a study subject [43]. The systematic search was complemented with data obtained from laboratory analysis for the estimation of carbon and nitrogen content in UOWs.
The laboratory analysis was performed at Centro de Investigaciones Biológicas del Noroeste, S. C. (CIBNOR), in La Paz city, B.C.S. state, México, implementing the Dumas method to estimated nitrogen in a Leco FP-528 equipment.
The carbon content
One-way ANOVA analysis was applied to the results obtained using the R programming language [44]. The p-value was calculated and compared with the value of α-level (0.05) to establish if the differences between groups (decomposition stage) are statistically significant.
3.2 Automatic C/N Ratio Estimator for UOWs
The automatic estimation of the UOW C/N ratio from a digital image consisted of three steps: 1) UOW images classification, 2) UOWs weight estimation, and 3) C/N ratio estimation for UOWs.
3.2.1 UOW Images Classification
The classification of a UOW with its stage of decomposition was based on a CNN approach, adapting and proposing CNN algorithms. The set of UOW images was labeled into the classes corresponding to the UOW established decay stages, distributing each one into three image subsets for the CNN training, validation, and testing [45].
Then, the process executed data augmentation techniques to the dataset, applying random geometric transformations (flipping, rotation, translation, and zoom) to the images and obtaining new UOW image poses, but without generating data outside of reality [25]. The learning transfer strategy was applied to the pre-trained CNNs [17]. The CNN learning process was executed in the Google Colaboratory environment [46].
3.2.2 UOWs Weight Estimation
The weight data in the database serve to estimate the weight of a new UOW image through linear regression. The linear regression, generated in the R programming language [44], explains the relation between the UOW pixel number in the image and the UOW weight in grams.
4 Experimental Results
4.1 UOW Index Database
The UOWs index database includes the quantitative (weight, C/N ratio) and qualitative (color and maturity stage) characteristics of selected UOWs associated with an image.
4.1.1 UOWs Selection and Collection
According to the selection analysis, five fruits and vegetables with the highest consumption in Mexico were selected: banana (Musa paradisiaca), apple (Malus domestica), orange (Citrus sinesis), lemon (C. aurantifolia), and potato (Solanum tuberosum). Table 1 shows the annual consumption per capita in México of the selected fruits and vegetables, where their inedible fraction (waste) are mainly peels.
Table 1 Annual consumption and the inedible fraction of fruit and vegetables selected for the study
| UOW | Annual consumption per capita (kg) a | Inedible fraction b | Fraction (%) b |
| Apple | 8 | Peel, core | 12 |
| Banana | 14.4 | Peel | 35 |
| Orange | 37.2 | Peel, seeds | 30 |
| Lemon | 15.1 | Peel, seeds | 34 |
| Potato | 15.1 | Peel | 16 |
a [34], b [7,35–37].
4.1.2 UOW Images Capture
7,500 RGB images of the selected fruit and vegetable categories compose the UOW dataset; 1,500 core and peel images of apple, banana, lemon, orange, and potato, respectively, balancing equally the image datasets for each decomposition stage. Fig. 2 shows the system for capturing UOW images, and Fig. 3 depicts an image set with UOWs in an extended pose, particularly the banana peels, on the blue background.


4.1.4 Class Assignation
Class assignment resulted in 15 classes, each type of UOW (apple, banana, lemon, orange, and potato) associated with a decomposition stage (initial, middle, and advanced). An initial stage UOW has approximately one day of being collected, a middle stage UOW has at most seven days, and an advanced stage UOW has more than seven days.
4.1.5 Decomposition Stage Determination
The L channel (luminosity intensity) of the CIELab color space was chosen to estimate the decomposition stage of a UOW in an image applying Equation (1). Decomposition stages thresholds were established on the L channel to count the dark pixels (dp), setting

Fig. 5 Banana peel stage of decomposition based on L channel of the Lab color space: a) initial, b) middle and c) advanced
Finally, the image histogram was generated in the L channel, and the thresholds were applied to determine the composition stages. The decomposition stage algorithm allowed categorizing a UOW image dataset into the 15 classes, with accuracies from 52-55 %.
Thus, this process was visually supervised to corroborate the correct estimation of the decomposition stages of the UOWs shown in the images to obtain an accurately labeled dataset, using a color scale related to each UOW category in three stages of decomposition: initial, middle, and advanced (Table 2).
4.1.6 C/N Ratio Determination
The C/N ratio systematic search of UOWs obtained 2988 articles with the search engines proposed: 971 full documents and 2017 abstracts. After eliminating duplicates, and applying the exclusion criteria, 20 papers were found that present the C/N ratio of selected UOW without indicating the stage of decomposition. This search leads to two observations. First, it is evident the lack of C/N data for UOWs, and second, the UOW decomposition stages are unrevealed data.
The one-way analysis of variance of the results of laboratory analyses suggests that there are significant differences in the C/N ratio of the UOWs in all stages, except for the case of orange in the middle and advanced stages. Table 3 shows the C/N ratio obtained by laboratory analysis for the three decomposition stages (initial, middle, and advanced) and the result of the systematic search.
Table 3 UOWs C/N Ratio. Laboratory analysis and systematic search
| UOW | Laboratory analysis | Systematic search* | ||
| Initial | Middle | Advanced | ||
| Apple | 106.06 | 78.72 | 88.65 | 48 |
| Banana | 56.45 | 39.79 | 43.43 | 34.34 |
| Lemon | 40.46 | 35.79 | 37.21 | 28.38 |
| Orange | 54.50 | 66.28 | 66.30 | 48.18 |
| Potato | 21.56 | 19.30 | 17.33 | 14.94 |
*[47,48,57–62,49–56].
4.2 Automatic Estimator of the UOWs C/N Ratio
After determining the decomposition stage of the UOWs in the images, a detailed image collection was made. The purpose was to have representative and balanced UOW images in the 15 classes with 500 images per class.
Then, each classes were divided into percentages of 70 (350 images), 20 (100 images), and 10 (50 images) for training, validation, and test respectively using Split-Folder© 0.4.3 library [63]. The UOW images were split randomly into train, validation, and test datasets (folders) for each class according to the programmed ratios.
4.2.1 UOW Images Classification
Three CNN architecture models were selected to train and compare their performance for UOW classification: 1) UOWNet, an own proposed CNN in this study based on the LeNet-5 network blocks, with five convolutional layers, one fully connected layer, and small kernels (3×3). 2) MobileNet developed by Google [64] applies 1×1 and 3×3 kernels in layers. 3) VGG16 proposed by Oxford University [65] consists of a stacked set of convolutional layers, with small kernels (3 x 3) [66].
The lack of a large amount of UOW data and the high computational cost to train CNNs from scratch encouraged the adaptation of the MobileNet and VGG16 pre-trained networks for classification tasks by transfer learning technique.
The same hyperparameters were set on each CNNs, including the loss function: categorical cross-entropy and the optimization function: Adam. A learning rate of 0.0001 with 100 epochs and a value for dropout of 0.2 were set, allowing the model to randomly remove some nodes during training and reduce overfitting [67]. Image dimensions were 224 × 224 × 3 (width, height, channels) with a batch size of 32.
Table 4 shows the resulting performance of the models for the UOW classification. For instance, the model completed for the apple core achieved an average accuracy of 85.62%. Fig. 6 shows the loss and accuracy graphs resulting from the training and validation phases. Fig. 7 shows the confusion matrices obtained in the testing phase of the three CNN models.
Table 4 Accuracy for the pre-trained CNN and OUWNet
| UOW | MobileNet | VGG16 | UOWNet | Average |
| Apple | 85.24% | 82.10% | 89.52% | 85.62% |
| Banana | 90.67% | 82.48% | 86.76% | 86.64% |
| Lemon | 68.57% | 59.52% | 73.23% | 67.11% |
| Orange | 80.86% | 72.95% | 82.48% | 78.76% |
| Potato | 82.66% | 73.04% | 86.47% | 80.72% |
| Model Average | 81.60% | 74.02% | 83.69% |


Fig. 7 Confusion matrixes obtained in the testing phase for the CNN models: Advanced, Middle, and Initial
Normalized confusion matrices (%) are generated for the test data and a better ranking is presented for MobileNet and UOWNet models.
Banana peel reflected an average accuracy of 86.64%, and the confusion matrices show a better performance for the MobileNet and UOWNet models.
Lemon peel presented the lowest average accuracy (67.11%) with the low percentages in the test classification. The models present accuracies of 78.76% and 80.72% for orange and potato peels, respectively.
These results also showed that the MobileNet and UOWNet models present higher accuracy than the VGG16 model. This could be explained because the VGG16 is complex for the small dataset size of this project for a large number of trainable parameters and convolutional layers, making it less efficient [67].
In the case of apple, lemon, and orange, this model tends overfitting. In contrast, the MobileNet model presents underfitting due to the MobileNet model was developed for mobile device vision applications, which reduces its accuracy [64].Fig. 8 depicts the CNN model performance considering the Kappa statistics (κ) ranging from 0 to 1.

This metric measures the reliability between the ground truth po (for labeled data that are the values of each UOW) and the results of the UOW CNN classifiers that are expected by chance alone
The Kappa values are associated with an agreement label [69] between computed classification (model results) and expected classification (by chance prediction) for the UOW classifiers: very bad (<0.00), bad (0.00-0.20), regular (0.21-0.40), moderate (0.41-0.60), good (0.61-0.80) and very good (0.81-1.00).
According to the Kappa statistic, the UOWNet models presented a good agreement, whereas the MobileNet and VGG16 models performed a moderate agreement for the lemon class.
Increasing the size of the UOW dataset and adjusting the hyperparameters could improve the classification accuracy for any of three CNNs applied [31].
4.2.2 UOWs Weight Estimation
The weight estimation for each UOW class was obtained using the linear regression method. Five different models were generated to explain a linear relationship between variables: the number of pixels and the associated weight (in grams). Equation (5) describes this relation:
where

The results of weight estimation revealed that the best model explaining the variation of data were the apple and potato models (R2 ≥ 90). This is due to the apple core and potato peel having a consistent shape and few variations in the number of pixels for any of the three stages of decomposition.
The weight estimation in some images is limited to the pose of the UOW, resulting in a lower account of pixels. Such is the case for banana peel; the model obtained explains 72% of the data variation (R2 = 72).
When capturing the image, placing the UOWs extended fully would increase the explanatory percentage between the variables weight and the number of pixels for all types of UOWs. Another variable, such as the decomposition stage, could be considered to increase the correlation.
The result in the linear models of the orange and lemon classes (R2 = 62 and R2 = 63, respectively), can be explained by the fact that some orange and lemon wastes still contained juice, which means that the weight may be greater than the weight estimated by the linear model approach.
4.2.3 C/N Ratio Estimation for UOWs
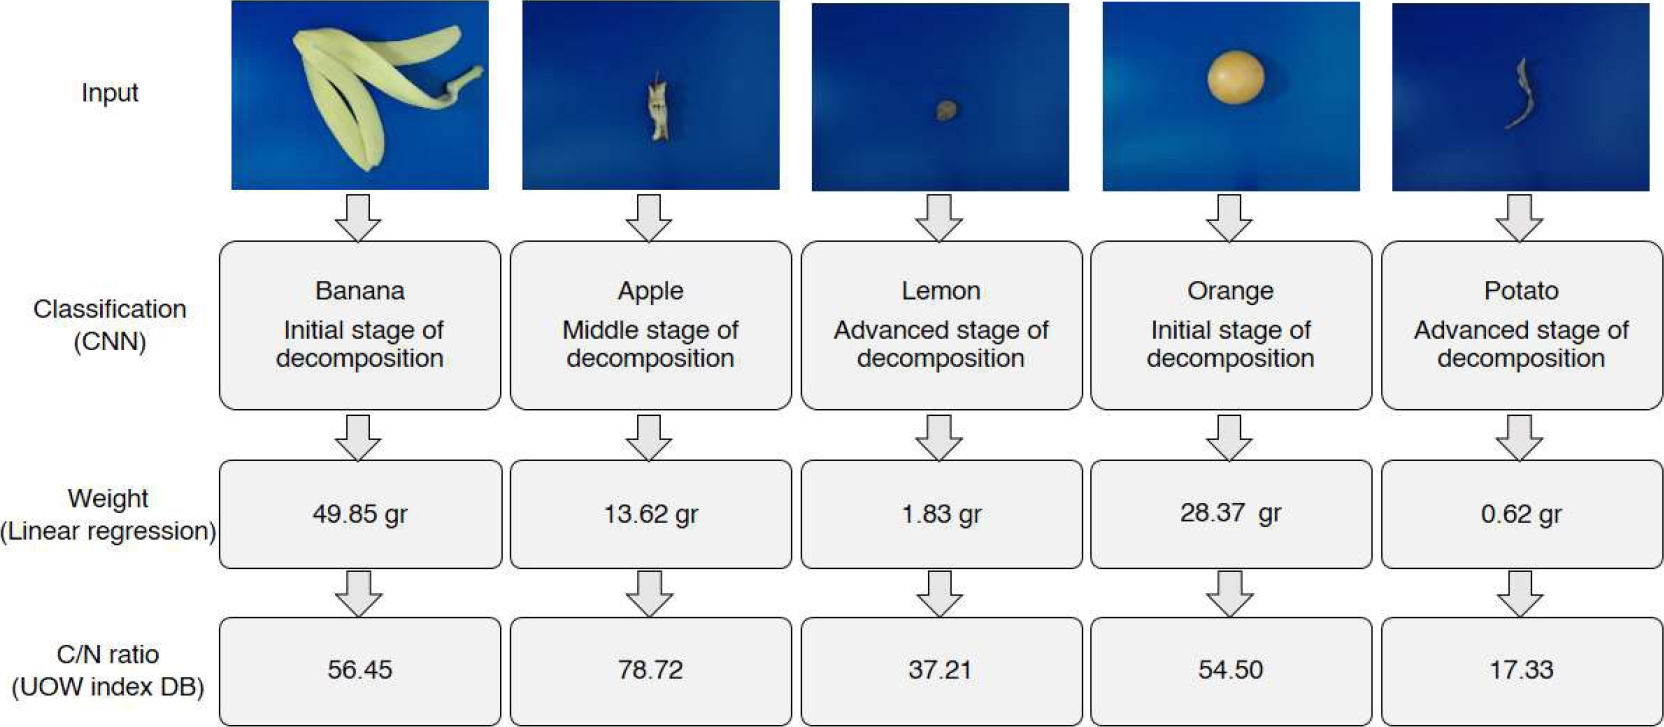
The proposed framework identifies the class of each UOW (type and decomposition state), assesses its C/N ratio from the laboratory analysis C/N result (Table 3), and calculates its weight by the corresponding linear model to estimate the resulting C/N ratio of the mixture of UOWs.
Fig. 10 depicts an exercise for UOWs classification, weight estimation, and C/N ratio query. Once the relative weight (
5 Conclusion
The proposed CNN-based method to estimate the C/N ratio of UOWs through images is a practical and appropriate preprocess as an immediate alternative and less expensive than laboratory analyses.
The transfer learning strategy allowed the training of the pre-trained CNNs with new image categories: apple core and banana, lemon, orange, and potato peels.
The UOWNet model showed a significant performance in the testing phase compared to the MobileNet and VGG16 models, suggesting that increasing the layer number, adapting the hyperparameters, and increasing the dataset, may obtain better performance for UOW classification. The latter also would imply a lower computational cost compared to the other CNN models.
The paper contribution includes a UOW classification based on the decomposition stage and a database of UOW indices correlating qualitative and quantitative characteristics.
In the future, more experiments will be necessary for improving the image set, also testing other filter sizes to improve the overall performance of the proposed model to classify the decomposition stages of UOWs.
Further work will generate a trained CNN model to classify the UOW using embedded and mobile devices for fieldwork.

