


 nova página do texto(beta)
 Inglês (pdf)
 Artigo em XML
 Referências do artigo
 Enviar este artigo por email
 Citado por SciELO
  Similares em
SciELO
Similares em
SciELO 
 Permalink
1 Introduction
Information security is an área in constant evolution, mainly with two approaches, defensive and offensive. In both approaches, there are at least two roles: one is responsible of design, implement and monitor security controls to protect information assets, and the other is responsible of assessing the security posture of an organization. Secondly, at the time of writing, companies are moving their own data centers to cloud computing-based infrastructure and services. Regardless of whether assets are on-premises or in the cloud, security dimensions cover computer, network, and information security. Traditionally, security controls have been integrated into layer-based models from a depth approach [1-2].
On this scenario, the defensive side implements technical controls in the network architecture to prevent attacks at different layers, as firewalls, intrusion detection systems (IDS), intrusion prevention systems (IPS), network address translation (NAT), and others; additionally, some security controls can modify statically or dynamically default configurations, e.g., protocol scrubbers or hardening processes, avoiding the exposure of unnecessary information on the network.
This set of settings reduces the ability of the offensive side to execute an identification process based on exposed information. Additionally, a trending topic on defensive security controls consists of dynamic definition of the system architecture, bringing up the concept of Moving Target Defense (MTD), which aims to prevent attacks based on the constant variation of an asset or target, reducing the effectiveness of previous recognition info obtained by the offensive side [3].
On this scenario, despite the advances on the design of the security controls on the defensive side, little progress has been made on offensive techniques to identify and fingerprint obfuscation actions on security controls. In this sense, this research proposes a novel strategy to identify static and dynamic security controls based on machine learning.
On this research we analyzed the behavior of three security controls standard to change default configurations to reduce successful fingerprint: protocol scrubbers, NAT networks, and OS hardened hosts.
2 Related Work
NAT as a security control is used to hide hosts behind a public IP address, i.e., the hosts behind a NAT are in a private network and must go through it to communicate with other networks; it must be highlighted that cannot be started communication with a host behind the NAT. Besides, a Network Address Port Translation (NAPT) executes not only an address translation but also port translation; these kinds of networks are used to offer services installed in different hosts, using just one public IP address.
Some researchers contributed with techniques that could be used to identify NATs, Mongkolluksamee, Fukuda. et al. presented a passive technique for detecting NATs [4]. They counted the number of active hosts behind a NAT by observing the network traffic generated when five hosts with different operating systems downloaded 20 files.
They considered the ID field from the Internet Protocol (IP), TCP sequence number, and TCP source port to identify coherence and count the number of hosts accessing the internet using a Bellovin’s algorithm. This research expected to have the same results analyzing the IP ID field, but nowadays, some NAT devices change the original values. A protocol scrubber is a transparent and interposed mechanism for explicitly removing network scans and attacks at various layers [5].
Restricting an attackers ability to determine the operating system of a protected host, as the design and implementation of a TCP/IP stack fingerprinting scrubber presented by Smart, et al. in [6], that can avoid Nmap, p0f, and IpMorph from identifying the host OS of a target.
Fingerprinting tools, as mentioned above, were unable to identify the operating systems when faced with a protocol scrubber because they directly compare features with a database. Based on this, our research takes advantage of ambiguities during the network protocol implementation or manipulation, to identify patterns that lead to the potential existence of protocol scrubbers.
Hardening is the process of securing systems by removing unnecessary services and applications and modifying default implementation values to reduce the attack surface. This research extracted and analyzed features from hardened systems to identify them by verifying their congruence.
Typically, hardening a host involves more than one security procedure, i.e., adding protections to the operating system, patching the kernel, host firewalls, and others. In [7], Kaur and Singh. et al. analyzed some attacks based on operating system fingerprinting. They discussed some approaches to protect a system from OS fingerprinting.
They proposed to harden it by modifying some kernel values to impact default values and mislead fingerprinting tools. Nowadays, hardening a host is a mandatory practice, in this sense, the evaluation processes must be more robust and intelligent to determine preventive controls compliance.
Based upon those mentioned above, this paper proposed identifying obfuscation devices using Machine Learning algorithms, particularly classifiers, boosting, and clustering. In this research, an analysis of network flows of real and virtual environments was carried out to determine a set of network characteristics that were used to identify network elements. Three security controls were analyzed: NAT, protocol scrubbers, and hardened hosts.
3 Security Controls Analysis
This section describes the analysis, design, and implementation of the security controls aimed to identify from an offensive approach.
According to ISO 27001 [8] a security control is defined as “any administrative, managerial, technical or legal method that is used to modify or manage information security risk”, i.e., practices, processes, policies, procedures, programs, tools, techniques, technologies, devices, and organizational structures. In our research context, a security control focus on programs, tools, techniques, technologies and devices used them to modify information to prevent from a successful enumeration process.
The standard security controls considered for experimentation and testing were free source implementations. Initially it was assumed that the responses of the controls would be affected by a virtualization layer, so it was decided to consider environments with native installations and virtualized installations.
3.1 NAT
A common NAT implementation is directly over an operating system using firewall rules by using software based on the Netfilter framework. In this research, the NAT analysis involved two different environments.
The first one, a NAT implemented through IPTables on a physical non-virtual environment. The second one, using IPTables installed in a virtual environment. This allows having samples from both types of systems to extract features and identify NATs as a security control from a wide approach.
3.1.1 NAT as Non-Virtualized System
The analysis of a NAT in non-virtualized systems was done by studying the involved network protocols, particularly protocols that offer more information to identify a NAT according to state of the art. TCP and IP protocols were analyzed in NAT network traffic because it translates the source IP address and TCP ports. This research proposed to identify NAT networks analyzing these protocols according to the study of changing fields as the port range.
The scenario implemented to analyze a NAT is shown in Figure 1. Users are Linux and Windows stations connected to a Gateway configured as a Router, Firewall and NAT, implemented with IPTables.

To analyze the network traffic generated by the clients, we use a traffic sniffer called Analyzer in Figure 1. This sniffer captures network traffic behind and after the NAT, compares the changes made by the NAT and extracts the features that best describe such implementation. It is worth mentioning that all of devices in the scenario are physical.
3.1.2 Virtualization Software
Nowadays, many companies have been migrating their physical servers to virtualized systems, as Gartner reports in [9]. Due server virtualization infrastructure market is mature, more than 80% of workloads are virtualized. In this sense, this research analyzed virtualized NAT Networks as well.
The first virtualized scenario is shown in Figure 2, where machines and network devices were virtualized. User machines were virtualized using VMWare Workstation 12, and the NAT was considered the default NAT interface from the VMWare interfaces list.

In the second virtualized scenario, virtualized user machines are connected to a Router/NAT running over a virtualized system.
The Router/NAT was implemented using IPTables on a Debian Linux distribution.
From the environments above, the feature extraction was through an experimental and theoretical analysis:
− Analysis of the kernel parameters documentation.
− Review of the open-source protocol scrubbers documentation.
− Identification of features extracted in other research papers.
− Analysis of the network traffic samples collected from different environments.
The values to identify a NAT were extracted and selected, analyzing the protocol fields changed by the NAT implementations:
IP TTL: TTL is a field of the IP protocol that lets a router know whether a packet has been in the network for a long period and should be discarded. In this research, the TTL field lets us identify whether there could exist more than one host behind a public IP address based on the outgoing traffic. Due to each Operating System has different default implementation values, it is not common to have different TTL values behind an IP address in the proposed scenarios. However, it is possible to find a protocol scrubber in a host that modifies the TTL value, then were analyzed values that complement such behavior.
IP ID Range: The ID is a field in IP protocol used as part of network packets segmentation and fragmentation processes. Such value must be unique within a flow and maximum lifetime for all datagrams. We analyzed the ID field to create sets of ID values to compare the range for a regular host and NAT Network based on the outgoing traffic.
TCP port range: NAT networks usually change the source port by another one to avoid problems when it is the same for two machines. Causing the use of ranges of source ports higher than a normal host range, property that this research took advantage of to identify a NAT Network.
When comparing the network traffic samples collected by the Analyzer, we found that the NAT implementations changed the IP TTL, IP ID range, and TCP port range. So, we extracted these values to train the machine learning algorithms described in the second part of this section.
3.2 Protocol Scrubber
A protocol scrubber is a security mechanism that aims to hide the identity of a host. Modifying the default implementation values for the most common network protocols analyzed to execute OS fingerprinting.
Three Open-Source protocol scrubbers were considered and analyzed:
Each protocol scrubber was installed in virtual and physical machines for the analysis. Studying their configurations for each of them to get the list of values they change. As a result, it was found a list of 16 values shown in Table 1 that were commonly modified by protocol scrubbers, mainly TCP, IP, UDP, and ICMP.
Table 1 PDU fields modified by Protocol Scrubber
| Protocol | PDU fields modified by Protocol Scrubber |
| TCP | TS option, Urgent pointer, WinSiz, Sack, Ack retries, Nop option, WinScale, Max window, Options order |
| UDP | Checksum |
| ICMP | Length, Payload |
| IP | TL, ID, ToS. Flags |
Also, we studied the kernel parameters that were indirectly affected, e.g., RTT, timers, the number of packet retransmissions, and even the length of a packet. It was used to obscure an operating system.
3.3 Hardened Host
Besides, we considered hardened hosts, analyzing not just recommended configurations for hardening from benchmarks. Considering all possible parameters that can be modified in the kernel that affects the network space in some way to obtain cases for each target.
The studied Linux kernels were the versions 3.16 and 4.1, and the analyzed variables were:
− The ones related to the functionality of IPv4.
− The ones that can be change.
− The ones that prevent attacks.
− The ones that manage network attacks.
− The ones useful to execute fingerprinting.
Were analyzed the kernel parameters in proc/net/core/*, /proc/net/ipv4/*, /proc/net/ipv6/*, and /proc/net/unix/*. Initially we identified 750 parameters related to network configuration, then those that had effects with remoting were filtered out, and the result was 340 network parameters.
Then was analyzed parameters involved in attacks protection as well as parameters able to modify fields directly in network protocols, resulting in 130 parameters to harden a host.
Finally, we studied hardened hosts through a host identification approach and were found 25 values that can be obtained or calculated through network interactions. Additionally, we identified eight values that differentiate the analyzed devices once we made the selection. Table 2 lists the eight values found in hardened hosts.
Table 2 Modifiable settings analyzed for hardened hosts
| Settings | Function |
| tcp_syncookies | TCP SYN cookie protection |
| icmp_echo_ignore_broadcasts | Prevents being part of smurf attacks |
| icmp_ignore_bogus_error_responses | Ignore ICMP Bogus Error Responses |
| conf.all.accept_source_route | Disable IP source routing on all interfaces |
| tcp_fin_timeout | Reduce the amount of time that a TCP circuit can stay in the TIME_WAIT state |
| tcp_synack_retries | Controls the number of retransmissions in Linux operating system. |
| tcp_timestamps | Protect against wrapping sequence numbers, round trip time calculation implemented in TCP |
| tcp_syn_retries | Mitigates against SYN flood attacks |
4 Identification of Security Controls Using ML
This section describes a strategy to identify security controls integrated by a trained detection models by Machine Learning algorithms.
4.1 Design
Machine Learning involves algorithms to predict, organize data, and describe structures. This research faced a problem in making predictions based on human knowledge. With this context, it was chosen to employ supervised learning through classification and regression based on previous analyses.
Generally, classification is used when data is used to predict a category. The data involved more than two categories, so it was needed to implement multi-class classification. During the analysis of classification algorithms, four were selected based on accuracy, training time, linearity, number of parameters, and number of features of the data used in this problem:
4.1.1 Evaluation Approach
We evaluated the four algorithms using metrics in Equations 1, based on the confusion matrix.
Recovery is the proportion of cases correctly identified as belonging to class
4.1.2 Dataset
The network devices considered in this work were those manipulate information, specifically NAT, protocol scrubbers, and hardened hosts. The process started by analyzing the network protocols TCP+IP and ICMP, from specific enumeration requests. One of the fields analyzed was the IP ID and its behavior in varied conditions and with multiple types of applications.
The dataset used for training and validation process have the structure shown in Table 3, where xn is a feature from the protocol, and the first column is the label. The network samples for each security control were captured from physical and virtual systems. The number of dataset samples used for training and testing is shown in Table 4.
Table 3 Data structure used for classifiers training
| Label | Features |
| NAT | feature |
| Prot.Scrubber | feature |
| Hardened feature |
|
Table 4 Samples used for training and testing
| Sec. Control | Physical | Virtual | Total samples | #Packets |
| NAT | 4 | 6 | 10 | 100M |
| Protocol Scrubber | 3 | 6 | 9 | 5M |
| Hardened Host | 4 | 8 | 12 | 6M |
| Total | 11 | 20 | 31 | 111M |
Samples of the NAT network were from physical and virtual environments. Physical samples were captured from 4 university laboratories by IPTables implementation on a Debian system. We captured traffic samples for 4 days. For the virtual environments, samples were captured fr3om:
− Linux and Windows users virtual systems and a IPTables Gateway installed in a Debian virtual system on VMWare.
− Linux and Windows users virtual systems and VMWare NAT interface as a Gateway.
− Linux and Windows virtual systems as services behind IPTables installed in Debian virtual system on VMWare.
− Linux and Windows users virtual systems and a IPTables Gateway installed in a Debian virtual system on Virtual Box.
− Linux and Windows users virtual systems and aVirtual Box NAT interface as a Gateway.
− Linux and Windows virtual systems as services behind IPTables installed in Debian virtual system on Virtual Box.
Protocol scrubber samples were captured by installing IP Personality, Scrub tech, and IP log on physical and virtual systems. We captured the traffic generated from the interaction between scanners and the target system.
The systems were virtualized in VMWare Workstation and Virtualbox, six samples of network flows were generated and collected. Finally, for Hardened Host were installed four hardened operating systems: Anik O, Fireball, Hardened Linux, and Pentoo.
Each of them was installed in a physical and virtual system, using VMWare and Virtual Box to capture outgoing traffic generated by automated scripts and the interactions generated between a scanner and the target system.
4.2 Naive Bayes
Naive Bayes is a probabilistic classifier based on the Bayes theorem with strong naive independence assumptions between the features. Equations used in this research are shown in equation 2:
Table 5 shows the confusion matrix executing Naive Bayes with NAT, Protocol Scrubber, and Hardened samples. During the test of the algorithm, 50% of samples were used for training and the other 50% for testing.
Table 5 Confusion Matrix for Naive Bayes
| NAT | Protocol Scrubber | Hardened Host | Unknown | |
| NAT | 1 | 1 | 1 | |
| Protocol Scrubber | 3 | 1 | ||
| Hardened Host | 5 | 1 |
Each sample has at least 5,000,000 packets filtered to process just IP, TCP, and ICMP protocols, interactions, and statistics from ports and IP IDs analysis, obtaining at least 2,000,0000 packets for each sample. Based on recovery and precisión metrics for each security control was calculated the accuracy as follows:
The evaluation metrics for the Naive Bayes classifier obtained from the confusion matrix are shown in Table 6. Results show that protocol scrubber classification is the worst compared with the other security controls. However, notice that the protocol scrubber has a dynamic value for the protocol fields, unlike the others.
4.3 Support Vector Machine
Support Vector Machine is a supervised learning algorithm for classification, usually, it is used for clustering if implemented as an unsupervised algorithm. There are two kinds of SVM classifiers: SVM Linear classifier and Non-Linear SVM classifier.
This research considered non-linear SVM, applying multi-class classification through a “one-against-one” approach [13], on the Scikit framework. The
Equations used in this algorithm are shown in equation 4, where given the training vectors
Subject to
Its dual is:
Subject to
where:
|
is the vector of all ones |
|
is the upper bound |
|
is a |
|
is the kernel |
The decision function was:
Table 7 shows the confusion matrix for SVM, with NAT, Protocol Scrubber, and Hardened samples.
Table 7 Confusion Matrix for SVM
| NAT | Protocol Scrubber | Hardened Host | Unknown | |
| NAT | 4 | 1 | ||
| Protocol Scrubber | 4 | |||
| Hardened Host | 6 |
Accuracy was calculated as:
Using the confusion matrix, was computed the evaluation metrics for SVM and are showed in Table 8, where the number of classification errors was almost zero. Therefore, the accuracy of this algorithm was high.
4.4 KNN
K nearest neighbors is a classifier that stores all available cases and classifies new ones based on similarity measures. Equations used in this research are shown in equation 7.
The dataset integrates few samples with a large amount of data in each of them, in this sense,
The total of samples for NAT networks were 10, using 5 for training and 5 for testing; 8 as a total of samples for protocol scrubbers, having 4 for training and 4 for testing, and finally a total of 12 samples for hardened hosts, having 6 for training and 6 for testing.
where:
|
is the feature in the database |
|
is the input feature to classify |
|
is the distance that represents how different are the input and the database items |
Table 9 shows the confusion matrix for KNN, with NAT, Protocol Scrubber, and Hardened samples.
Table 9 Confusion Matrix for KNN
| NAT | Protocol Scrubber | Hardened Host | Unknown | |
| NAT | 3 | 2 | 1 | |
| Protocol Scrubber | 3 | 1 | ||
| Hardened Host | 1 | 4 | 1 |
Accuracy was calculated as:
The evaluation metrics for NAT, protocol scrubber, and hardened hosts are shown in Table 10. Results observed were not as expected.
4.5 Decision Tree
Decision tree as a predictive model lets a target variable take a discrete set of values, represent class labels, and represent conjunctions of features as branches that lead to class labels.
The equation used in this research is shown in Equation 9:
Fore training and testing, 50% of the samples were used. Using five samples for training and four for testing NAT networks.
Four samples for training and four samples for testing protocol scrubbers. Finally, six samples for training and six for testing hardening hosts.
Table 11 shows the confusion matrix for NAT, protocol scrubber, and hardened classification by a decision tree algorithm.
Table 11 Confusion Matrix for Decision Tree
| NAT | Protocol Scrubber | Hardened Host | Unknown | |
| NAT | 2 | 3 | ||
| Protocol Scrubber | 1 | 1 | 2 | |
| Hardened Host | 5 | 1 |
Accuracy for decision tree classifying NAT networks, protocol scrubbers, and hardened hosts was calculated as follows:
It is worth mentioning that the decision tree algorithm presented lower results to identification samples did not use in the dataset as described in Table 12. However, this property could be useful to identify specific hardened hosts, NAT networks, or protocol scrubbers.
4.6 ADA Boost
Once we analyzed the individual results for each classifier, it was identified that each of them has good results when used for specific purposes. In this sense, it was proposed to integrate them together with ADABoost, an algorithm for constructing a “strong” classifier as a linear combination of other classifiers referenced as “weak”, the mathematical model is represented by Equation 11:
where:
|
is a “weak” classifier |
|
is an assigned weight for each instance in the training dataset |
Each weighted prediction made by a weak classifier goes through a strong classifier, which weights as “alpha values” the previous predictions. Finally, each alpha value is summed up in the circle that processes the result, as Figure 3 shows.
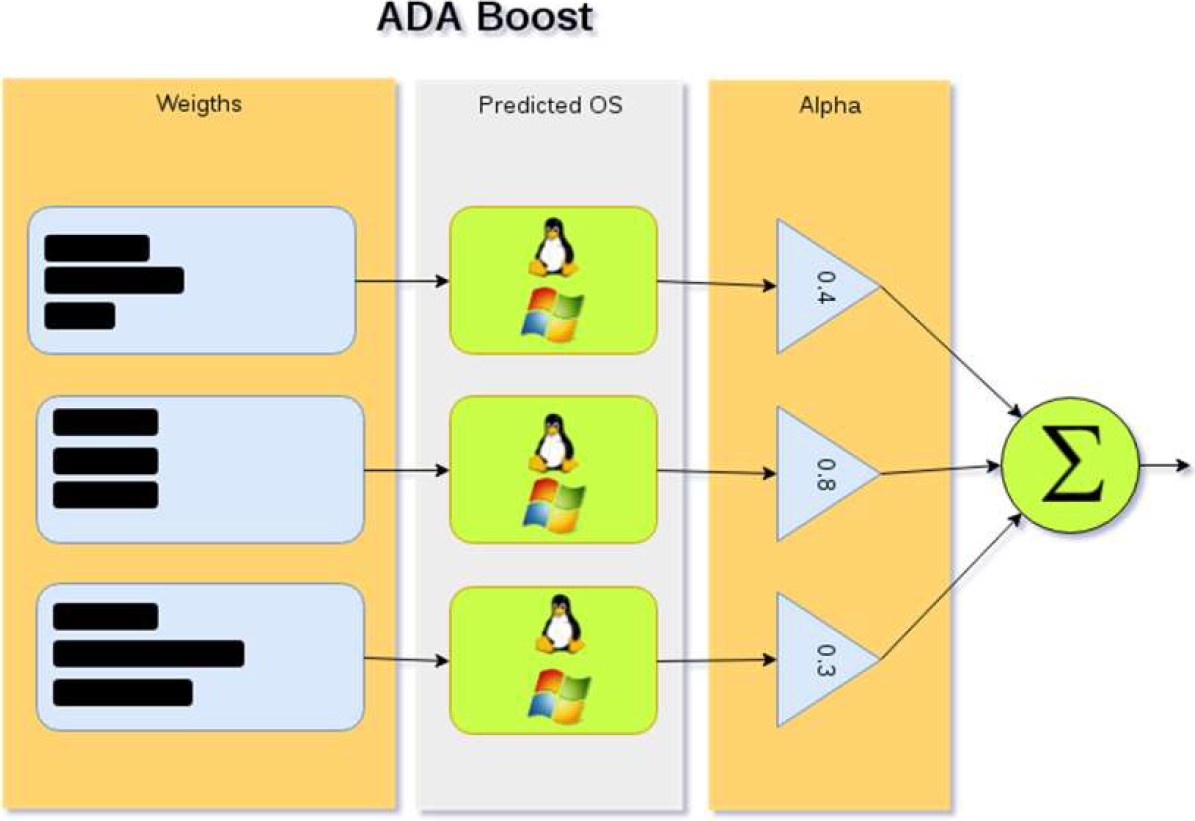
For this research, weak classifiers were Naive Bayes, KNN, SVM, and Decision Tree, that classified NAT networks, protocol scrubbers, hardened hosts and weighted after the classification process. The expected result of ADA Boost is a representative output of the identified security control.
The research methodology was experimental, and it is shown in Figure 4. As it can be seen, some inputs required to be preprocessed, due there are vectors with a big number of values describing an IP address, TCP ports and IP IDs.

To identify a set of values with similar ranges of values, there was used K-means clustering algorithm. We identified that the TCP port assignment and IP IDs maintain a range of values established by each type of operating system, letting us analyze whether there is more than one operating system behind an IP address. Such information made it possible to identify NAT networks and distinguish between them and protocol scrubbers.
It was found that the protocol scrubber also changes the TTL values in operating systems, for one or more values, causing that OS Fingerprinting was not able to identify the OS. Same pattern was found in different sets of TTLs.
Although, once we analyzed the number of different TTLs generated by an IP address (meaning the existence of more hosts behind), we were able to verify consistency between them and the number of operating systems masked by an IP address based on IP ID and TCP port analysis.
Ranges of values were found in NAT network traffic samples through experimentation scenarios. IP IDs and TCP ports range of different operating systems was identified and was set as the
Table 13 Normal difference between Max-Min IP ID / TCP Ports values for an Operating System
| IP ID | TCP Ports | |
| Max-Min | 30,000 | 1,500 -15,000 |
The K-means result allowed us to determine the different sets of TTLs numbers based on number of clusters. The output was a vector represented with such clusters that was the input for the classifiers as is shown in Table 14, where “{}” represents a set and, “#” the set cardinality.
Table 14 Format Inputs for classifiers
| Protocol | PDU fields modified by Protocol Scrubber |
| TCP | {SrcPort}{WinSize}{SACK}{NOPOption} {WinScale}{MSS}{OptionsOrder} |
| UDP | {TTL}{ID} |
| ICMP | Length, Payload |
| IP | #SynAckRetries # RTT |
Figure 4 shows the proposed model to join weak classifiers with a strong one and include clustering algorithms for the data preprocessing.
Based on the same metrics used for weak algorithms, ADA Boost was trained for each sample and the confusion matrix obtained is shown in Table 15.
Table 15 Confusion Matrix for ADA Boost
| NAT | Protocol Scrubber | Hardened Host | Unknown | |
| NAT | 5 | |||
| Protocol Scrubber | 1 | 3 | ||
| Hardened Host | 6 |
Accuracy for ADA Boost classifying was calculated as:
The obtained results for ADA Boost are described in Table 16.
5 Results and Discussion
The evaluation metrics for each algorithm were the main indicator regarding the functionality of such techniques to identify the security controls. We compared individual results and how ADA Boost improved them.
The metrics for Bayes show that the NAT network is sometimes confused with protocol scrubbers, expected behavior since there exists a variety of TTLs, IDs, and ports. Properties that were essential to identify a NAT network with different operating systems masked, so the study of the ranges was crucial to differentiate them.
Self-properties like the fact that some protocol scrubbers change the default value for multiples. SVM evaluation metrics show that few inputs were classified incorrectly, and compared with other algorithms, accuracy was high. The prediction results presented by SVM were the best over the rest of the classifiers, which indicates that it achieved an excellent separation margin between the hyperplanes.
In the KNN case, the distances between the features of the security controls identified in all cases are not significantly different, causing the classifier to confuse them. For example, NAT networks with protocol scrubbers, or protocol scrubbers with Hardened hosts. It is because not all protocol scrubbers change default values using a set of proposed values, some of them change the fields all the time. On the other hand, hardened implementations are changed only on time during the hardening process, positively impacting the KNN classification.
Finally, for the decision tree classifier, the best results are when features are in the training dataset. This research took advantage of such property, it was possible to study open-source security controls and extract their features to add them to the data for training, letting to identify most of the devices using a proper database. Even when the classifiers made some mistakes, the accuracy was high when incorporated into the ADA Boost decision stage. Pointing out that ADA Boost did not classify as unknown any sample.
Each classifier has advantages and disadvantages, as can be seen in the evaluation metrics in Table 17. The proposed model using a strong classifier based on weak ones was to improve the results. Even when the precisión of ADA Boost was the same as that of the best weak SVM classifier, it is expected that for unknown samples, the responses from using only SVM to using all four classifiers through one strong classifier would not be similar.
The confusion matrix for ADA Boost shows that the algorithm never considers an unknown output for real devices features, a feature that any classifier did during the testing phase.
6 Conclusions
The individual results of the implemented machine learning algorithms had good accuracy but only for identifying security controls with specific characteristics. However, a model with a strong classifier was proposed based on weak classifiers, obtaining better results when working together, a proposal made in this research to make an identification considering different classification approaches.
Manual and deep study over all possible parameters that can be modified to obfuscate network protocols let this research extract appropriated network fields to classify each security control. Some inputs that were initially considered direct input for each classifier had to be pre-processed to be able to work with proposed classifiers.
For example, during the analysis of the ID field in IP protocol, we made sets of values based on the hypothesis that existed some possible hosts masked by one IP address, such information offered information about the behavior of the network implementation in a device, but there were many data to analyze before starting the classification process.
Based on the analysis of security controls implementations that obfuscate information, the problem of identifying obfuscation security controls was solved using classification algorithms and features from passive and active information gathering. Main contributions were on the experimental feature extraction for security controls proposed to be identified in this research.
Machine learning algorithms were tested to identify obfuscation devices and the results allowed designing a proposal for a complementary structure to layers. Clustering models stand out in first layer, set of three models based on machine learning in second one, which are reinforced in a third layer by a strong classifier for the decision stage.

