


 nova página do texto(beta)
 Inglês (pdf)
 Artigo em XML
 Referências do artigo
 Enviar este artigo por email
 Citado por SciELO
  Similares em
SciELO
Similares em
SciELO 
 Permalink
1 Introduction
Variability in demand management due to a lack of methods that incorporate uncertainty in management processes generates problems in companies that market their products in retail environments [1]. Among the problems that appear in a company due to not having balanced demand management in a supply chain for products that frequently change offerings are excess inventory or lost sales [2].
These two effects in this type of dynamic products are evidenced in an inefficient supply, which will have a direct impact on the opportunity cost due to missing products to respond to the market or otherwise a level of excess inventory that immobilizes monetary resources.
This is usually due to not incorporating the uncertainty that appears in any future projection in traditional demand management models. The contribution of this study is to show how the Bayesian approach helps to improve demand management in a supply chain of sausage products facing changes in pricing due to commercial offers that the company makes to increase demand.
Among the results of the research are shown tools that support this coordination process, seeking to balance inventories and increase visibility of consumption to plan and organize supply in growth scenarios. Demand management which is the main input to a sales and operation planning process to coordinate and balance the supply chain need to be challenged [3].
Constant change of offers is a commercial and marketing strategy, which is usual in modern supermarket channels specially on food categories as a process implemented to manage product demand. This commercial strategy needs to be aligned to supply chain reference models such as SCOR to increase efficiency [4]. Should be considered that food supply chains require a circular economy design, making greater the need to improve process coordination [5].
2. Literature Review
Since the conception of the concept of integrated supply chains, many academic advances have appeared as research topics in market-driven approaches and inter- and intra-firm integration and coordination [6].
Taking as reference studies of research opportunities in the field of sales and operations planning for supply chains, we can find three trends that highlight the performance of coordination, implementation, and contextualization [7, 8].
Some of these developments fall into discovering principles and theories that can be applied in a supply chain; identifying the relevance, opportunities and challenges of the operations discipline applied in a supply chain and novel academic applications of methods and concepts coming from other fields of study to the field of supply [9].
Different approaches are used to solve how to obtain a feasible scenario, optimizing resources and product allocations on a decision support basis [10, 11].
In this venue sales and operation planning is one of the most complex processes in an organization. The evolution of this integrated process has become a source of added value generation by building reference models that are replicated and implemented to the extent of maturity, as required by each business.
This process is usually a direct field of application of operations engineering concepts in the links between the market and purchasing management, passing through warehousing and distribution [12]. As a chain, warehouse and distribution centers generate inventories and levels of coordination that become very fine as companies manage portfolios of thousands of products per geographic location grows [13].
The link in the chain closest to the market is the demand management link, and much of the results in the supply process depend on its management which should be aligned to a strategic alignment [14] and enabled by integrated IT systems [15].
A study was conducted showing a Bayesian demand forecast method obtaining a mean absolute percentual error (MAPE) values in an interval between 28 - 58%, which after applying a tabu search algorithm obtained a MAPE of 13% [16].
The importance of the Bayesian approach in price allocation to reduce the inventory level without harming sales highlights usefulness on supply modelling [17].
3. Sample and Methods
The study population consists of the products of a Peruvian mass consumption sauce company that supplies the supermarket market nationwide. The population is divided into two categories. Classic sauces (85 products) and gourmet sauces (35 products). Sampling was proportional to the size of the number of products in each category. For sample selection we used Equations:
where k: number of standard deviations used in a normal distribution,
e: error margin,
p: expected proportion of selecting a product that meets specifications,
q: complement of “p” (q=1-p),
N: Number of total products.
A stratified probability sampling proportional to the size of each category was applied as shown in Table 1, stratified factor = 93/120 =0.775.
Table 1 Proportional probability sampling
| Strata | Size of each stratum | Determination of strata size |
| Classic sauces | 85 | 85*0.775 = 66 |
| Gourmet sauces | 35 | 35*0.775 = 28 |
Table 2 Control group
| Strata | Sample strata | Control group size |
| Classic sauces | 66 | 33 |
| Gourmet sauces | 28 | 14 |
| Total | 94 | 47 |
For the selection, we considered the similar type of presentation among the products, in addition to being marketed in the modern channel and with diverse offers to stimulate demand. A review was implemented with programming in R language of the differences between the pre-test and post-test values, which automated the obtaining of results. The tools used were R Shiny libraries, Python programming language for Bayesian processes and web programming to upload data
3.1 Inventory Reorder Period Variable
To balance future consumption behavior with inventory replenishment management, a discrete Poisson function was used to identify the probability that consumption cannot be covered. This probability is compared with the probability of being above or below the actual demand. Obtaining the inverse function of consumption in a function of minimization of the cost of supply management composed of the unit costs of storage, costs of lost sales and the cost of requesting replenishment.
Being “p” the monthly periodicity, we use a function of cost of requesting that has a constant part and a variable part according to the excess cost interpreted in the cost of storing and the cost of not having the product available at what we consider the optimal point of exposure to give a service to the estimated. This optimal point is called critical fraction and is determined based on an adequate quantity to meet future demand. With this logic, two scenarios appear.
Scenario 1: (p): probability that the estimated quantity will be greater than demand.
Scenario 2: (1-p): probability that estimated quantity is less than demand.
In scenario 1, the effect that appears is related to the presence of surplus inventory and has an impact on fixed capital.
Scenario 2 generates the effect of missing units, which is interpreted as customer dissatisfaction for not being supplied.
Of these two scenarios, the most favorable scenario for business growth is scenario 1 because it reduces the risk of generating customer dissatisfaction and desertion. In this scenario, if there is a surplus of a product, there are more outlets from the commercial point of view because marketing strategies can be implemented to reduce inventories with offers in the next campaigns for the excess inventory.
In both scenarios we find different costs, in scenario 1, we will have the logistic cost (cost of storing, distributing, and acquiring or manufacturing the products), because we will have more units than necessary to satisfy the demand. In scenario 2, the opportunity cost or lost sale appears, which would be equivalent to the margin lost by not having the product in inventory.
Considering the utility function with “D”: uncertain Demand and Q: Quantity expected to service variable “D” (3). We consider “Cu” as the cost to underestimate demand and “Co” as the cost to overestimate demand. The value of “p” represents scenario probability of occurrence:
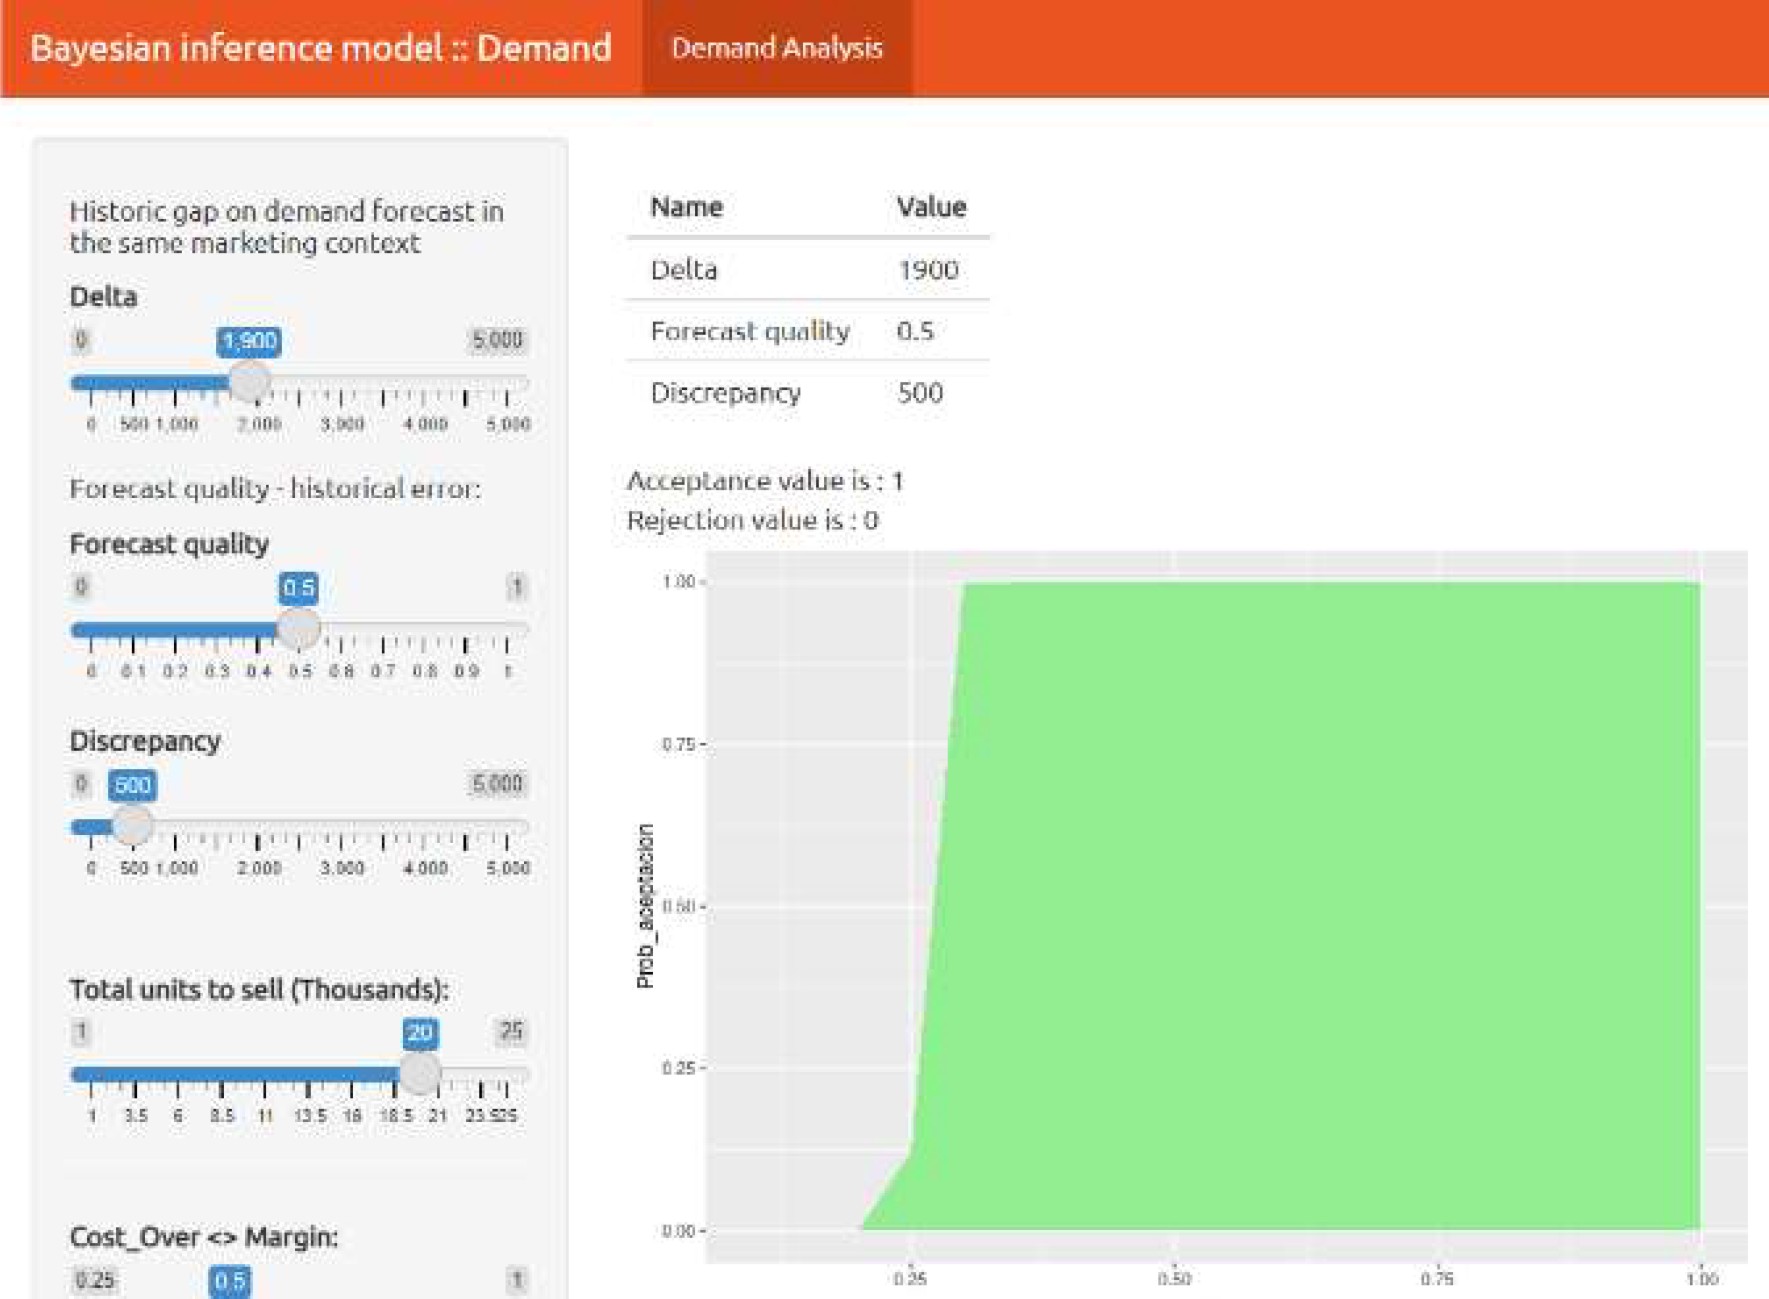
In mass consumption sauces products, margins are not constant since products vary each season in their discounts. In general, we consider a product with a high margin with a range of probability of being above the demand “p” as a uniformly distributed behavior with values between 0.7 and 0.9. On figure 1 we showed an application created in this research.
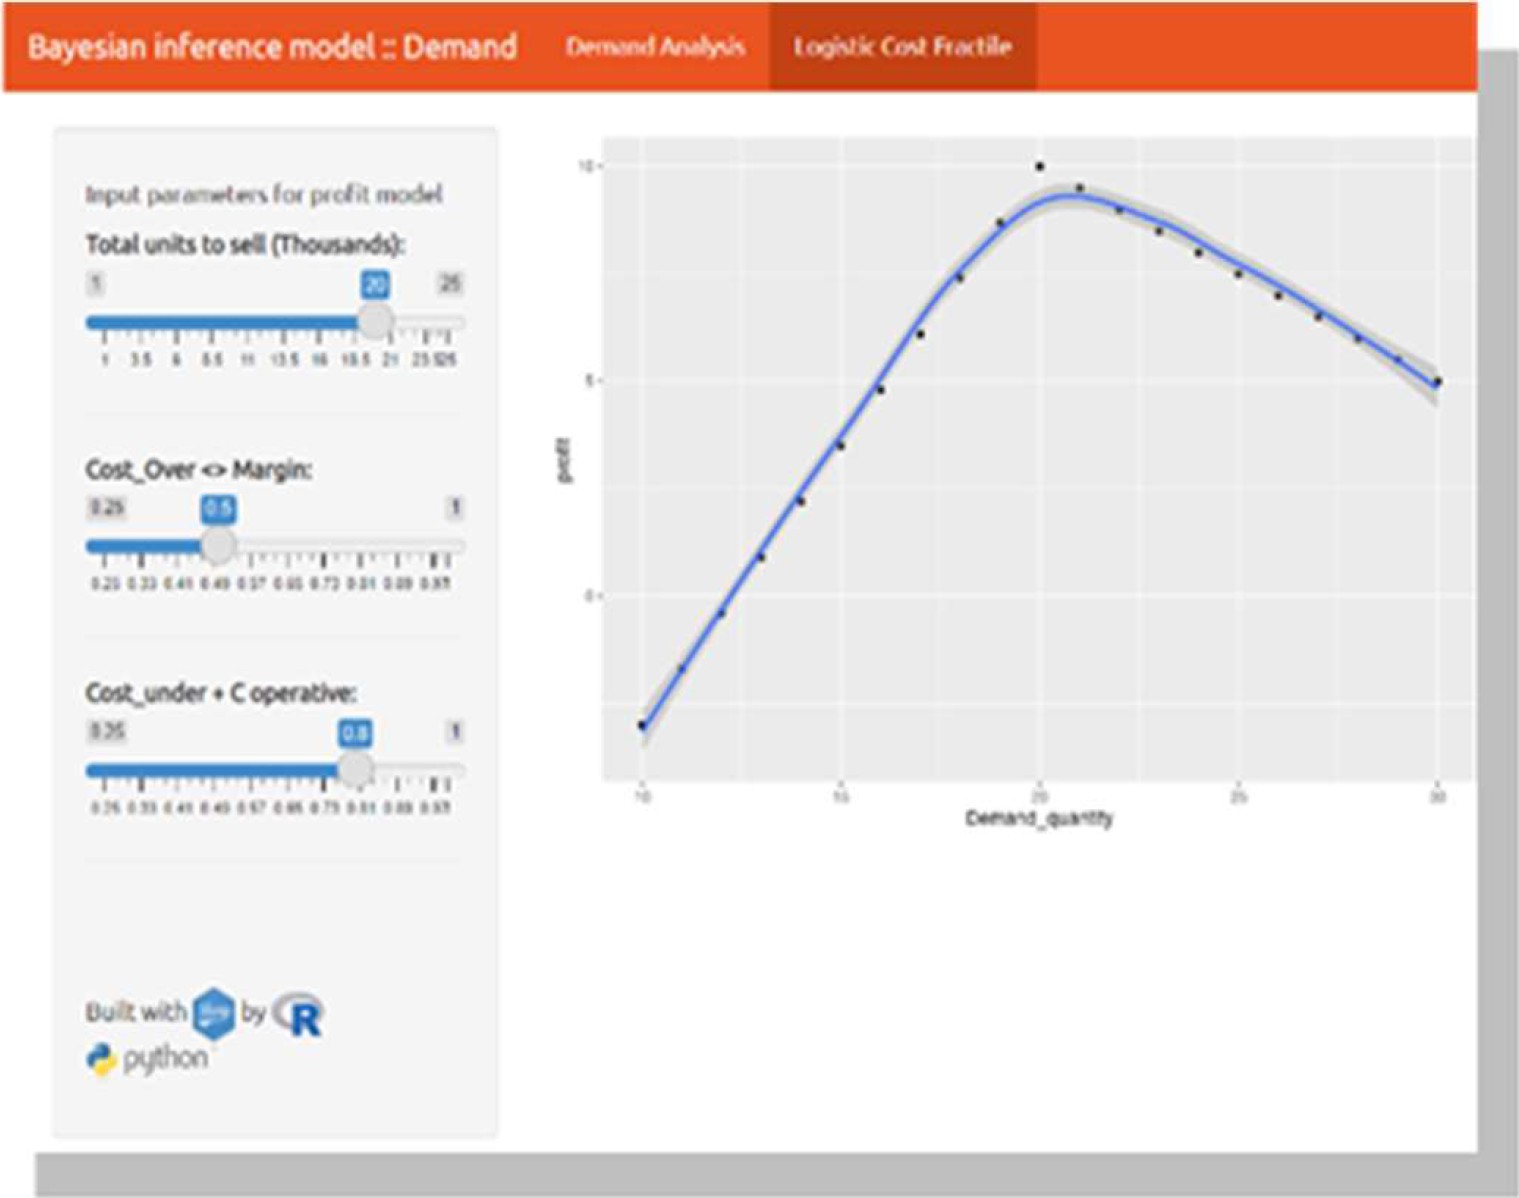
For the analysis of the behavior of the inverse function of the supply management cost, we will generate three project scenarios where the demand can be one, two or three times the average demand of the product obtained by the Bayesian sampler. With these three “period” values we can find a curve that relates the value of inventory management as a function of replenishment periodicity.
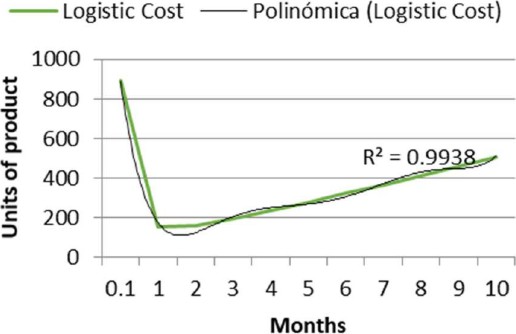
Using the inverse function C(p)=a/p+c*p+b where parameters a, b and c are solved with the equations generated at each replenishment time:
To obtain the minimum cost we derive the function C(p)=a/p+c*p+b and obtain:
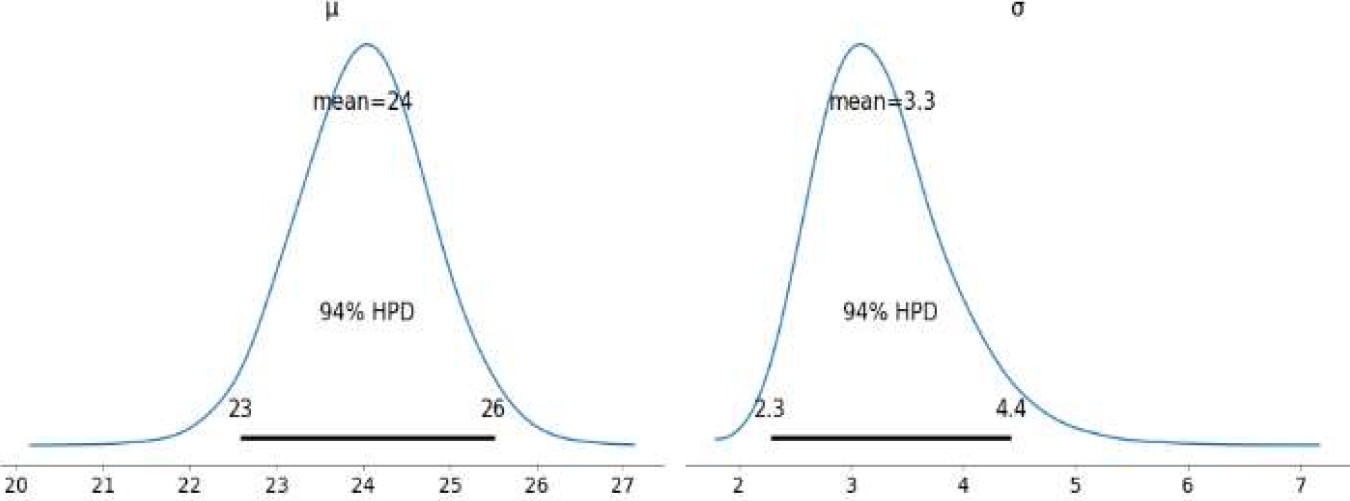
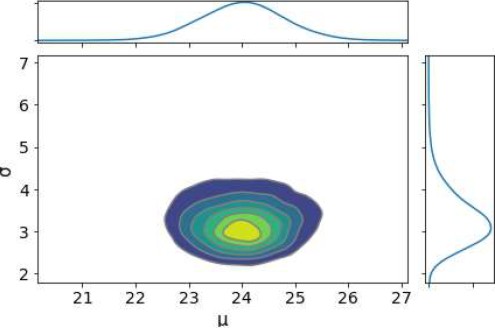
We consider that the mean value of the future demand is the result of a Gaussian process (GP) and considered as a prior probability distribution which works in a continuous space of random functions.
To obtain this independent variable (the mean of the future demand estimate), a NUTS (Not U Turn Sampler) was used, which describes how data sequences are generated in a random space. NUTS is a Hamiltonian Monte Carlo method.
This algorithm avoids the random walk part, which is often considered slow to converge. Instead of doing a random walk, NUTS performs jumps of length x. Each hop is duplicated as the algorithm continues to run. This happens until the path reaches a point where it is equivalent to repeat the sequence from the starting point
The determination of the estimated future average demand generates an appropriate replenishment periodicity which in turn generates an inventory coverage level. The coverage level is obtained by calculating the total inventory for the products at that periodicity. It can be interpreted as the required quantity of product until the next replenishment
3.2 Discrepancy
It is the ratio according to the parameters obtained with the information of the system and serves to generate the random function that establishes the risk obtained with different levels of value of the future estimate.
In any supply process, consensus is required in view of the uncertainty of future scenarios, which is why the contribution of the Bayesian approach can also be found in the probability functions obtained with the validations of experts in the organization (usually considered as demand managers).
4. Results and Discussion
The design used with pre-test and post-test and control group was applied with experimental groups 1 and 2. Both categories were of the functional type and include gourmet products as well as other more special categories. The experimental groups are compared in the pre-test to evaluate their equivalence and in the post-test to evaluate if there is an effect that differentiates the control group, to which a Bayesian approach was applied. In the post-test, the difference between the experimental groups is measured. To test the specific hypotheses, scenario comparison tests with confidence intervals were applied to establish by means of a paired t-test whether the values of both scenarios reject the null hypothesis expressed as:
Ho: The mean of the parameters of both scenarios are similar.
Ha: The mean of the parameters of the two are different.
4.1 Testing the General Hypothesis
With the operationalization of the variables, it is possible to measure the impact of the Bayesian approach in the demand management of a supply chain of dynamic products because the a priori information of any commercial process is enriched with the progress of the estimation periods, gathering in a quantitative way the contribution of the quality of the information in the analysis of differences.
In the comparison of the pretest between the two experimental groups, the following can be observed. The p-value (0.003) of the significance level indicates that the decision is to reject the null hypothesis because there is a difference between the experimental groups. An application developed with the described logic can be seen in the following figures.
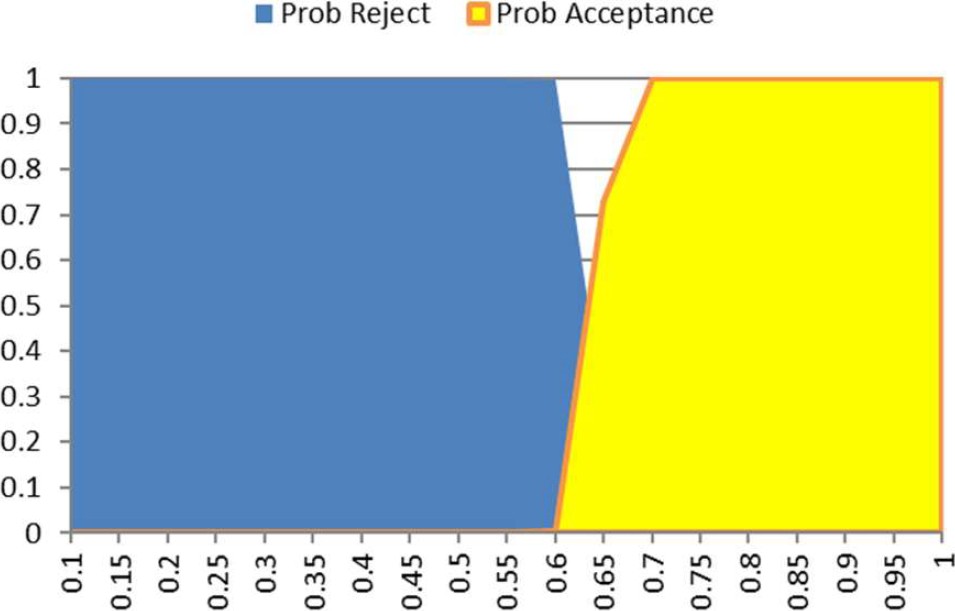
Scenario A (figure 5) of over estimation for a quantity of 2500 units, a probability of error of 30% and difference between expert consensus of 1600 units: In this case, the value placed as the future estimate is rejected because the probability of error being low, should not be such a wide difference between panel and calculation.
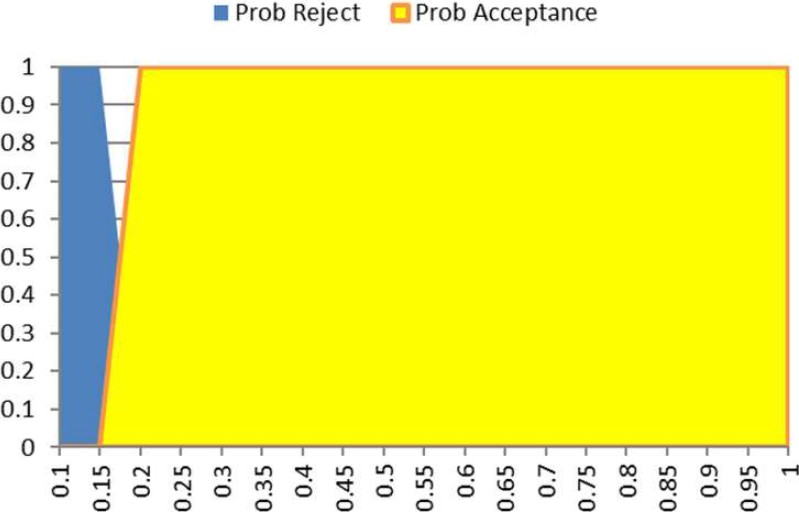
Estimation scenario B (figure 6) for a quantity of 6000 units with a probability of error of 40% and a difference between expert consensus of 1000 units. In this case the acceptance of the scenario tends to consider that in the 40% probability of error there is sufficient margin to consider that the calculation of the estimated future value has support.
Table 3 Estimation of the paired difference
| Mean | St. Desv. | Standard error of the mean | 95% CI for the difference _µ |
| 0.0941 | 0.0752 | 0.0238 | (0.0403; 0.1479) |
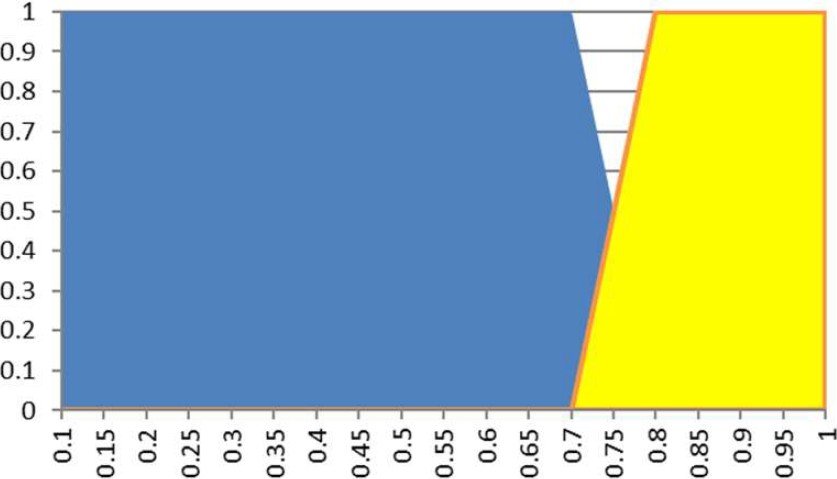
For a third estimation scenario C (figure 7) again of 6000 units and a probability of error of 40% with a difference between experts of 4500 units: The difference with the probability of acceptance is very clear, so the logic is interpreted as an error in the recording of the estimated future value, making it very noticeable the need to review the reason for this difference.
The results reported in [16], show MAPE values in a range of 17 to 20%, reducing this value after applying a tabu search algorithm, to 13%. In agreement with those obtained in our proposed Bayesian forecasting method with values between 10 - 20% in MAPE which makes the described method robust.
On the other hand, the reorder period indicator of 1.2 months obtained with our method does not reach the value obtained in [17], where a value of 0.5 periods is obtained.
This reason is due to the number of categories that the authors analyze and as they mention with a very intense mass consumption turnover.
In the Bayesian sampler of the present work, it was established in a value of 5% to 10% and the difference between the real and posterior value is justified by the size of the lots with which they work.
The values obtained in the Bayesian method are more in agreement with those reported in the case study with the Poisson distribution [18].
The study found that with the critical fraction technique, the coverage points for the products analyzed is 1.2 periods in inventory. The various inventory levels with a higher periodicity increase the costs of supply management.
5. Conclusion
Incremental improvement in demand management improvement of dynamic products could be obtained using the 10% Bayesian approach for the sampled products.
In relation to the objective of measuring the impact on the expected consumption, the value in the demand management of a supply chain of dynamic products such as classic sauces studied in the present work can be obtained by the behavior of the improvement in the accuracy metric that has an average in the period of the study between 70 and 80% and reduced the difference between the values of the measurement on the actual future and on the estimated future to a value of five percentage points, compared to the category of products that did not receive the effect of the Bayesian approach and presented an average accuracy between 55 and 60%.
In relation to the specific objective of determining the impact on the reorder period, the periodicity of inventory coverage was reduced by 15% for the control group products because of the Bayesian technique, which allows having an ideal level of inventories without affecting the demand, which is equivalent to reducing the inventory without exposing it to depletion.
Finally, regarding measuring the impact of this approach on the discrepancy, it was established that the use of the tools presented in this work improved the quality of the estimate by having discrepancies of less than 5% in the consensus between operations and the commercial área.

