


 nueva página del texto (beta)
 Inglés (pdf)
 Artículo en XML
 Referencias del artículo
 Enviar artículo por email
 Citado por SciELO
  Similares en
SciELO
Similares en
SciELO 
 Permalink
1 Introduction
Recently, fuzzy logic has been used in fields such as modeling, control, clustering, and classification, obtaining successful results that have shown its feasibility [22]. However, fuzzy classification has not been widely explored, even though fuzzy associative classifiers (FAC) have proven to be effective in different applications [20]. One of the main reasons for this is that the learning process of these systems becomes a complex task to solve since the number of rules to generate and the number of parameters to estimate grow exponentially [19].
Additionally, the curse of dimensionality on fuzzy systems negatively impacts the processing times needed to infer an output [22].
For this reason, several works have proposed solutions that allow reducing the exponential generation of rules.
One of the commonly used methods is the Wang-Mendel algorithm [23], which generates data-based fuzzy rules and has been widely used due to its simplicity, in addition to having a good performance [6].
Other approaches generate rules from the combination of all fuzzy sets and subsequently the rules that are considered redundant are eliminated; later, a similarity analysis is applied in which the most similar fuzzy sets are merged to produce new sets [14, 17]. Other methods have been proposed to reduce the complexity of fuzzy classifiers.
Two approaches are contrasted in this paper: those that use decision tree learning, e.g., the FURIA algorithm [10] that uses the RIPPER algorithm to exploit rules or the method proposed for Zaman et al. [25]; and those that use evolutionary techniques, e.g., FARC-HD [2], ADABOOST [3], ILGA [9], and HGBML [11].
More recently, other heuristic solutions [8] have been proposed to reduce fuzzy rules using techniques such as the Quine McCluskey method.
From the point of view of unsupervised learning, the use of clustering methods have helped to obtain the underlying structure of data to build classifiers [15].
However, there is no analysis in the literature that determines the performance of clustering methods as structure identifiers in an evolutionary parameter identification environment.
In this context, this paper presents a comparative analysis between different clustering algorithms to select the most suitable algorithm for carrying out the structure identification for a low-accurate fuzzy classifier.
To achieve this, a search for the most appropriate number of clusters for each clustering method is carried out and, based on the obtained low-accurate classifier, the differential evolution algorithm is applied to obtain the optimal high-accurate fuzzy classifier for each data set.
Results suggest that the rule selection should not be such an exhaustive process, but rather a process guided by the premise that the number of rules should not be too large, for example, starting the search from the number of available classes in a data set.
2 Methods
The following paragraphs briefly describes the methods used in the integration of our proposal presented in Section 3, such as some clustering algorithms as well as the differential evolution algorithm.
Two well-known clustering categories are the hierarchical and partitional algorithms. The main difference between them is that the hierarchical methods produce nested series of partitions similar to a dendrogram, while the partitional methods produce only a partition scheme [13].
The clustering algorithms presented here have been selected taking into account that users can request a certain number of clusters, which is important for obtaining a simplified structure.
In addition, this paper exploits a shared feature of partitional clustering with fuzzy partitioning through the scatter partitioning method.
This partitioning allows our proposal to split the feature space into a reduced number of intervals and therefore create few regions formed by the intersection.
Below are some of the main clustering algorithms known in the literature that are used in this paper.
2.1 K-means
Among the partitional algorithms we find K-means (KMM) algorithm, which is one of the most used clustering algorithms. It groups data points into a predefined number of clusters based on data set features.
The clustering is performed by minimizing the sum of distances between each sample and the centroid of each cluster [1]. Its procedure is as follows:
2.2 Bisecting K-means
A derived version of K-means is the Bisecting K-means (BKM) algorithm, which is a hierarchical clustering algorithm that employs a partitional approach, so users must specify how many clusters they want to divide data set into.
First, each sample starts out belonging to a cluster. Later, each feature is split recursively, as long as the algorithm moves down the hierarchy [1]. Its procedure is the following:
2.3 Gaussian Mixture Model
On the other hand, the Gaussian Mixture Model algorithm (GMM) is a probabilistic model in which samples are considered to follow a probabilistic distribution.
Then, the entire data set is formed by the combination of multiple normal distributions (Gaussian components) [24].
It can be seen as a generalization of the K-Means algorithm with which, instead of assigning each sample to a single cluster, a probability distribution of belonging to each one is obtained.
In order to estimate the GMM parameters with a given number of
– Expectation: given the current parameter estimation, compute the expected similarity value for each sample in order to assign it to a GMM component.
– Maximization: given the expected similarity values of the above step, update the parameters to maximize the similarity of all data samples, giving them values that maximize the probability that the data will have the expected labels.
2.4 Agglomerative Clustering
The Agglomerative clustering algorithm (AGG) is considered as a hierarchical clustering algorithm, which starts with the construction of a single tree at the top of the hierarchy that is considered as a single cluster called a singleton.
At each step, this procedure consists of creating a new cluster by merging the two closest clusters [18].
In order to achieve this, the following procedure should be executed:
– Set the number of desired clusters.
– Compute the similarity between pairs of clusters in the data set.
– Compute the link function for the closest clusters in the entire dendrogram using the information generated in the previous step.
– Split the dendrogram to form the desired clusters from data set.
2.5 Fuzzy C-Means
The Fuzzy C-means algorithm was reported and developed by Bezdek and Dunn in [5, 7].
This is inspired by the C-Means algorithm, in which a membership function is used to characterize each cluster [4] so that each sample can be partially assigned to multiple clusters [12].
Assuming that each cluster can be modeled with a fuzzy set, the algorithm starts with a
This implies that each element
The steps to follow are similar to the K-Means algorithm and are as follows:
2.6 Differential Evolution
The Differential Evolution (DE) algorithm [21] represents a heuristic approach used in global optimization problems. It starts by randomly generating a population of potential solutions.
It represents a very simple optimization algorithm based on three main operations: mutation, crossover, and selection.
It provides better convergence capabilities than other optimization algorithms and requires few hyper-parameters for its operation.
DE is a parallel direct search method which utilizes
The steps by which the DE algorithm performs the optimization are described below.
2.6.1 Mutation
For the mutation operation, an individual from the population is taken as the target vector. By means of three randomly-chosen individuals, a mutated vector
where
2.6.2 Crossover
The crossover operation allows for the generation of a trial vector
where
where
3 Methodology
This paper proposes a methodology that is comprised of two stages: the former is a structure identification stage that is performed with a clustering algorithm and the latter is a parameter identification stage that is performed with the DE algorithm.
With the structure identification stage, fuzzy set distributions and a simplified rule set can be obtained.
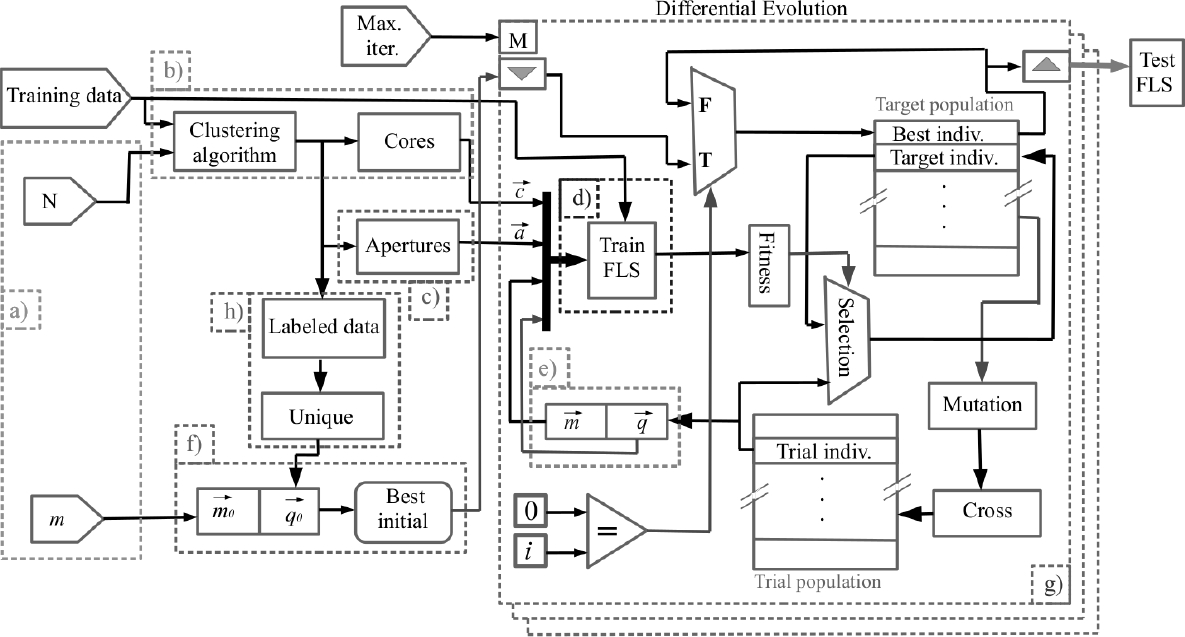
Subsequently with a DE parameter identification, a refined data-based model can be obtained as it is illustrated in Figure 1.
Using the generalized bell membership function parameters, fuzzy systems characterization can be effectivelly performed, which requires the following parameters: the center (
The following methodology allows for the selection of an appropriate clustering method according to the analyzed data set that maximizes classification accuracy.
3.1 Structure Identification Stage
Structure identification is a fundamental step for fuzzy classifiers. In this proposal, a clustering technique is used to find the structure of an initial low-accurate classifier.
The labeling of samples is the main function of clustering since it allows knowing a priori, not only the possible class to which a sample belongs, but also allows knowing the data distribution in the feature space. For this purpose, the following methodology is proposed:
– Set the number of desired clusters and the initial slope value to be assigned to all fuzzy sets (see Figure 1(a)).
– Calculate the centers of the clusters in all dimensions by using a clustering method, as shown in Figure 1(b).
– Calculate the data dispersion by estimating the standard deviation for each center obtained. These values represent the fuzzy set widths in Figure 1(c).
– Create a fuzzy rule for each cluster generated using the fuzzy intersection of the algebraic product so that for each rule there is a constant consequent (zero-order TSK fuzzy system), which is established by the value that the clustering method inferred for each sample, which can be seen in Figure 1(h).
This means that what is fed to the subsequent DE parameter identification stage to the blocks of Figure 1(f) are the labels obtained by the clustering method using the
These values are the ones that initially enter the low-accurate fuzzy classifier in Figure 1(d).
3.2 Parameter Identification Stage
Since the labels proposed by the clustering technique represent the consequent coefficients of some fuzzy rules of the low-accurate classifier, it will only be able to correctly infer those labels that match a target label.
However, not all of the labels proposed by the clustering technique will match a target label, so samples that did not match will eventually be misclassified.
For this purpose, a DE parameter identification stage is proposed, which starts from a low-accurate classifier and adjust it to obtain a high-accurate one.
As a consequence, the DE parameter identification affects only the following parameters: a) the fuzzy set slopes and b) the rule consequent coefficients.
The proposed chromosome model includes the slope values that are initially proposed by users and the consequent constants, generating an initial population where the best individual is this model, as shown in Figure 1(e,f).
The complementary methodology is as follows:
– Insert in the initial DE population the individual (low-accurate classifier) formed by the values obtained in steps 1-4 (of structure identification stage) in the first iteration.
Notice how in Figure 1(g) that the first individual in the DE algorithm is taken as the individual formed in Figure 1(f).
– Start the parameter identification by means of the DE optimization [21].
The block shown in Figure 1(g) represents the DE optimization for loop that repeats maxIter times.
Observe that, on the left side, the initial individual (low-accurate classifier) enters the loop and on the right side, the best individual (high-accurate classifier) exits when the loop is broken, which is used to create the fuzzy model that can make predictions with testing data.
4 Results
4.1 Experimental Configuration
In order to carry out the experimentation, the Scala version 2.12.10 programming language was used on the JDK version 8 platform, using the Ubuntu 18.04 operating system.
In addition, the computer used for the experiments is specified in Table 1.
Table 1 Computer specifications
| Item | Description |
| Model | Dell® Precision T7600 |
| Memory | 16 GB RDDR3 |
| Storage | 120 GB SSD |
| Processor | Intel® Xeon® E5-26 de 2.00GHz x12 |
On the other hand, the data sets used in this paper have been used in several related works in order to make the relevant comparisons.
They can be freely downloaded from the UCI Machine Learning repository [16] and some characteristics of them are described in Table 2.
Table 2 Data set description
| Data Set | Number of elements | Number of features | Number of classes |
| Cryotherapy | 90 | 6 | 2 |
| Iris | 150 | 4 | 3 |
| Wine | 178 | 13 | 3 |
| Breast cancer Wisconsin | 683 | 9 | 2 |
| Pima Indian Diabetes | 768 | 8 | 2 |
Once the materials to be used in the experiments have been described, several clustering methods are considered for this comparative analysis in order to build the low-accurate classifier, keeping in mind that the selection of the number of clusters is the key that allows users to propose a simplified and efficient structure.
The clustering methods used for experimentation were described in Section 2, namely: K-means, Bisecting K-means, Gaussian Mixture Model, Agglomerative clustering and Fuzzy C-means.
The proposed experiments involve the use of each clustering algorithm and the data set previously described, so that a search for the number of clusters is performed in the first stage of the proposed methodology to find which offers the best clustering-structured low-accurate fuzzy classifier.
In this case, experiments are carried out with consecutive values of the number of clusters
For evaluation purposes, the performance measure used in the second stage of the methodology is the classification accuracy, which helps to define the optimal individual that can be obtained by the DE algorithm.
Moreover, data sets have been split to validate the fuzzy model by means of a hold-out validation with 20% for testing and 80% for training for each experiment.
4.2 Results and Discussion
Since the objective of this paper is to discover the most suitable low-accurate classifier that allows simplifying the structure of the high-accurate classifier, it is of special interest to find the smallest set of rules that maximizes the classification performance for each data set.
After experimentation, the results are shown in Figures 2(a-e), which indicate the influence of the number of clusters while obtaining the low-accurate classifier. That is, the number of clusters allows us to obtain competitive classification accuracies after DE optimization according to the employed clustering method and a given data set.
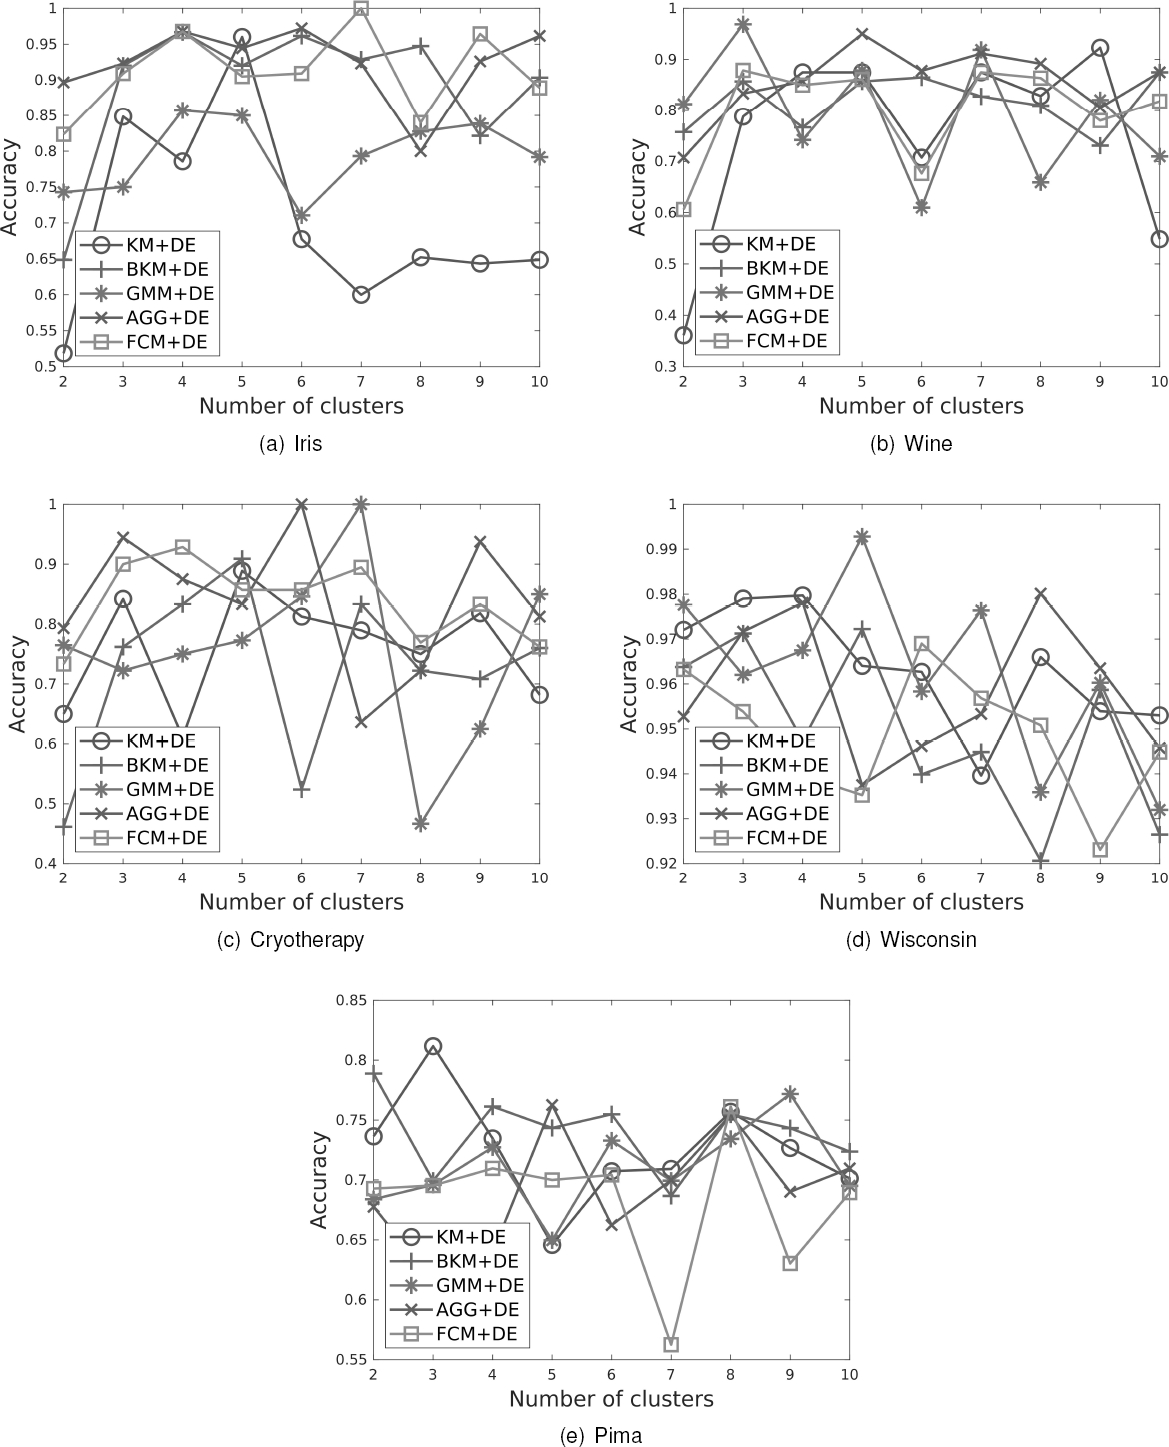
It is noticeable that outstanding accuracy values are obtained even when the number of clusters is low. This behavior is similar to that reported by the main rule reduction techniques found in the literature, in which the minimum number of rules found is quite low [2, 3, 9, 10, 11].
On the other hand, it should be noted that, when the number of clusters is less than the number of classes, e.g., for the Iris and Wine cases, high-accurate classifiers obtain very low performance.
This is mainly because the DE algorithm is unable to improve performance using the structure proposed by the clustering method (low-accurate classifier).
This behavior suggests that the search for the number of clusters should start from the number of existing classes in each data set.
Taking into consideration the maximum accuracy values of Figures 2(a-e), Table 3 can be built. Note that each data set is evaluated with each clustering method listed in each row.
Table 3 Performance comparison of maxima classification accuracy between the employed clustering methods and data sets. The best results are in bold
| Algorithm | Iris | Wine | Breast CancerWisconsin | Cryotherapy | Pima IndianDiabetes | |||||
| N | Acc | N | Acc | N | Acc | N | Acc | N | Acc | |
| KM + DE | 5 | 96.00% | 9 | 92.30% | 3 | 97.90% | 5 | 88.88% | 3 | 81.16% |
| BKM + DE | 4 | 96.66% | 6 | 86.48% | 5 | 97.22% | 5 | 90.90% | 2 | 78.88% |
| GMM + DE | 4 | 85.71% | 3 | 96.87% | 5 | 99.28% | 7 | 100.00% | 9 | 77.18% |
| AGG + DE | 6 | 97.22% | 5 | 95.00% | 8 | 98.01% | 6 | 100.00% | 5 | 76.25% |
| FCM + DE | 7 | 100.00% | 3 | 87.87% | 6 | 96.89% | 4 | 92.85% | 8 | 76.11% |
Observe that each column has two subheadings that correspond to the number of clusters N used and their corresponding accuracy Acc obtained after performing the DE optimization.
It can be observed in Table 3 that the GMM, AGG, and FCM algorithms obtained the best results in general. In particular the GMM results are better than the rest of the algorithms in three out of five data sets.
This is due to the fact that the Gaussian components generated with GMM resemble the membership functions used for each fuzzy set. This makes GMM a feasible algorithm to identify the structure of low-accurate fuzzy classifiers.
In addition, Figures 2(a-e) reveal that, some-times when using a smaller number of rules, very competitive percentages of classification accuracy can still be obtained. This situation opens the discussion on whether accuracy should be sacrificed for a smaller number of rules since an increase in rules also increases computational complexity.
In order to validate that results obtained by the high-accurate classifiers are competitive, Table 4 is presented, in which these results are compared against others rule-search-based methods such as FARC-HD [2], ADABOOST [3], ILGA [9], FURIA [10], and HGBML [11].
Table 4 Performance comparison between the employed clustering methods and other rule-search-based proposals in the literature
| Algorithm | Iris | Wine | Breast CancerWisconsin | Pima IndiansDiabetes | ||||
| N | Acc | N | Acc | N | Acc | N | Acc | |
| FARC-HD | 4.0 | 96.00% | 8.7 | 94.35% | – | – | 22.7 | 75.66% |
| ADABOOST | 9.8 | 95.33% | 16.5 | 95.99% | 12.92 | 96.64% | 23.56 | 76.78% |
| ILGA | 30 | 90.00% | 30 | 88.57% | 30 | 90.49% | 30 | 72.93% |
| FURIA | 4.4 | 94.76% | 6.2 | 93.25% | 12.2 | 95.68% | 8.5 | 74.71% |
| HGBML | 20 | 94.4% | 20 | 94.89% | 20 | 96.68 | 20 | 75.83% |
| GMM + DE | 4 | 85.71% | 3 | 96.87 % | 5 | 99.28 % | 9 | 77.18% |
| AGG + DE | 6 | 97.22% | 5 | 95.00% | 8 | 98.01% | 5 | 76.25% |
| FCM + DE | 7 | 100% | 3 | 87.87% | 6 | 96.89% | 8 | 76.11% |
| KM + DE | 5 | 96.00% | 9 | 92.30% | 5 | 88.88% | 3 | 81.16% |
| BKM + DE | 4 | 96.15% | 6 | 86.48% | 5 | 97.22% | 2 | 78.88% |
This comparison shows that the obtained classification accuracy of our proposed methodology is competitive and even higher than the results of the related literature reported in Table 4.
Regarding the number of rules, the use of clustering methods to obtain the low-accurate fuzzy classifier and as a consequence the high-accurate classifier is also competitive since they obtain even smaller rule sets than those compared in Table 4.
The fact that the GMM components are suitable for obtaining the low-accurate fuzzy classifier does not mean that the rest the of algorithms obtain a bad performance.
In fact, looking at the results, it is clear to see that most of clustering algorithms in conjunction with DE outperform the related techniques reported in Table 4. Finally, it should be noted that the use of a clustering method for fuzzy classifier structure identification helps to skip the arduous and complex search and rule reduction task characteristic of fuzzy classifiers.
On the other hand, we can also add the observation that the use of a metaheuristic such as DE is a necessary refinement step that allows achieving high-accurate classifiers with optimal performance at the cost of sacrificing processing time.
It is worth mentioning that the number of experiments performed was sufficient to determine the best clustering algorithm for this case study, based on two important points:
– The determination to search for the number of clusters
It is true that selecting a larger number of clusters could also lead to a high-accurate fuzzy model after parameter identification. Nevertheless, an extensive search could unnecessarily increase the computational complexity and decrease the interpretability of rules.
Therefore, performing the search in this interval ensures reduced fuzzy models depending on the data set used.
– Although in this paper a comparative analysis among five well-known partitional clustering algorithms is carried out, the proposed methodology allows evaluating any of the existing partitional algorithms and selecting the most appropriate number of clusters for each data set.
5 Conclusions
A comparative analysis between several clustering methods to identify the structure of low-accurate fuzzy classifiers was proposed in this paper, as an alternative to exhaustive rule search, where the low-accurate classifier is optimized subsequently by the DE algorithm in order to obtain an optimal high-accurate classifier.
The obtained results show that the clustering methods can help identify the fuzzy classifier structure, and therefore it is not necessary to conduct an exhaustive rule search.
Moreover, it is important to emphasize that the DE optimization carried out in the second stage is essential to ensure high-accurate fuzzy classifiers that can reach a competitive level.
Finally, two important aspects have been discovered in this analysis. First, the search for the number of clusters, regardless of the employed clustering algorithm, should start from the number of existing classes in each data set.
And secondly, although it has been observed that the GMM algorithm is the most suitable for most data sets, in reality any clustering algorithm that provides better quality cluster values based on data may lead to a low-accurate classifier that can be succesfully refined by any meta-heuristic to obtain a high-accurate classifier.
As future work, this paper should be extended to the area of hierarchical fuzzy classifiers from the point of view of distributed computing and using large-scale high-dimensional data sets, in such way that computational time can be reduced.

