


 nueva página del texto (beta)
 Inglés (pdf)
 Artículo en XML
 Referencias del artículo
 Enviar artículo por email
 Citado por SciELO
  Similares en
SciELO
Similares en
SciELO 
 Permalink
1 Introduction
For a number of years, governments, companies and individual scientists have been interested in tracking science and technology trends, which means the development of topics in science and technology that can signi cantly affect the socio economic sphere around the world.
Identifying and analyzing breakthrough themes is a time-consuming, expert-intensive process. Automated techniques have time limits, too much or too little data, inadequate validation and bias control, and time-consuming, human-intensive validation against real behavior.
Globalizing science and technology enhances the possibility of high-performance technical solutions in varied socio economic and geographical places. This area's sponsored research has come in waves. In the United States, the NSF program of the 1960s attempted to track important developments in the R&D process.
It should be noted that breakthrough research can be searched in the scientific literature or the media, Topic Detection and Tracking program (TDT) considered the task of searching in the media. Thus, the tasks can be broken down into three main steps:
(1) segmenting the stream of recognized speech into individual stories; (2) identifying those news stories that are the first to discuss a new event occurring in the news; and (3) giving a small number of news examples about the event, finding all subsequent articles in the feed [55].
In 2011, the IARPA Foresight and Understanding from Scientific Exposition (FUSE) program was funded to "develop automated methods that assist in the systematic, continuous, and comprehensive evaluation of technical developments".
The fundamental hypothesis of the FUSE program is that real processes of technological development leave visible traces in the public scientific and patent literature.
FUSE creates a system that can (1) handle a massive, multidisciplinary, growing, noisy, and multilingual body of scientific and patent literature; (2) automatically generate and prioritize technical terms in emerging technical fields and provide compelling evidence of emergence; (3) provide this capability for literature in English and Chinese.
The relevance of this study is signaled by the fact that the Competition Act of America was passed in 2021, which explicitly mentions the identification of new and innovative areas as a specific goal [3].
Today, there are conferences and societies dedicated to exploring new and breakthrough technologies. Despite this broad interest in the issue of breakthrough technologies - a Scopus search for "breakthrough technologies" yields over 13,000 articles - identifying emerging topics in science and technology remains a challenge.
A recent review of definitions and methods [11] reports that most studies of emerging technologies are retrospective analyses of predefined areas rather than methodological studies designed to identify new technologies. For example, [48] identified nanobiotechnology as a new and important area in nanotechnology and then used bibliometric methods to characterize the structure of topics in the field.
While characterizing recent work is important and helps current participants in the technology understand its history and landscape, these types of studies cannot identify currently emerging topics of interest to funders and practitioners around the world. Few studies offered methods for identifying emerging themes, and even fewer offered a list of emerging themes from the literature.
The main challenge in identifying emergent technologies is coming from the problem of definition of the word. It is important to understand the process which leads technology from being new or innovative to emergent. Moreover, there are no widely agreed definitions for emergent technologies and/or research.
2 Defining "Emergent Technologies"
First of all, it is necessary to define the concept of emergence and breakthrough research and technology. According to the Oxford Advanced American Dictionary, the term "emergent" means "starting to exist, grow, or become known".
The Cambridge Advanced Learner's Dictionary & Thesaurus interprets this definition as "to become known, especially as a result of examining something or asking questions about it" or "to become known or develop as a result of something". The authors' definitions in the scientific literature of emergent technology have evolved throughout time.
In 1985, Harris et al. [23] mentions that molten salt reactors are an emerging technology, indicating that they have significant promise [for waste disposal]. In 2000, P.J. Cullen, in his paper about the food industry and food processing [12] has defined the term as "technology, which has potential [within the food industry]".
In the same year, Waksman, in his study [53] in the medical field, states that "The ultimate test for any emerging technology to become a standard [of care depends on the outcome of the clinical trials."
In his study of Emerging Technology for Detection of DNA Binding Proteins, Dummitt et al. (2006) state that such a technology "attempts to overcome [such] limitations" [13].
In 2011 study [40] of dienamine catalysis author defines his emergent technology in organic synthesis as "a powerful technology can address these critical issues." However, there are a number of complementary opinions, namely:
Ben Martin in his study of science and technology in 1995 [37] characterizes emerging technologies as "promising research" that has the potential to yield the highest advantages.
Mick P. Couper, in his study [9] of technology trends in 2005, explores current technological advancements in survey research and associates the term with technologies that "offer many opportunities to expand the way we think [of survey data collection]."
Emergent technologies are significant advancements in technology, such as quantum computing, artificial intelligence, robots, and additive manufacturing, that generate new competitive risks and commercial opportunities in the near and long term.
The author [21] defines emergent technologies through a set of qualities that they must possess, namely, radical novelty, coherence, correlation, completeness, global or macro scale, dynamism, recognition. Cozzens et al. [10] described emergent technologies using terms such as rapid growth, novelty, untapped market potential, and high technology base.
Another author [41] defined emergent technologies using the following key attributes: Radical novelty: the technology is significantly different from previously used methods in the field; it has grown in popularity relatively quickly to a certain extent; it has demonstrated consistency in its application and use; it has the potential to be influential but is still uncertain in its applicability.
Based on the above discussion, we have summarized the data in Table 1. We tend to introduce our own definition. The resason behind that is disunity in the definition of this term in the scientific community, as shown above.
Table 1 Usage of "emergent technology" definition are cited
| Year | Author | Author's definition |
Intersection with our definition |
| 1995 | Ben Martin [37] | "promising research" that has the potential to yield the highest advantages | Influence potential |
| 1999 | Goldstein [21] | set of qualities that they must possess, namely, radical novelty, coherence, correlation, completeness, global or macro scale, dynamism, recognition | Radical novelty, consistency |
| 2005 | Mick P. Couper [9] | offer many opportunities to expand the way we think [of survey data collection] | Influence potential |
| 2010 | Cozzens [10] | rapid growth, novelty, untapped market potential, and high technology base | Radical novelty, relatively fast growth |
| 2015 | Rotolo [41] | relatively fast growth, radical novelty, consistency, influence potential, uncertainty in applicability | Radical novelty, relatively fast growth |
An emergent technology is a novel technology that is fundamentally different, has a reasonably rapid growth rate, endures over time, and has a major impact on socioeconomic sectors in both local and global markets. An emergent technology is a technology, which has following characteristics:
2.1 Difference between Emergent, Disruptive and Bleeding Edge Technologies
There are numerous definitions of new and promising technologies used in the scientific and popular science communities, and our goal in this section is to distinguish them from the definition of emergent technology, as well as to identify similarities and areas in which they are used to aid in a better understanding of the concept that lies beneath its definition.
Disruptive technology is a word that is frequently used in conjunction with developing technology. According to Lingfei Wu et al., disruptive technology is frequently found or produced by small teams of scientists, and this process entails risks that they typically incur while pursuing new ideas and prospects that may succeed in the future.
The author proposed a novel statistic dubbed the "disruption index" in his study [56]. In his work, the author summarizes technology that has been tested and thus justified the risk taken by small teams; this means that, based on the technology life-cycle depicted in Figure 1, it has already passed the earlier stages of being emergent and bleeding edge technology, which were more susceptible to failure. That is not to say that his technology is without risk; nevertheless, by looking back on previously successful technologies, the author indicates that earlier steps yielded more risk.
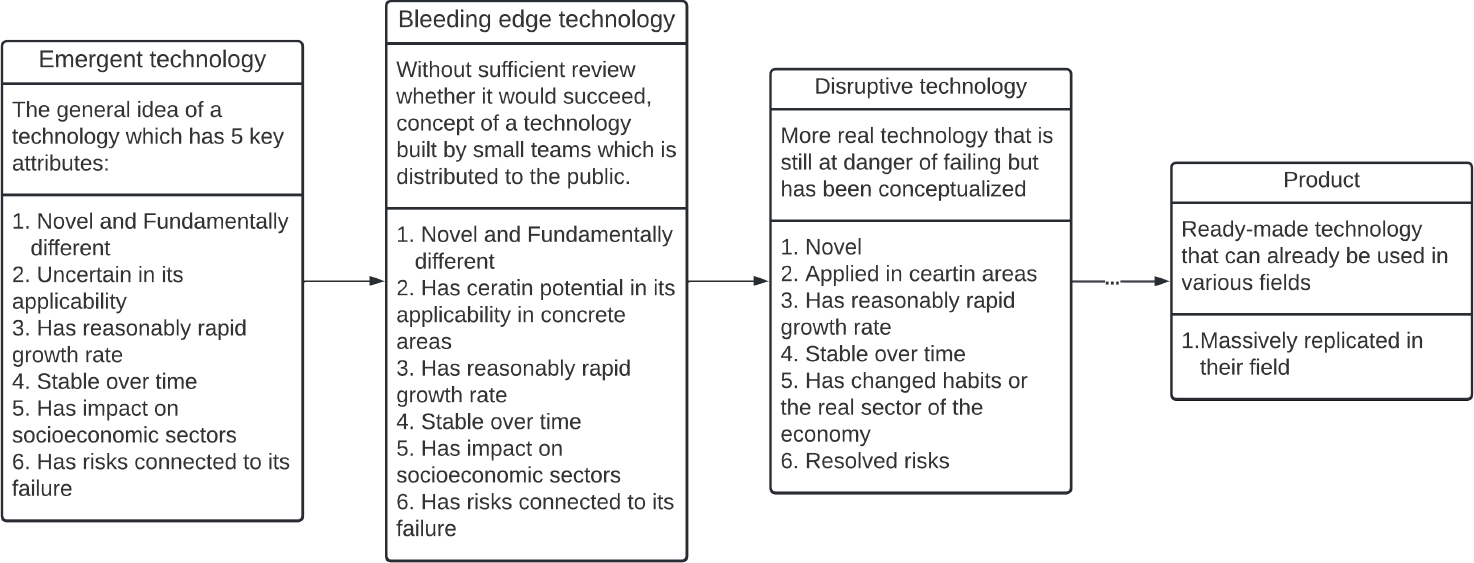
Additionally, the term "bleeding edge" technology refers to a form of technology that has been released to the public without having sufficient reliability evidence and may therefore be unpredictable. The risk and price associated with bleeding edge technologies are typically carried by the end user - in the majority of situations, the customer.
3 Analysis of the Research Interest Among Scientific Community
The growing interest in "emerging technology" research that has been indexed by the Web of Science database during the past two decades is seen in Figure 2. The most recent few years have shown very significant growth. The countries that have contributed the most to the body of knowledge about the concept of disruptive technologies are presented in Figure 3.
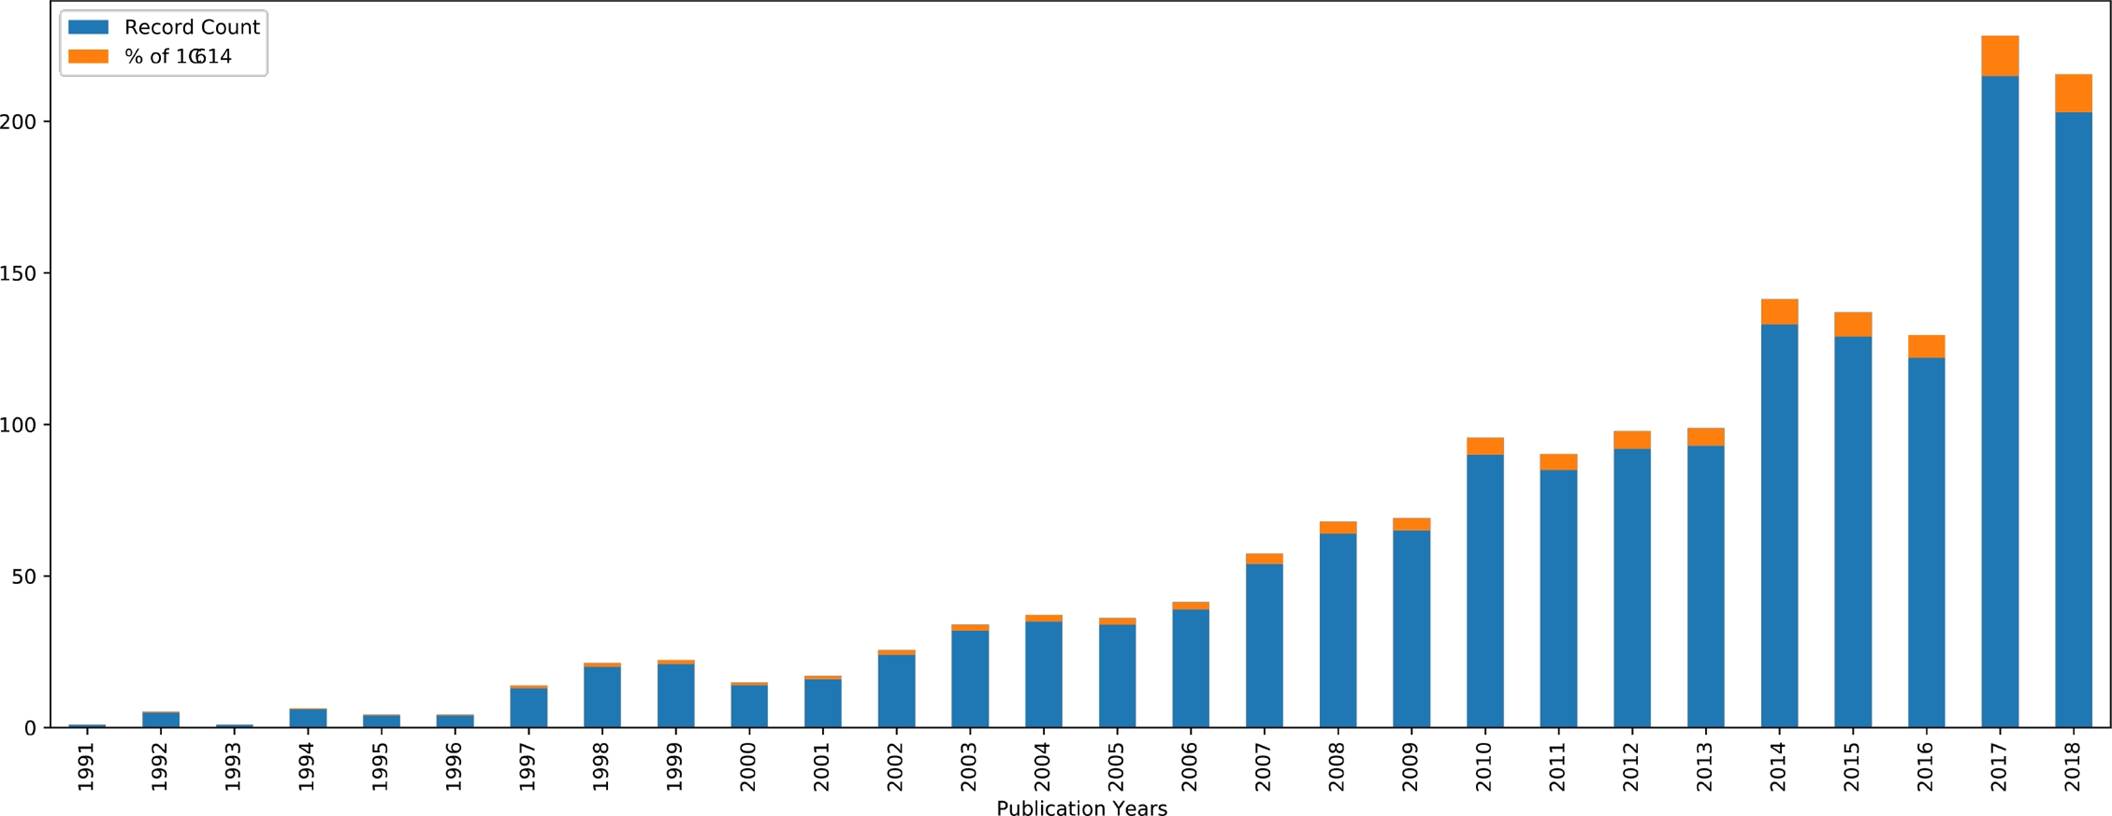
Fig. 2 Change in number of publications using the term "emergent technology" from 1991 to 2018 year according to Web Of Science
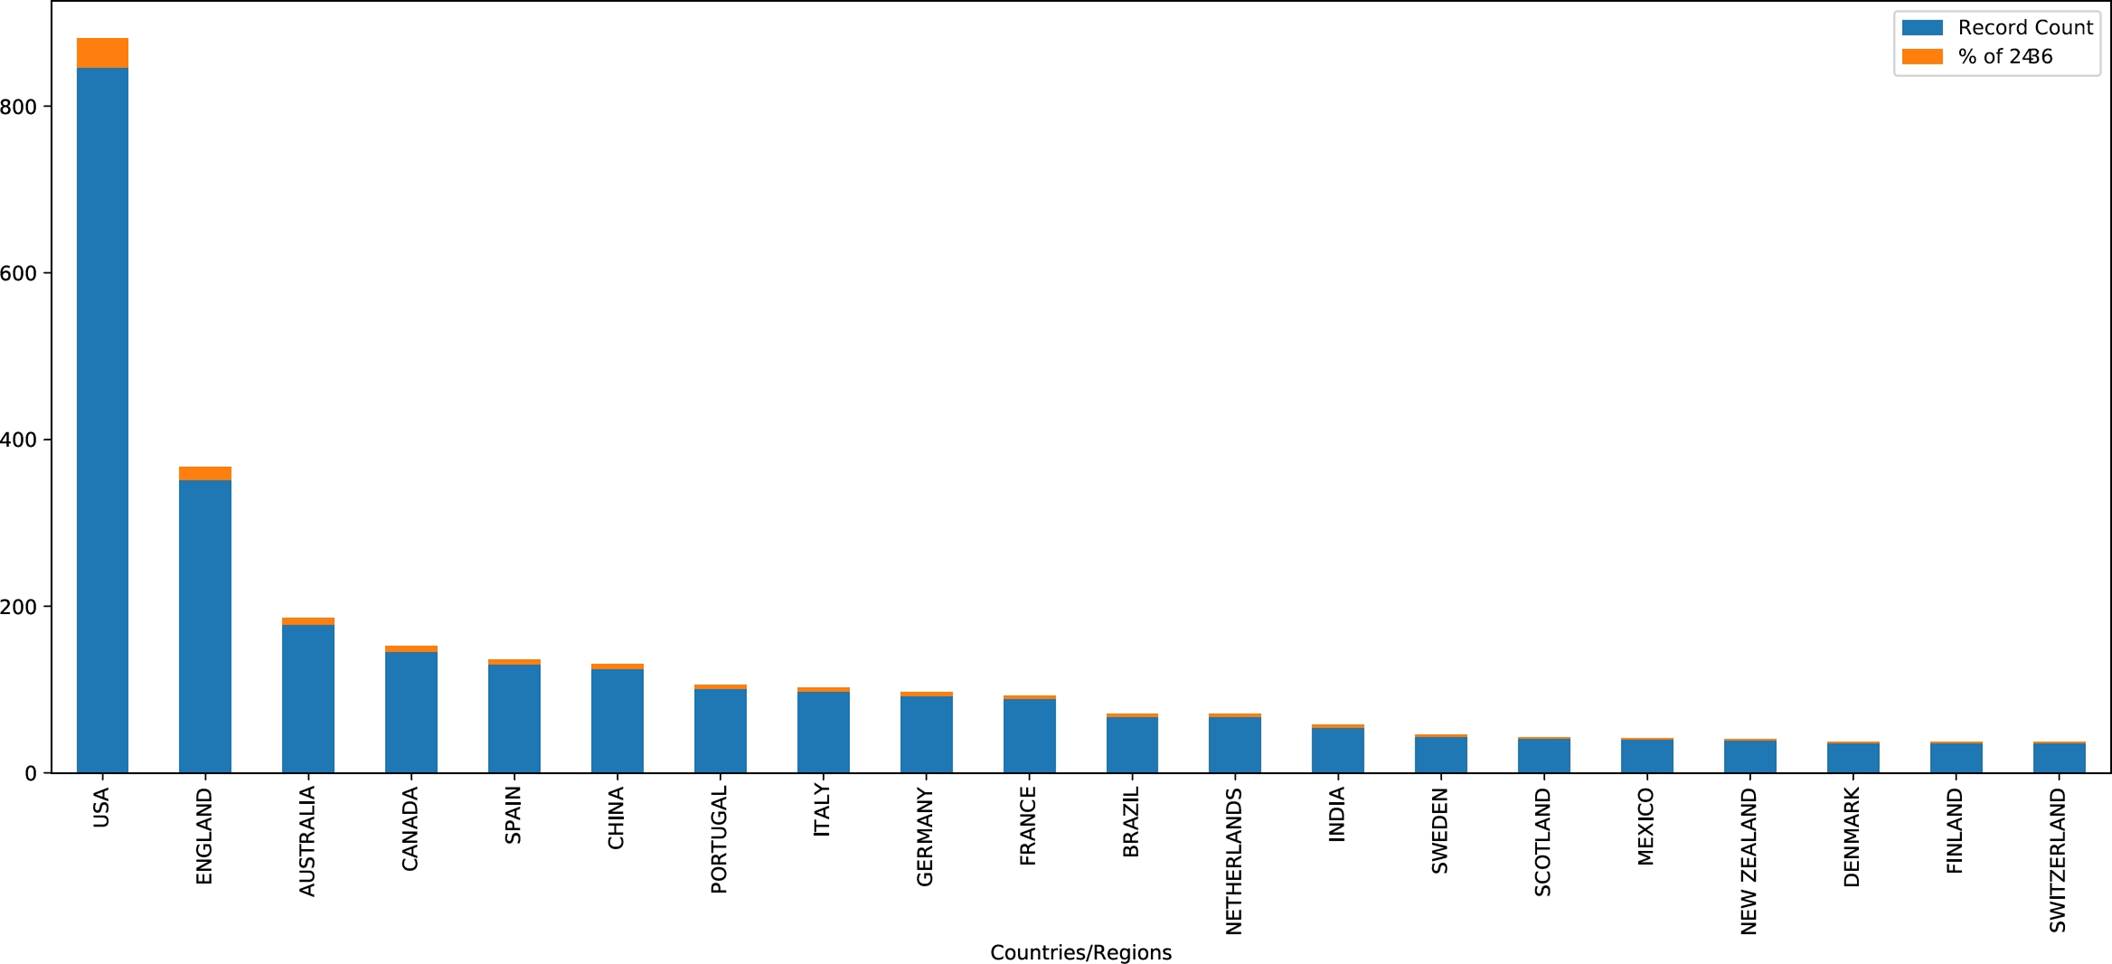
Fig. 3 Research interest among different countries on the topic of "emergent technology" as of 2018 year according to Web Of Science
The data from the Web of Science indicates that the majority of articles were written by writers based in the United States. We assume that it is possible to make a connection between the rise in interest in 1997 and the implementation of initiatives such as DARPA's TDT in the United States in the late 1990s if one considers the information presented in this article.
4 Overview of Emergent Technology Detection Approaches
The authors [46] proposed a method to identify emerging topics from a broad citation database. The authors applied the proposed method and identified more than 70 topics prior to 2014 as emerging topics. These topics are characterized in terms of their key source events and drivers, applications, and various indicators.
The paper presents evidence that these themes and their key researchers are unusual in many ways. Additionally, related papers are discussed, followed by descriptions of emerging technologies, emergent themes put forward and their characteristics, the evidence associated with these themes, and a discussion of results in the context of science policy.
The methodological issue regarding methods of finding and detecting breakthrough research is the idea of searching for these topics in publicly available digital libraries of scientific literature.
The mathematical apparatus of natural language processing arises naturally here and the main flagship idea underlying trend analysis for identifying breakthrough research is the rapidly increasing number of publications and scholars working on a particular topic, which is a necessary condition for search but not yet sufficient.
Additional conditions that are imposed on candidate topics are the requirements of coherence, partial independence from their "main topic" and other disciplines, and self-sustaining, i.e., the candidate topic should not just be a subsidiary entity supported by other research, but should be an independent field.
The question of when such a field is considered "re-emerging" is not only related to its "age" but also to the time when its literature has reached the critical mass necessary for it to exist and be widely recognized as an independent and self-sustaining entity.
4.1 Identifying the Emerging Research Areas
Various approaches have been proposed to identify emerging research areas [34, 47], their level of maturity [43, 54] and their dynamics [5, 27, 51]. The first, and perhaps the most difficult task, is to segment the areas of research activity in the global research and technology environment.
In the field of scientific research, approaches have been proposed by a number of authors [5,58]. On the other hand, in the direction of technological development, an alternative approach has been proposed [14].
There are different ways to automatically build a research activity classifier; the essential difference for any approach is only the input data. Such as grouping specialized journals, matching authors, analyzing thematic queries according to the terminology of the field, etc.
Moreover, most online services have developed their own classifiers to facilitate access to scientific information. Thus, a lot of work has been done on the surface structuring of scientific and technical activities, using a set of established keywords such as "low Earth orbit space systems", "remote sensing data", or highly cited "groundbreaking" articles to search based on terms or cited references. Sometimes all articles published in one or more journals are analyzed.
None of these approaches covers all the work published on a particular topic, but their results can be a reasonable indicator for analysis. It is worth noting that tracking the number of publications in a particular line of research involves taking into account the frequency of use of certain terms in that area of research.
However, textual similarity based on common terms is also associated with strong citation references. Thus, [26, 27] for example, analyzed the correlation between the distribution of terms and the distribution of citations in the citation graph and found that citation coherence correlated with the textual coherence of the term representing the topic.
The authors [45] tracked the evolution of clusters by selecting characteristic terms for each cluster and showed that similar topics are strongly related through cross-referencing, while articles on different topics are weakly related. They concluded that separating this subject into strongly related clusters is necessary to discover breakthrough research.
They also introduced two topological measures to determine the role of each article in the citation network, so that nodes with the same role are in similar topological positions. These measures were used to determine the presence of new clusters.
Another dynamic approach uses sub-classification of subject areas in the natural sciences, social sciences, and humanities, which can be performed based on text mining and textual similarities between documents; extracted terms can also be used in complex ways to label and describe the resulting clusters. [33].
One possibility to monitor the structural changes and evolution of the number of clusters is certainly the application of complementary methods. For example, the diachronic thematic communities approach is of significant interest in the present program, its main idea being to find communities (temporary research teams, VNCs) of people working on semantically related topics at the same time.
These communities are interesting because their analysis allows us to understand the pattern of dynamics in the global research world, i.e., the birth of new communities or the rebirth of old ones; the migration of researchers from one topic to another; the splitting, merging, and discontinuation of communities; and more.
To this end, we are interested in developing graph-dynamics methods that are able to properly handle the dynamic aspects of topic community formation, giving priority to the relationships between researchers who seem to follow the same research trajectories.
The present approach was formulated in [32] with multiple sources for mining research. In another paper [39], it was extended in the form of Temporal Semantic Topic-Based Clustering (TST), which uses a new metric to cluster researchers according to their research trajectories, defined as the distribution of semantic topics over time.
4.2 Lexical Approach
Another method consists of the lexical approach proposed in [16]. It has several limitations, namely the relatively low ability to differentiate research topics, leading to "overestimation" of relations between documents.
Furthermore, with it there is a dimensionality problem in the context of big data, but the most significant problem is related to the fact that aggregating information at different levels using thesauri and ontology at different time periods leads to different readings of results.
Based on all of the above, a hybrid approach based on different architectures and solutions seems promising. Indeed, a number of authors [8, 25, 49] have proposed a similar strategy of combinatorial methods in related problems.
The question arises how such combinations of text-based and reference-based components can be applied to diachronic analysis, if each of the components causes some problems in the application to long-term analysis.
The inconsistency in the application of both bibliographic linking and joint citation analysis over periods of, say, more than 10 years is due to the aging literature and the genealogy of citations is evident.
Moreover, the use of collaborative citation analysis in the context of new emerging topics is questionable, as it takes time before a "critical mass" of articles on a new research topic is reached, which is necessary to produce the highly cited publications needed for collaborative work citation-based clustering [24]. In turn, the use of bibliographic linkage for long-term analysis is mostly limited to the impact of citation genealogy.
4.3 Scientific Indicators
Another approach considers methods of using specific indicators to refine a new field of study. Science indicators have been used to study the emergence or growth of scientific fields, such as the price index, the immediacy index, and the currency index [1, 29]. In [15], they investigate the emergence of knowledge as a result of scientific discovery and its disruptive effect on the structure of scientific communication.
They apply network analysis to illustrate this emergence in terms of journals, words, and citations. The paper [35] investigates changes in journal citation patterns during the emergence of a new field. Paper [28] discovers new technologies through citation network analysis, finding that fuel cell and solar cell research are fast-growing fields.
In [42] proposed approaches based on historiography and field mobility to trace the impact of a specific article. In their study, the citation historiographer generated by the 1968 Merton article shows the emergence of a new field of science and technology research in the 1970s.
They demonstrate that there is an algorithmic determinism in the origin of the new research field based on the formalization of academic trajectories of scholars, which in turn are conceptualized as pragmatic modes of knowledge dissemination. Many researchers use quantitative models to study how ideas spread in academic communities and how academic fields evolve over time.
Goffman has conducted several studies [–20] to mathematically model the temporal development of scientific fields. In his work, he first formalizes the term Scientific Discovery (SD), the development of his idea is continued by Vityaev [52], in which knowledge is considered as a certain set of formal-logical statements with their corresponding probabilities.
Due to such a technique, the problems of ambiguity and ambiguity, as well as the problem of sharp divergence of truth estimates in the deductive-logical inference procedure are solved. Another interesting observation in Goffman's work is the assertion that there is a strong link between models of epidemic spread and the spread of knowledge in a particular field of research [20].
A development of the epidemiological approach has evolved in [4] analyzing the temporal evolution of new fields within several scientific disciplines by the number of authors and publications, using models of contagion developed in epidemiology. An alternative way to detect thematic trends is based on the idea of an algorithm from digital signal processing, namely the spike detection algorithm [31].
It uses a Markov automaton whose states correspond to the frequencies of individual words, and state transitions correspond to points in time around which the word frequency changes significantly.
Then, over a given set of time-stamped text, e.g., abstracts and years of article publication, the algorithm identifies those abstract words whose frequency increases dramatically, and outputs a list of these words along with the beginning and end of the sample period. The strength with which changes occur may indicate emergent properties, i.e., the potential for a study to be a breakthrough in its field. Ideas from digital signal processing have also found application in [36], in which a packet data algorithm was used to define breakthrough research terms with a high degree of time lag.
Its output can be used as indicators to identify future trends in the research field. The work [36] covers biomedical and other research from 1982 -2001. An interesting idea is to combine different indicators to identify spikes in temporal structures.
4.4 Data Availability for Detection Methods
The main requirement for the above-mentioned approaches is to require the existence of a central direction that links all possible variations and alternatives into a unified structure. A S&T (Science and Technology) document or a set of such documents may serve as such a central direction. S&T documents can be understood as technology patents or research publications.
In turn, various online services of digital libraries, patent agencies, specialized news portals, etc. can serve as data sources for all the above approaches. For example, since 1976, the United States Patent and Trademark Office (USPTO) has provided a full-text patent and search engine that can be used free of charge.
The USPTO services are used by R&D (Research and Development) policy makers, R&D managers, technology developers, and R&D planners and creators [2, 50, 57]. As a result, technology process agents can study trends, form R&D strategies in view of high competition.
Taking patents as a source of data can reduce the amount of information processed in the task of finding breakthrough technologies, but patents themselves represent a very large volume.
In 2012, more than 253,000 utility model patents were granted in the US system alone, bringing the total number of granted patents in the US to over eight million. It is worth noting that more than 75% of the information contained in patents is no longer being reused.
When looking for new technologies, most of these patents are of little interest, perhaps because they describe the gradual development of mature technologies or because they describe technologies with relatively low potential [6]. Another important source of data is online library services.
For example, Elsevier's Scopus is an open online database index that contains full-text materials and citation links for scientific publications. In addition, an important quality of this index is the fact that it only includes articles that have undergone double-blind review, which certainly has a positive impact on the quality of scientific material.
The name Scopus was taken from the Latin name of the Hammercope bird (Scopus umbretta), which has excellent navigation skills. The Scopus database was founded in 1966. The collection contains over 40,000 titles from approximately 11,678 international publishers, of which nearly 35,000 journals are peer-reviewed in top-level subject areas.
Scopus covers a variety of formats (books, journals, conference proceedings, and more). The fields of science covered by Scopus are technology, medicine, social sciences, arts, and humanities [22].
The purpose of this program is to obtain data on the fly to generate relevant analytics, but specially prepared datasets exist for solving applied research questions.
For example, BIGPATENT is a dataset consisting of 1.3 million US patent documents collected from publicly available Google Patents datasets using BigQuery. It contains patents filed after 1971 in nine different technology areas.
Compared to other datasets, BIGPATENT has the following properties: the summaries contain a richer discourse structure with more recurring entities; the terminology is evenly distributed in the input data; and the gold standard of this dataset has a large variety in text length [44].
5 Modern Perspective on the Discovery of Emergent Technologies Through the Use of Deep Learning Techniques
5.1 Dataset for Testing Emerging Technology Classifiers
The data used to generate the citation and co-authorship graphs came from Semantic Scholar's public API on the topic of astophysics. This dataset provides tables including abstract embeddings, author lists, paper ids, article titles, published year, number of citations and references, and fields of study.
Additionally, you can get citations per year for each paper and information about the authors such as their total paper count, h-indexes, and total number of citations. The data was acquired via this site's official API and assembled into a dataset, an example of which is provided in Table 2.
Table 2 Example of a data used from dataset
| index | text embedding | title | title embedding | year | 1-year | 2-year | 3-year | first author h index | first author paper count | first author citation count | sum h index | sum paper count | sum citation count |
| 1 | [-7.3826470375061035, -0.3564034700393677, 0.8... | Modules for Experiments in Stellar Astrophysic... | [-0.02009905, -0.022373319, 0.03170862, 0.0149... | [2013] | [45] | [121] | [216] | [27] | [51] | [8317] | [131] | [447] | [27096] |
| 2 | [-4.855892181396484, 1.4361735582351685, 2.138... | MODULES FOR EXPERIMENTS IN STELLAR ASTROPHYSIC... | [-0.020886937, 0.044551138, -0.0065947664, 0.0... | [2015] | [24] | [126] | [282] | [27] | [51] | [8317] | [117] | [443] | [29620] |
| 3 | [-5.774590015411377, -1.2082645893096924, 2.93... | Modules for Experiments in Stellar Astrophysic... | [-0.026900753, -0.035499975, 0.03234886, 0.029... | [2010] | [6] | [29] | [102] | [27] | [51] | [8317] | [190] | [813] | [58313] |
| ... | ... | ... | ... | ... | ... | ... | ... | ... | ... | ... | ... | ... | ... |
| 6348 | [-3.6669158935546875, -4.581037998199463, -1.9... | Spectr-W3 Online Database On Atomic Properties... | [-0.032371737, -0.030360237, -0.03526009, -0.0... | [2002] | [0] | [0] | [0] | [5] | [33] | [91] | [42] | [288] | [1933] |
| 6349 | [-3.8591768741607666, -2.6366443634033203, 1.3... | Performance of Magnetic Penetration Thermomete... | [-0.024682185, -0.046158567, 0.029100196, 0.03... | [2012] | [1] | [4] | [4] | [88] | [638] | [27971] | [227] | [1482] | [63066] |
| 6350 | [-1.6990535259246826, 0.5203409790992737, 2.11... | Wide Field X-ray Telescope: Mission Overview | [-0.022060653, -0.0299272, -0.04176955, 0.0037... | [2010] | [0] | [2] | [5] | [64] | [714] | [21367] | [160] | [1809] | [37241] |
The dataset initially had 10,000 records; however, after deleting empty and duplicated records, we received 6350 records, which were then separated into train and test subsets in a 4:1 ratio, yielding 5080 records in the test and 1270 records in the validation datasets.
5.2 Methodology
We tackled the topic via the lens of classification, namely binary classification. Articles having fewer than ten citations are classified as class 0, whereas those with more than ten citations are classified as class 1. Using the Semantic Scholar API, we obtain the article's full-text vector representation.
The term "full-text embedding" refers to the vector representation of the complete text of a scientific publication generated using the SPECTRE language model [7]. SPECTRE is a transformer-based language model for the production of document-level embeddings of scientific documents.
It is a pre-trained SciBert on a specific aim that modifies weights depending on the full-texts of publications and their citation relationships. To obtain the vector representation of the title, we utilize FastText's pre-trained model Common Crawl (600B tokens) with 2 million word vectors trained with subword information [38].
Our model is implemented in PyTorch. The model is a feed-forward neural network with five fully connected hidden layers; the signal is passed through the LearkyReLU function between the hidden levels. Figure 5 illustrates a more thorough construction.
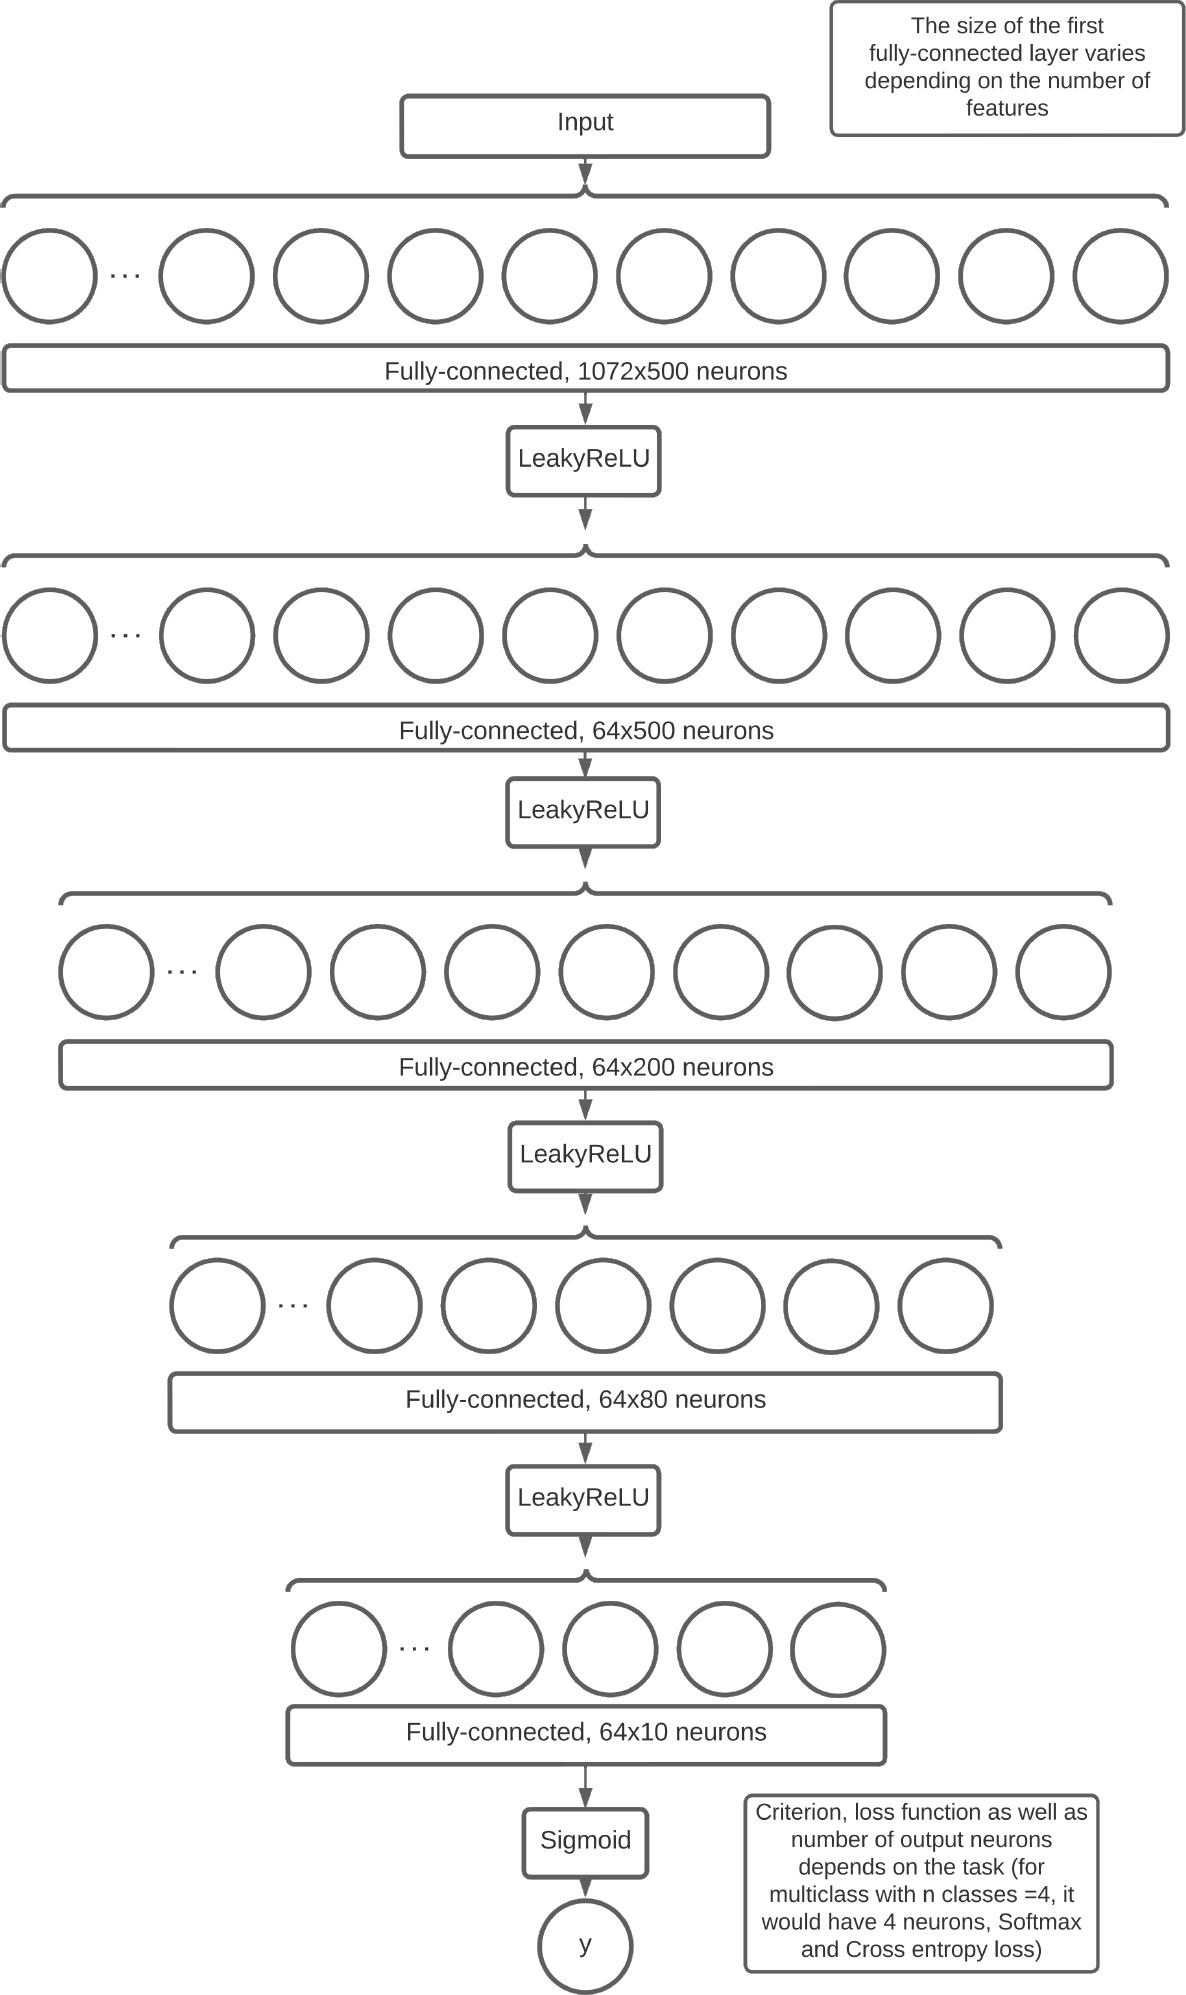
The model is fed a vector of length 1078 bytes, where the full-text embedding is 768 bytes, the title embedding is 300 bytes, and the other characteristics are integers. The full descriptions of all features are listed in Table 3.
Table 3 Features used in the experiment with their description
| Feature | Description | Example data |
| Paper Embedding | Embedding of a full-text using SPECTRE | [-7.3826470375061035, -0.3564034700393677, 0.8... |
| Title Embedding | Embedding of the paper's title using FastText [38] | [-0.02009905, -0.022373319, 0.03170862, 0.0149.. |
| Year of Publication | Year of the publication of the paper | 2013 |
| 1-year total citations | Total citation for a given paper for the one year after it was published | 45 |
| 2-year total citations | Total citation for a given paper for the two years after it was published | 121 |
| 3-year total citations | Total citation for a given paper for the three years after it was published | 216 |
| First author h-index | H-index of the first authors of a publication | 27 |
| First author paper count | Paper count of the first author of the publication | 51 |
| First author citation count | Citation count of the first author of the publication | 8317 |
| Sum of first three and last author's h-index | Total sum of h-indexes of the first three and the last author of the publication | 131 |
| Sum of first three and last author's paper count | Total sum of paper count of the first three and the last author of the publication | 447 |
| Sum of first three and last author's citation count | Total sum of citation count of the first three and the last author of the publication | 27096 |
At the output, there is a single neuron, after which sigmoid is applied and the result is regarded binary cross-entropy. We utilized the Adam optimizer [30] with a learning rate of 1e-4 and the ReduceLROnPlateau scheduler for training. We train our model on two RTX 2080Ti cards (11 GB each) for seven epochs with a batch size of 64 and no gradient accumulations.
To compare, we trained our model using both multi-class classification (class 0: n = 3, class 1: n = 8, class 2: n = 20, and class 3: n > 20) and Random Forest.
5.3 Results
Following a series of experiments employing a variety of approaches, the following results were obtained, as shown in Table 4. As shown in the table, both the neural network and decision trees perform better with a subset of features (full-text embedding, title embedding, year, 1-year, 2-year, and 3-year) than with all features; therefore, our hypothesis that author-specific metrics may improve prediction results was not supported.
Table 4 Results of classifiers with different feature inputs. For all models, the same experiments were carried out, the table shows only noteworthy examples. For multi-class classification we use 4 neurons on last layer and Cross-Entropy loss with Softmax
| Model | Features | F1 score | Task |
| Random forest | 3-year | 0.93 | binary |
| Random forest | 1-year, 2-year, 3-year | 0.92 | binary |
| Random forest | full-text embedding, title embedding, year, 1-year, 2-year, 3-year | 0.90 | binary |
| Random forest | all features | 0.89 | binary |
| Neural network | all features | 0.60 | binary |
| Neural network | full-text embedding, title embedding, year, 1-year, 2-year, 3-year | 0.88 | binary |
| Neural network | full-text embedding, title embedding, year, 1-year, 2-year, 3-year | 0.71 | multi-class |
We attribute this to the curse of dimensionality because the training set contains somewhat more than 5000 samples and the breadth of the model increases as a result of the usage of embeddings. Despite this, the decision trees performed well, particularly when compared to the neural network. However, studies with a different set of characteristics have revealed that the number of citations for 1, 2, and 3 years is the most disproportionately significant factor.
6 Conclusion and Future Work
It must be appealing to create models of automatic identification of ground-breaking research and technology for a variety of human endeavors; this is the focus of the present work.
The writers studied methodological aspects of research and technological progression; thus, it should be mentioned that from a technical standpoint, theoretical research is far from complete due to the wide diversity of projects, outstanding challenges, research questions, and market assumptions.
We believe it is conceivable to advocate the creation of distinct open data sets for each technological industry as the next step. In addition, we should observe the shift from statistical to intellectual scientometrics, as indicated by the abundance of works devoted to forecasting and predicting various research performance indicators.
Using the space sector as an example, the authors of this research also analyzed several machine learning algorithms for forecasting citation indices. The outcomes of recent numerical studies are positive. Searching for numerous extra input features to increase the quality of the prediction and shifting from classification to regression constitutes additional development.

