


 nueva página del texto (beta)
 Inglés (pdf)
 Artículo en XML
 Referencias del artículo
 Enviar artículo por email
 Citado por SciELO
  Similares en
SciELO
Similares en
SciELO 
 Permalink
1 Introduction
Automatic Music Transcription (AMT) consists of the challenging task in signal processing and artificial intelligence fields that seeks to emulate capability human to perceive the music. It comprises two main subtasks: Multiple Pitch Estimation (MPE) and Onset Detection.
AMT can be organized into four categories depending on the level of abstraction and the structures modeled frame level, note level, stream level, and notation level.
A frame-level transcription system estimates the number and pitch of notes that that coincide in the same frame.
This system does not consider the concept of musical notes or structures [1]. On the other hand, the way humans perceive music is related to their ability to identify signals coming from multiple separate sources.
A transcriber system performs a similar function by detecting notes from each individual source, classifying and grouping them into structures called dictionaries. To perform the above, in the state of the art we can find works that have developed and used machine learning algorithms; among them the nonnegative matrix factorization (NMF) method [2], able of decomposing an input spectrogram as a parts-based representation of sources or notes [3, 4].
Furthermore, cochlear models show the underlying physical processes involved in the auditory perception and have been used in audio applications [5].
In the literature, different methods have been developed for obtaining cochlear functions; in [6] a frequency-position function was found by critical bandwidths experiments while in [7] another function was obtained by an analysis of mechanical resonance. In this paper, we present a frame-level transcription system that estimates multi-pitch and onset time of piano notes by using NMF. Firstly, we developed a new cochlear function solving a biomechanical cochlea model and used it for designing auditory filter-banks.
Secondly, we applied NMF algorithm using filtered spectrograms as input and representation of the musical signal. Through the experiments, we show that the proposed system improves the estimation performance further over unmodified spectrograms. Finally, we show all results mentioned before.
2 Auditory Model Analysis
2.1 Cochlear Model and Function Solution
In order to obtain an accurate cochlear frequency-position function, we analyzed a mathematical model of cochlear biomechanics, which is divided into the macro-mechanics and micro-mechanics systems [8].
In the macro-mechanics system, cochlea represents a fluid-filled box, which is separated into upper and lower halves by a flexible partition, while in the micromechanical one it is modeled as a two degrees-of-freedom system, illustrated in figure 1.

The previous model was adapted, from representing a cat cochlea to representing a human cochlea [9]. Besides Perdigao [10] made an electrical-mechanical system equivalence, where the pressure for each point 𝑘 is defined as following:
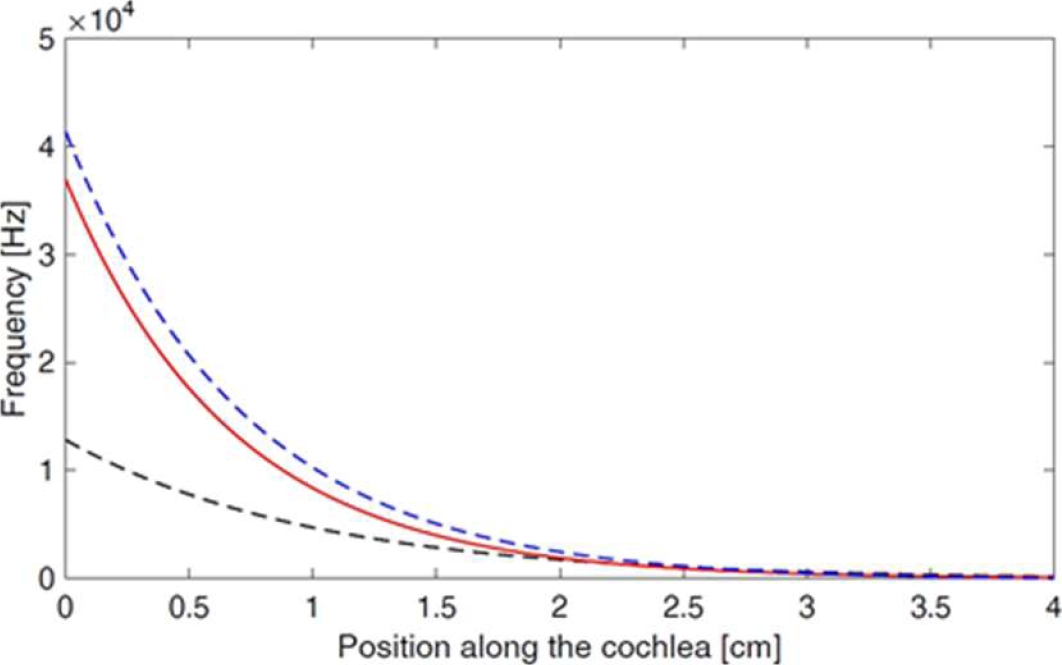
This allowed us to calculate the pressure in the basilar membrane for 0 < x < 4 with 251 points, where each stimulus frequency value corresponding to a x-value, obtaining the graph in figure 2.

Given the behavior of the curve in figure 2, we used a non-linear regression method that allows finding a function that approximates the curve data, considering the exponential function (2):
where
Then, the functions (3) and (4) were obtained:
Then, we compare these functions behavior with [6] and [7].
The graph obtained from the function (3) is shown in figure 3.
2.2 Auditory Filter-Bank
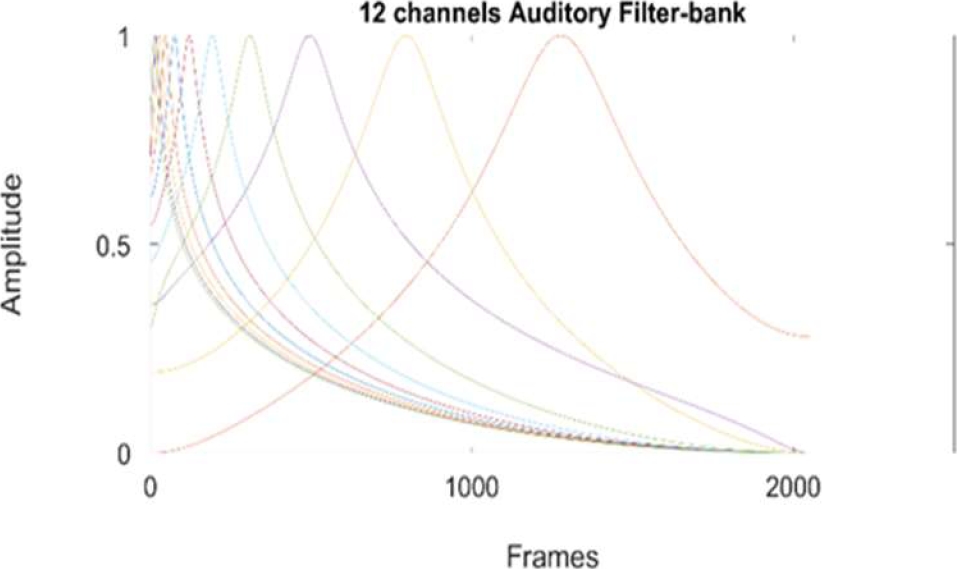
The gamma-tone filter is a well-known model, inspired by human auditory system behavior based in auditory “channels”.
The filter widths are normally measured with critical band values and although it is possible to vary them [11], we only focus our attention on the frequency spacing between the channels.
A criterion to allocate frequency spacing between the channels consist of to specify the highest and lowest frequencies along with the desired number of channels and so calculate a set of frequencies uniformly on the equivalent rectangular bandwidth (ERB) scale [12], where lowest frequency depends on the application and the highest value corresponds to half the sampling frequency.
We instead applied the functions (3) and (4) to calculate the center frequency of each channel at the same range and normalized them to constant energy of 1. Results are showed in figure 4.
3 NMF Model and Signal Filtering
3.1 NMF Model
NMF is a popular and used technique in AMT, whose goal is to factorize a nonnegative matrix
The rank
We applied the version of NMF described and implemented in the toolbox of [13].
Columns of W are labelled and initialized with spectra of synthetized isolated piano notes.
3.2 Processing. Signal Filtering
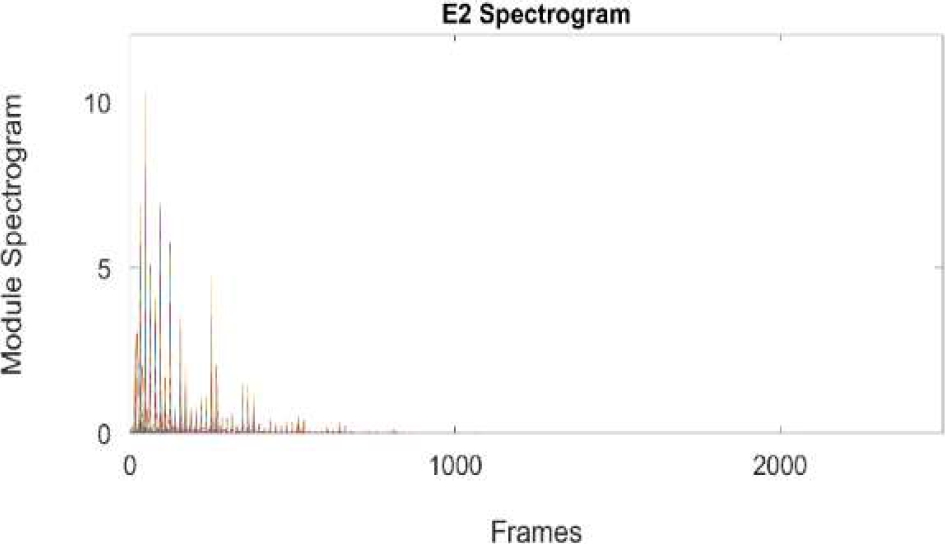
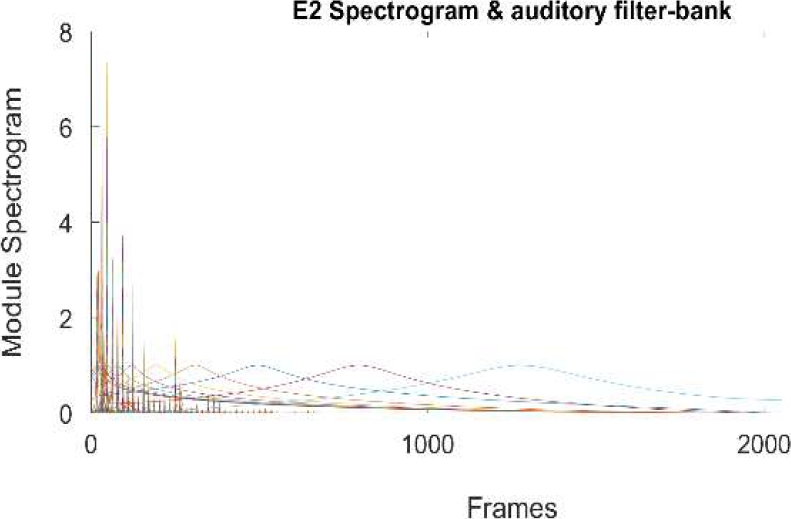
We used the short-time Fourier transform (STFT) to compute the spectrogram of the musical signal, using Hanning window with a 50%, discarding the mirror spectrum (2049 samples per frame). Then we take its module as the non-negative matrix V.
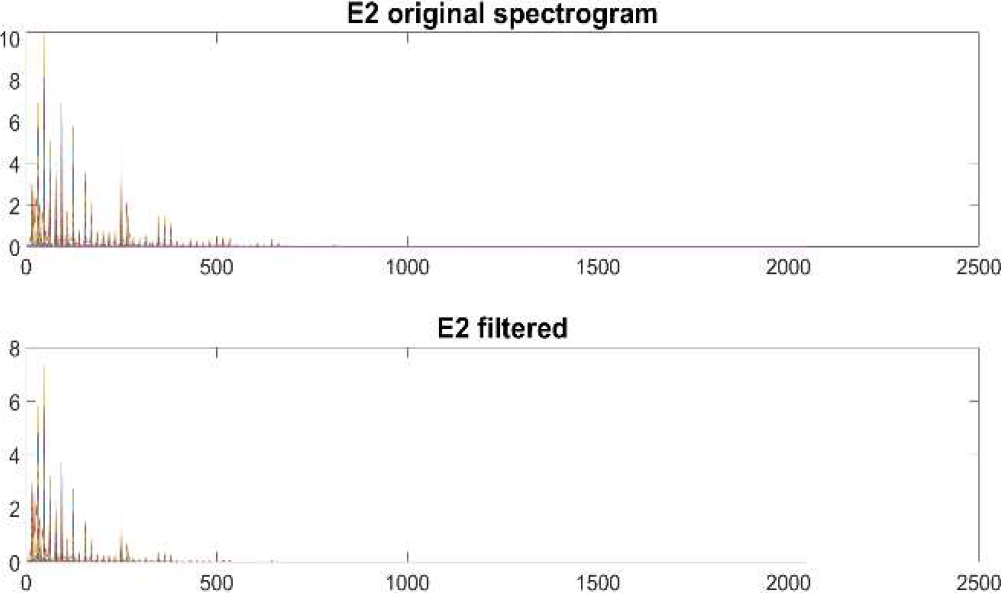
The V spectrogram is passed through the filter-bank explained on section 2.2. We assume that the modified spectrogram contains the main harmonics of note. Figure 6 and 7 shows the analysis over E2 piano note.
4 Postprocessing
Factors W and H represent pitched elements and their temporal activity, respectively.
Each label of W represents the note spectrum and rows of H are associated with each one, describing their onsets and offsets.
We looked the optimal detection threshold to get the best performance over the test database. Thus, after different experiments we fixed empirically a threshold of a constant value
The product of this step is a frame-level transcription able to be compared to a MIDI file to that serves as the ground truth.
5 Experiments
5.1 Mono and Polyphonic Music Tests
In order to verify an appropriate separation of components and understand the operation of NMF for analyzing alone and simultaneous activity of pitches in music, two preliminary tests were performed.
First test consisted of an analysis over individual notes played. An example of major scale based on C in the 4th octave of piano was created and synthetized to audio using a music software [14].
This scale consists of the pitches C4, D4, E4, F4, G4, A4, and B4, shown in figure 10.

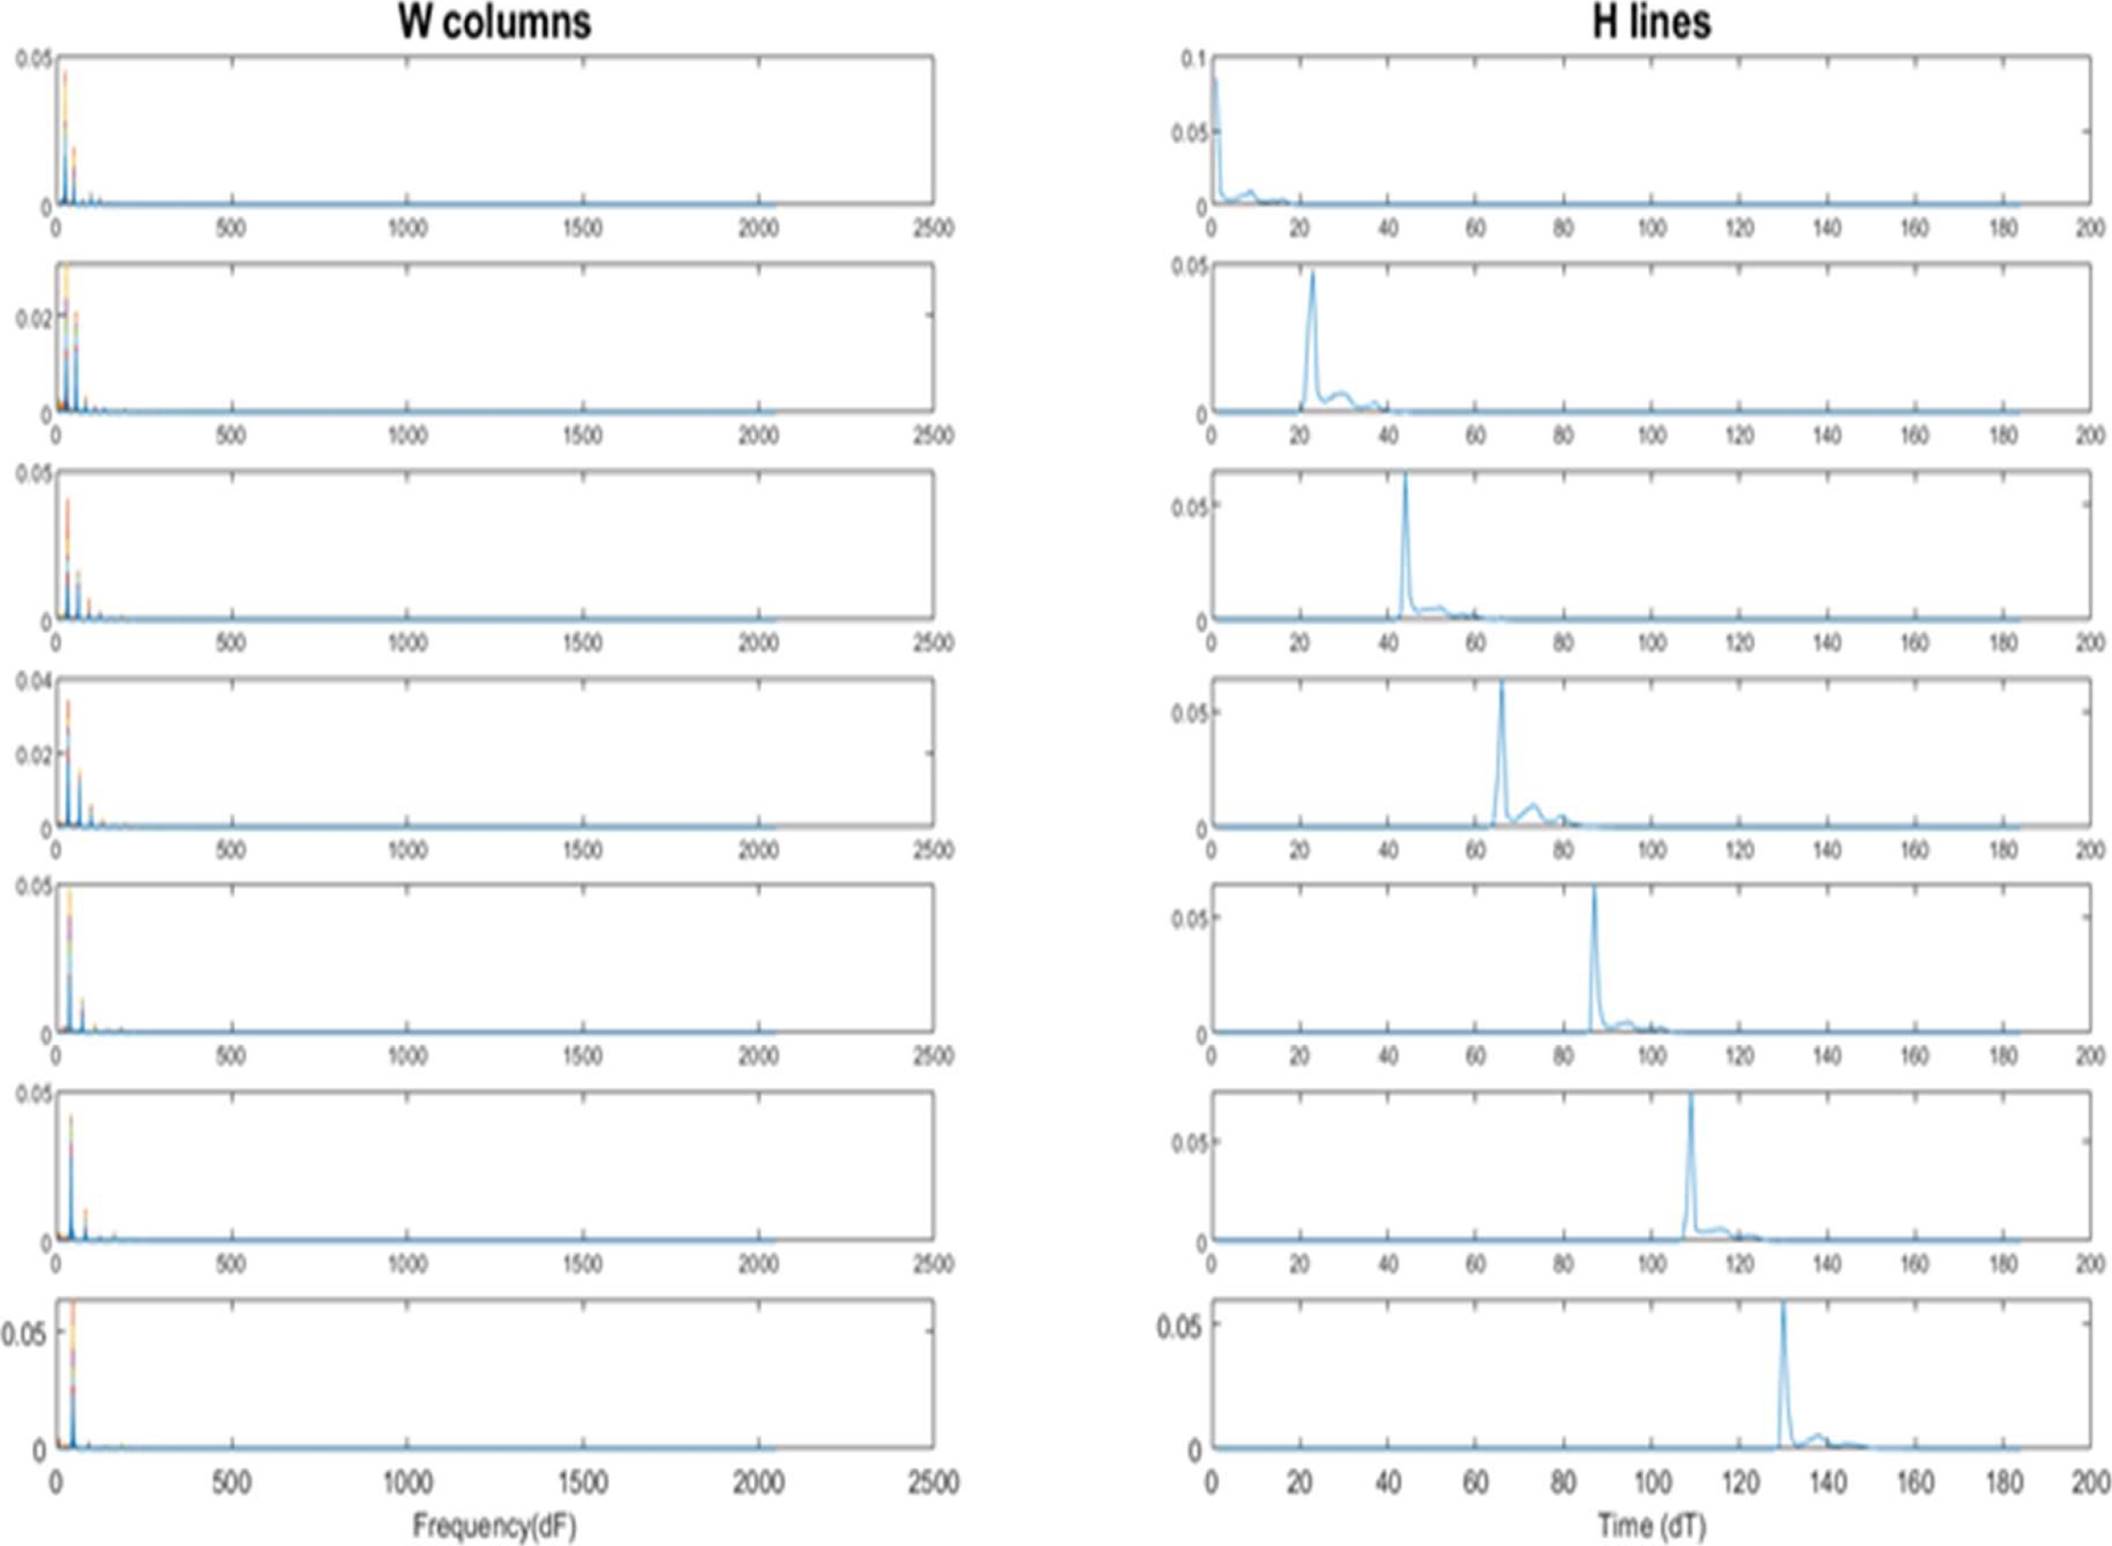

The example was analyzed by NMF, results are shown in figure 9, left graphs represent the frequency content while the ones on the right show temporal occurrences.
The second test was performed over a polyphonic example of execution of four chords in the same octave piano, shown in figure 11.
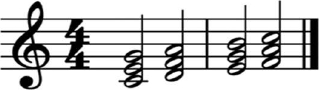
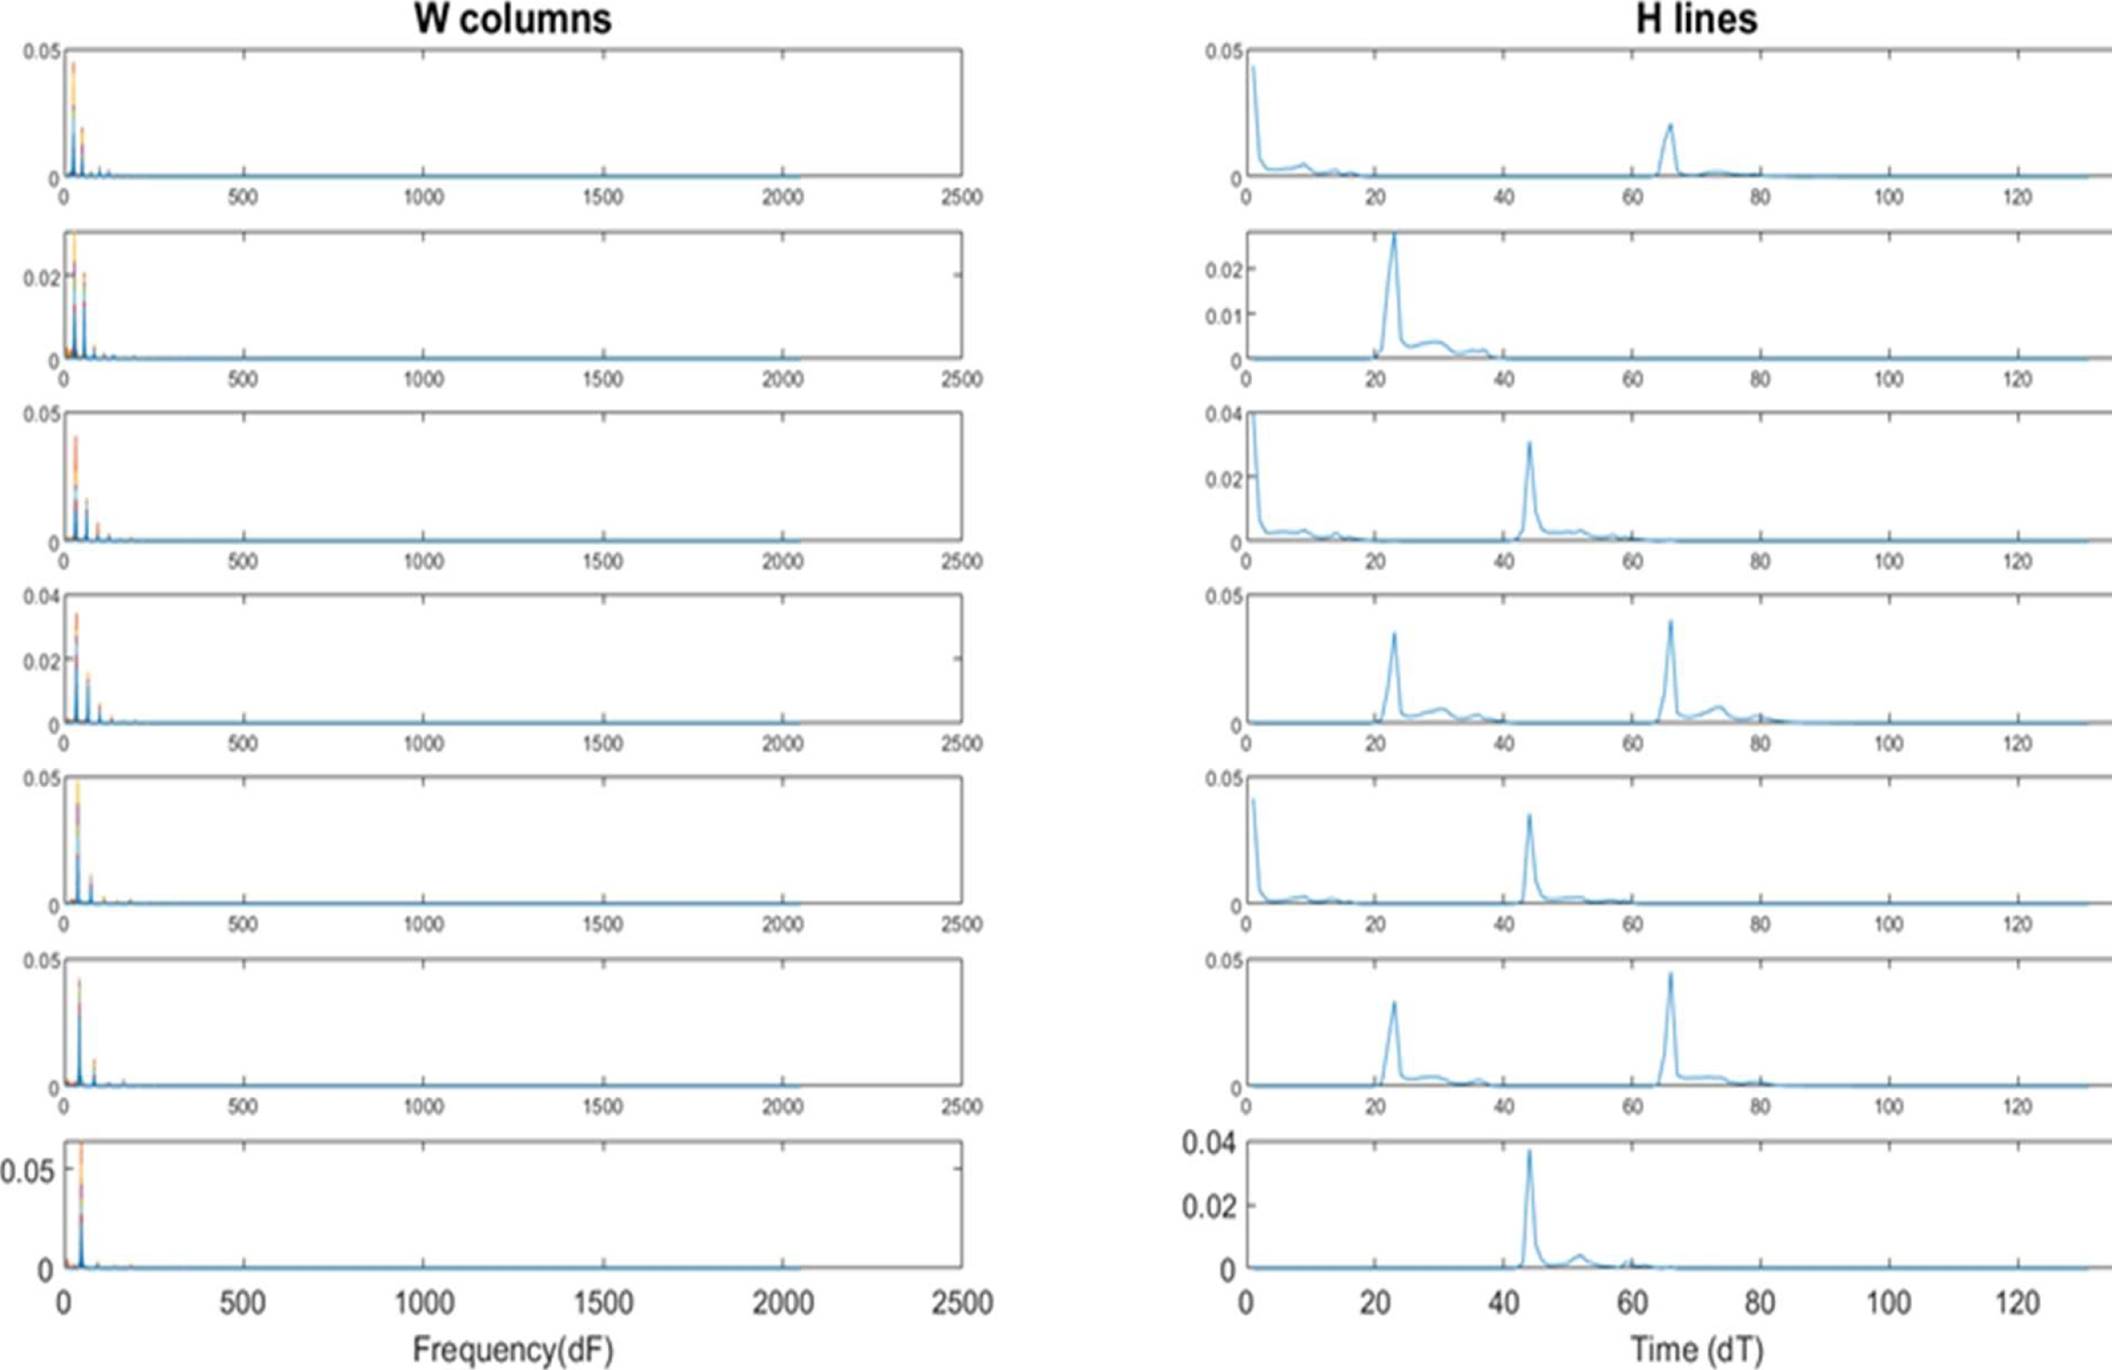
Each chord C major (C, E, G), D minor (D, F, A), E minor (E, G, B) and F major (F, A, C) was played consecutively.
Although the software used to generate synthetic sounds makes notes of strictly identical pitch and therefore, a rather ideal situation, these test aids to understand operation of the NMF technique, demonstrating that the algorithm is useful in describing activity of each pitch.
Because of the maximum number of notes to recognize for both tests are seven, the number of components in algorithm was set to R = 7.
5.2 Main Experiment
We evaluate the performance of the proposed system using a set of thirty polyphonic classical pieces in MIDI format included in [15] and synthetized to audio (WAVE format) by same software used in 7.1.
We use the whole piece in all cases, MIDI files served as the ground truth and allowed comparison with the performed transcription.
The number of components was set to R = 60, including the notes within the range from the second to the sixth octave of piano.
We worked with the unmodified and filtered STFT spectrogram. Experiments with the different number of filters inside of the auditory filter-bank implementation were performed.
6.1 Evaluation Criteria
MIREX [16] criteria for frame-based evaluation in MPE task states to compare and report the transcribed output and the MIDI ground-truth frame by frame using a 10 msec.
Three metrics evaluated in each frame are precision, recall and accuracy. Precision measure is the value of
6.2 Performance Results
Table 1 shows the average transcription performance over the polyphonic dataset applying 8, 12 and none filters to input spectrogram of the NMF model. Although both recall and accuracy of unmodified spectrogram got over the proposed system, we achieved a better precision average using the proposed auditory filter-bank.
Table 1 Frame-based evaluation of system applying 8, 12 and none filters
|
Number of filters |
Precision (%) |
Recall (%) |
Accuracy (%) |
| None | 86.09 | 26.92 | 25.49 |
| 8 | 86.59 | 24.96 | 23.69 |
| 12 | 86.05 | 24.37 | 23.07 |
The results show that a spectrogram modified with eight filters gives the best precision value, thus this is the proposed system in this paper.
After we evaluated the performance of the proposed system against another system in the state-of-the-art, SONIC [17], using the same polyphonic dataset. Table 2 shows results for this evaluation. Considering that SONIC achieved solid results at the 12th running MIREX in 2016 on the evaluation of Multiple Fundamental Frequency Estimation & Tracking task and that it is currently available because of the executable file for testing is provided by the author [18], it is a suitable reference of comparison for this work.
Table 2 Frame-based evaluation of proposed system vs state of art
|
Precision (%) |
Recall (%) |
Accuracy (%) |
|
| Proposed system | 86.59 | 24.96 | 23.69 |
| SONIC system | 85.30 | 66.68 | 59.30 |
Transcriptions of the pieces performed by proposed system, even when they are complex, reach an adequate rate of precision. Typical errors presented during evaluation include note detection errors wrong pitches (depending on the threshold value), difficulty recognizing low-pitched notes, and missing notes in chords of various notes. [4] explains that these same tendencies are present when they analyzed synthetic or real sounds, so a similar performance could be expected in those cases.
Last results in Table 2 show that proposed system achieving a better precision average again. However, in that case, recall and accuracy measures remain much lower. To improve them, a more sophisticated method could be investigated in future.
7 Conclusion and Future Work
We have presented a new approach for designing an auditory filter-bank and applied it in the problem of automatic transcription of polyphonic music. We implemented a NMF toolbox, using a spectrogram filtered and decomposed the audio content of the input music file in factors W and H. After the postprocessing stage gives a frame level transcription and we evaluate its performance.
Although comparison between performance of the system when a filtered or non-filtered spectrogram is used does not highlight a clear superiority of one of them upon the other, evaluation results in precision show that the proposed approach is viable.
Then we use this system vs another one in the state art, achieving similar results.
The work can be improved in four aspects. First, within the set of transcribed pieces, there are some that include notes outside the R range.
Therefore, expanding the R range to the eighty-eight notes of the piano may help improve the performance of the system. Second, even with the application of filters to the time-frequency representation of musical signal, this aspect may improve if Fourier spectrogram is substituted by a representation that avoid its well-known effect of resolution trade-off.
Third, a more sophisticated and finely tuned method should be developed in future for improving the performance in recall and accuracy metrics. Last but not least, although our algorithm creates a basic music sheet from the information of frame-level transcription, a specialized method that comprehend the music structure, say, a note-level transcription, could be developed in future work.

