


 nueva página del texto (beta)
 Inglés (pdf)
 Artículo en XML
 Referencias del artículo
 Enviar artículo por email
 Citado por SciELO
  Similares en
SciELO
Similares en
SciELO 
 Permalink
1 Introduction
The origin of the novel coronavirus (2019-nCoV) was spotted in Wuhan province, China on December 31, 2019, named COVID-19 by WHO [1]. The World Health Organization (WHO) has declared the novel CoV outbreak as Public Health Emergency worldwide on January 30, 2020, conveyed according to the act of International Health Regulations [2].
The clinical characteristics of CoV are classified as most common symptoms (fever, dry cough, and tiredness), less common symptoms (aches and pains, sore throat, diarrhea, conjunctivitis, headache, loss of taste or smell, and a rash on the skin, or discoloration of fingers or toes) and serious symptoms (difficulty breathing or shortness of breath, chest pain or pressure, and loss of speech or movement) [3, 4].
The prevention strategies regarding interruption of the CoV spreading were noted as early detection, isolating and treating cases, contact tracing, and social distancing. The transmission of CoV can be occurred by directly connected to the infected person via coughing or sneezing within closed connecting (<1m) and indirectly also infected by immediately touching or using the infected surfaces or objects [5].
Recently, the article published in the New England Journal of Medicine has produced evidence of the COVID-19 virus spreading through airborne transmission. The home quarantine is enough for a healthy person affected with mild CoV symptoms, on average 5–6 days are essential to show the symptoms otherwise in worst cases takes up to 14 days [6].
Over 80% of infected persons are recovered from COVID-19 who had low levels of antibodies of SARS-CoV-2 in their blood. The careful observation of the development of antibodies in infected persons helps to develop the vaccines and treatment for COVID-19 [7].
Due to lack of vaccines or the proper treatment, the person can slow down the transmission of COVID-19 by regularly washing the hands with soap and water, maintaining the social distance of at least 1 meter (3 feet) between yourself and others, avoiding going to crowded places, don’t touch eyes, nose, and mouth unnecessary, stay home and self-isolate while minor symptoms, and up to date with the latest information from trusted sources, such as WHO or your local and national health authorities [8].
The WHO has brought the world’s scientists and global health professionals to collaborate to accelerate the research and development process, and develop the treatment and vaccines for controlling the coronavirus pandemic [9]. Various studies on epidemiologic history, laboratory conditions, analyze the clinical characteristics, treatment regimens, and prognosis of patients are commenced regarding the instantiation of the outbreak of COVID-19 [10,11].
The clinical characteristics have been studied on mild symptoms affected patients, the outcomes are varied greatly [12, 13]. This is very difficult to find out a highly risky group by concerning the only age and gender factors. Furthermore, it is necessary to predict the infected groups, provide the real treatments with constraints hospitality resources, and health practitioners faced difficulties while treating the patients without any previous experience. Out of these limitations, artificial intelligence (AI) can analyze the data, learn effective patterns, and suggest while decision-making processes. Over the last two decades, AI has achieved countless milestones in the field of health care and advisory systems such as biomedical information processing, disease diagnostics and prediction, and application to radiology, pathology, ophthalmology, and dermatology [–16].
The machine learning algorithms also effort to early detect and predict the health care issues in the application area of latent diseases [17], Health Monitoring System [18], Brain Stroke [19], early-stage disease risk prediction [20], and Acute Kidney Injurious prediction [21]. Similarly, the deep learning methods are extremely dedicated to the application area of health such as Alzheimer's disease [22], emotion analysis towards mental health care [23], Cancer Care [24], and prediction of pain progression in knee osteoarthritis [25].
We have observed that the contribution of AI, machine learning, and deep learning are considerable in the health care system and the application area of such techniques can also be extended to predict the COVID-19 infection.
In this paper, we provide the classical supervised machine learning algorithms and deep learning methods for the prediction of COVID-19 infection. Twelve classifiers (nine classical supervised machine learning algorithms and three deep learning methods) are designed and applied to laboratory datasets for finding the infected patients.
The performance of our implemented models is compared based on the classification accuracy rate. The main objectives are covered in this paper are summarized as follows:
– Processing towards introducing the prediction system for the identification of COVID-19 infected persons using machine learning and deep learning algorithms rather than Chest X-ray or CT-Scan Images.
– Our research work compared with various machine learning and deep learning algorithms mention in this paper. Further, we also analyzed the experimental results with other recently published research works.
– Our work will motivate the researchers to further architect and build more effective models and include additional parameters such as genders, travel details, previous medical treatment details, etc for boosting the prediction of COVID-19 infection outcomes.
The remainder of the paper is organized as follows. Section 2 elaborates the related works regarding the prediction of COVID-19 infections. The essential information for the implementation of the experimental dataset and basic introduction to methodology is described in section 3. Section 4 provides the initial configuration setup for the method used in this paper.
The evaluation metrics such as accuracy, precision, recall, F1-score, and AUC-ROC score used for evaluating the classification performance are presented in section 5. The evaluation parameters and experimental results of the proposed classification model's performance are comprehensively analyzed with recently published works are detailed in section 6. Finally, section 7 contains the conclusion of our research work and future scope.
2 Related Works
This is very important to continue monitoring and predicting health care tasks. The computer-aided clinical systems are widely used as assisting tools for caring the various health-related issues such as diagnosis of breast cancer [26], diagnosing early gastric cancer [27], brain pathology identification [28], computer-aided drug discovery [29], health care facilities management [30].
The medical experts can use these techniques as assistance for better prediction of diagnosing related issues. This study is extremely dedicated to building the recent methodological model for predictive the COVID-19 infection. Recently, various literature was published related to deep learning methods for COVID-19 infection prediction using chest X-ray or CT-Scan Images [–33].
The authors [34] have obtained the clinical data set from the institutional ethics board of Wenzhou Central Hospital and Cangnan People’s Hospital in Wenzhou, China. The effective features were extracted using eleven feature selection algorithms (ALT, Myalgias, Hemoglobin, Gender, Temperature, Na+, K+, Lymphocyte Count, Creatinine, Age, and White Blood Count). Six machine learning algorithms (Logistic Regression, KNN (k=5), Decision Tree based on Gain Ratio & Gini Index, Random Forests, and Support Vector Machine (SVM)) were applied and accuracy measured on 10-fold cross-validation.
The SVM was obtained the maximum accuracy of 80% among the listed classifiers. The paper [35] have also applied the machine learning (neural networks, random forests, gradient boosting trees, logistic regression, and support vector machines) techniques on the clinical dataset and measured the performance based on AUC, sensitivity, specificity, F1-score, Brier score, Positive Predictive Value (PPV), and Negative Predictive Value (NPV).
This paper was used as the clinical dataset, obtained from Hospital Israelita Albert Einstein in São Paulo, Brazil, and split into 70% for training and 30% for testing. The SVM and random forests classifiers were achieved the best score valued regarding measured parameters (AUC = 0.847, Sensitivity = 0.677, Specificity = 0.850, F1-score = 0.724, Brier score = 0.160, PPV = 0.778, and NPV = 0.773).
The paper [36] was used the same experimental clinical dataset as in [35] and applied the various machine learning algorithms including Logistic Regression (LR), Neural Network (NN), Random Forest (RF), Support Vector Machine (SVM), and Gradient Boosting (XGB). The predictive performance was compared in terms of AUC, AUPR, sensitivity, specificity, and specificity at greater than 95% sensitivity (Spec. @95%Sens.). The XGB was obtained the best experimental result, noted as AUC = 0.66, AUPR = 0.21, Sensitivity = 0.75, Specificity = 0.49, Spec.@95% Sens. = 0.23.
In the paper [37], the deep learning methods (Artificial Neural Networks (ANN), Convolutional Neural Network (CNN), Long Short Term Memory (LSTM), Recurrent Neural Network (RNN), CNN + LSTM, CNN + RNN were applied on the clinical dataset used in [35], experimental results were evaluated with train-test split and 10 fold cross-validation approach, and scores are measured based on precision, F1-score, recall, AUC, and accuracy scores. The hybrid model CNNLSTM of deep learning methods was achieved the best predictive score accuracy = 86.66%, F1-score = 91.89%, precision = 86.75%, recall = 99.42%, and AUC = 62.50%.
3 Experimental Dataset and Methodology
The purpose of this section is to outline the necessary background information regarding the experimental dataset and methodology used in this paper.
3.1 Dataset Description
Here, we provide a detailed description of the experimental dataset, available at Hospital Israelita Albert Einstein at Sao Paulo Brazil, and accessed through [36].
The samples were collected to test the infection of SARS-CoV-2 in the early month of 2020 and available on [38]. This dataset contained a sample record of 5644 patients with a contribution of 111 different laboratories. The infection rate of patients was around 10% of which around 6.5% and 2.5% required hospitalization and critical care. The rest of 90% of patients reported negative SARS-CoV-2. The information related to the gender of patients is not mentioned in this dataset.
The dataset consists of a total of ten columns (Patient ID, Patient age quantile, SARS-Cov-2 exam result (negative/positive), Patient admitted to the regular ward (yes/no), Patient admitted to the semi-intensive unit (yes/no), Patient admitted to intensive care unit (yes/no), Hematocrit, Hemoglobin, Platelets, and Mean platelet volume). We apply the split-test approach and randomly divide the dataset into training (80%) and testing (20%) respectively for validating our models. Furthermore, the 10-fold cross-validation is also used to approximately balance the accuracy rate of models.
3.2 Methodology
Artificial Intelligence (AI) is a loose interpretation of human intelligence into the machine, accomplished through learning, reasoning, and self-correction. The AI-based machine can make decisions based on predefined rules and algorithms without interfering with human beings. Machine learning (ML) and deep learning (DL) are considered a subset of AI and adopt additional features to beat the human being in terms of intelligence and accuracy. The working performance of ML is differing from DL due to the way data is presented in the system. The ML is always required structured data whereas deep learning relies on the reassembling of artificial neural networks (ANN). It is essential to hand over the control to the human beings for handling the applied areas of the ML concept. The DL system aims to adopt the same features without supplementary interference with human beings. The large amount of data processed and used the complex mathematical calculations in the algorithms; DL systems require much more powerful computing power rather than simple ML systems. So, a deep learning system consumes much time (a few hours to a few weeks) to train the model as compared to a simple ML model (a few seconds to a few hours).
In this study, we serve a reasonable framework for validating the developed clinical predictive models to predict the COVID-19 infection. We developed the twelve different models (nine ML and three DL) for evaluation of the study: logistic regression, K-Neighbors classifier, support vector classifier, decision tree classifier, random forest classifier, AdaBoost classifier, GaussianNB, linear discriminant analysis, quadratic discriminant analysis, Convolutional Neural Network (CNN), Recurrent Neural Networks (RNN), and Long Short-Term Memory (LSTM). The logistic regression classification algorithm is used to predict the probability of a categorical dependent variable, which should be a binary variable that contains the binary coded (true/false).
This model of ML is used for predicting the risk of developing chronic diseases [39], Trauma and Injury Severity Score (TRISS) [40], diabetes [41], heart disease identification [42], breast cancer [43], Alzheimer [44], etc. The K-Nearest Neighbors has supervised classification algorithms in ML, stores all available cases, and classifies new cases based on a similarity measure, e.g., hamming or standardized distance function.
This is a popular method with a wide variety of applications in many different areas of voice disorder identification [45], brain tumor classification [46], and more.
Support Vector Machine (SVM) is a supervised machine learning algorithm that can be used for classification, regression, or outlier detection. The SVM assembles the hyperplane or set of hyperplanes in a high or infinite-dimensional space. The hyperplane achieved a good classification result that has the largest distance to the nearest training data point of any class. This is a popular method with a wide variety of applications in many different areas of skin disease detection [47], heart disease diagnosis [48], etc.
Decision tree is supervised machine learning and classifies the instances according to their feature values [49]. This classifier follows the concept of a divide-and-conquer algorithm that splits the data into subsets based on homogeneous properties. This method has innumerable applications in many different areas such as detection of Hepatocellular carcinoma (HCC) in clinical data [50], Opioid Use Disorder (OUD) understanding [51], etc.
Random forest is a supervised learning algorithm and can be used both for classification and regression. It usually draws the set of decision trees from a randomly selected subset of the training set and then merges them to occupy a more accurate and stable prediction result. Its applications can be found in many areas such as identification of human vital functions related to the respiratory system [52], prognosis prediction [53], etc.
AdaBoost or Adaptive Boosting classifier is an iterative approach that learns from the incorrectly classified instances by weak classifiers and fits additional copies of the classifier for turning them into strong classifiers. The application areas of the AdaBoost classifier are relevant to the early prediction of lung cancer [54], pinus diseased recognition [55], etc.
GaussianNB classifier provides the way of implementing the concept of the Gaussian Naïve Bayes algorithm for classification. This method could be extended to solve the problems in various areas such as diabetes prediction [56], a prediction model for the detection of cardiac arrest [57], etc.
Linear Discriminant Analysis (LDA) classifier is based on the value of the prediction, estimated by the probability new inputs set belongs to each class. The output class is designated by the highest probability value and built the prediction. This convention is mostly preferred for measuring the models for human health effects [58], detection of epileptic seizures using EEG signals [59], etc.
Quadratic discriminant analysis is used as both classifier and dimensionality reduction technique but cannot be used as a dimensionality reduction technique. This approach is a variation of the LDA classification technique that also allows for non-linear separation of data. This method is applied in various application areas such as epileptic seizure detection [60], pre-diagnosis of Huntington’s disease [61], etc.
Design of CNN architecture is inspired by the biological vision system and is composed of four subsequent stages of layers: convolutional layer, pooling layer, activation layer, and the fully-connected layer. Each distinct layer is responsible for transforming the input volume to the output volume through different hidden layers to achieve the predefined goal. We can apply the CNN method in different application areas such as automatic skin disease diagnosis [62], pneumonia detection [63], breathing disorder detection [64], arrhythmia classification [65], small lesion detection [66], etc. A plausible and useful theory behind the RNN method is to make use of sequential information that means output from the previous stage provided as input to the current stage. The RNN has a concept of storage that stores all calculated information and also exhibits temporal dynamic behavior. For this reason, this method represents an attractive option for arrhythmia detection [67], hemoglobin concentration prediction [68], Heart sound classification [69], etc.
The LSTM is a special kind of RNN and explicitly designed to avoid the problem of long-term dependency. The LSTM carried out the chain structure that contains four neural networks and various memory blocks, called cells. These cells are responsible for retaining the information and gates to manipulate the memory, named as forget gate, input gate, and output gate. We can use the LSTM approach in various fields such as EEG-based emotion classification [70], analyze psychological effects [71], abnormal heart sound detection [72], chronic laryngitis classification [73]. Figure 1 shows the logical diagram of our experimental prediction model used in this paper.

4 Configuration of Experimental Methods
In this section, we are addressing the detailed description regarding the configuration of ML and DL methods, used in this paper for the prediction of COVID-19 infection. For the exposure of ML algorithms as compared to DL methods, we have used the Scikit-learn machine learning classifiers (logistic regression, K-neighbors classifier, support vector classifier, decision tree classifier, random forest classifier, AdaBoost classifier, GaussianNB, linear discriminant analysis, and quadratic discriminant analysis).
These methods are publically accessible with full documentation and can be imported from the sklearn library [74]. The initial values of parameters for each classifier and reference section contain the user guideline URL, mentioned in table 1. The layer architecting, the details and parameters of each DL classifier used in this study are mentioned in table 2.
Table 1 ML classifiers parameter adjustment
| classifier | scikit-learn method | parameters | Ref. |
| Logistic Regression | sklearn.linear_model.LogisticRegression | C=1.0, max_iter=100, penalty='l2', solver='lbfgs', tol=0.0001 | [75] |
| K-Neighbors | sklearn.neighbors.KNeighborsClassifier | leaf_size=30, metric='minkowski', n_neighbors=3, p=2 | [76] |
| Support Vector | sklearn.svm.SVC | C=0.025, cache_size=200, degree=3, kernel='rbf', max_iter=-1 | [77] |
| Decision Tree | sklearn.tree.DecisionTreeClassifier | criterion='gini', min_samples_leaf=1, presort='deprecated', splitter='best' | [78] |
| Random Forest | sklearn.ensemble.RandomForestClassifier | n_estimators=100, min_samples_split=2, min_samples_leaf=1 | [79] |
| AdaBoost | sklearn.ensemble.AdaBoostClassifier | algorithm='SAMME.R', learning_rate=1.0, n_estimators=50 | [80] |
| GaussianNB | sklearn.naive_bayes.GaussianNB | var_smoothing=1e-09 | [81] |
| Linear Discriminant Analysis | sklearn.discriminant_analysis.LinearDiscriminantAnalysis | solver='svd', tol=0.0001 | [82] |
| Quadratic Discriminant Analysis | sklearn.discriminant_analysis.QuadraticDiscriminantAnalysis | reg_param=0.0, tol=0.0001 | [83] |
Table 2 Architecting configuration of DL methods
| Parameters | CNN | RNN | LSTM |
| Number of layers | 1 | 1 | 1 |
| Activation function | ReLU, Softmax | ReLU, Softmax | ReLU, Softmax |
| Learning rate | 0.0005 | 0.0005 | 0.0005 |
| Loss function | Sparse categorical crossentropy | Sparse categorical crossentropy | Sparse categorical crossentropy |
| Number of epoch | 30 | 30 | 30 |
| Optimizer | Adam | Adam | Adam |
| Dropout | 0.4, 0.6 | 0.4, 0.6 | 0.4, 0.6 |
| Batch size | 512 | 1024 | 1024 |
| Total parameters | 9,442,306 | 2,102,274 | 4,728,322 |
The parameters are named as number of layers, activation function, learning rate, loss function, number of the epoch, optimizer, dropout, batch size, and total parameters are responsible for framework the DL methods. Each layer is configured with different values that can be optimized and manipulate the input data.
The gentle introduction of the activation function is used for deciding whether a neuron should be activated or not with the help of calculating the weighted sum. How quickly and slowly, the neural network model learns a problem depends on learning rate values. The loss function calculates the prediction error due to estimation loss by the neural networks. The epoch values count the pass of the full training data set through the model. The optimization function is responsible for reducing the losses and accelerating the accuracy rates as much as possible. The dropout is commonly used in deep neural networks to prevent overfitting problems. The batch size specifies the number of training samples processed before the model execution. The total number of parameters aggregates all weights and biases.
5 Evaluation Metrics
The evaluation metrics exist with the Sklearn method to compare the performance of classifiers. In this section, we discuss the evaluation metrics, experimental result analysis based on train-test split and 10-folds validation approach, and result comparison with published works.
To evaluate the classification performance of models, we can use accuracy (A), precision (P), recall (R), and F1-score (F1). For a binary classification problem, the confusion matrix holds the entries of True Positive (TP), False Positive (FP), True Negatives (TN), and False Negatives (FN). The diagonal entries hold the correct prediction TP and incorrect prediction denoted by TN. The classifier made the wrong prediction, referred to as FP and FN.
Accuracy measures the ratio between the number of correct predictions and the total number of input samples. The classification model is observed as perfect when the number of predicted samples is equal to the total number of samples. For the multiclass classification problem, the numbers of classes are denoted by the value of k.
Precision equation measures the number of correct positive results divided by the number of positive results predicted by the classifier. The recall evaluates the number of correct positive results divided by the number of all relevant samples.
F1-score is primarily used to measure the model’s test accuracy and the score varies between 0 and 1 values. The high precision value and low recall value achieve a great accuracy rate but avoid the large number of samples that are difficult to classify. Table 3 illustrates the equation to measure the classification accuracy, precision, recall, and F1-score, extracted from the confusion matrix. The ROC-AUC (Receiver Operating Characteristics - Area under the Curve) is frequently used to evaluate the classification and prediction model's performance. This examines the model’s ability while distinguishing between positive and negative classes. The higher AUC score indicates the better model for the prediction of patients with infected or not infected. The ROC curve is plotted with False Positive Rate (FPR) on X-axis and True Positive Rate (TPR) on Y-axis (figure 2).
Table 3 Equations for evaluating the classification performance
| Evaluation Metric | Equation |
| Accuracy (A) | |
| Precision (Pk) | |
| Recall (Rk) | |
| F1-score (F1k) |
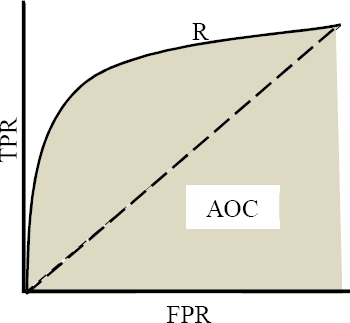
The FPR and TPR score are calculated using the expression (1) and (2), respectively:
The idea behind the calculation of the AUC score (exists between 0 and 1) is the measurement of separability. The AUC score exists near 1, which means has good separation capability. For the multi-class problem, we can plot the N number of AUC ROC curves for multiple classes.
6 Experimental Results and Discussion
This section consists of the experimental results of ML and DL methods for the prediction of COVID-19 infection, considering a total of 600 patients using 18 different laboratory findings. These results are evaluated based on the train-test split approach, 10-folds cross-validation, ROC-AUC score, and comparison of results with published works.
6.1 Train-Test Split Approach
We can observe in Table 4, the accuracy results of all ML models have reached at least 80% and above. The Logistic Regression, K-Neighbors, and AdaBoost classifier have achieved the best evaluation performance with an 85.00% accuracy score. The Support Vector, Random Forest, GaussianNB, and Linear Discriminant Analysis were observed as the second-best models. The experimental results of all DL application methods through the aggregation of the mean values of accuracy score. In terms of accuracy predictive performance, we observed that the overall best score was achieved by CNN with a 91.88% score followed by RNN (accuracy = 90.27%), then LSTM (accuracy = 89.99%).
Table 4 Summary of experimental results of all ML and DL with the train-test split approach.
| Classification Models | |||
| Machine Learning Methods | Deep Learning Methods | ||
| Methods | Accuracy (%) | Methods | Accuracy (%) |
| Logistic Regression | 85.00 | CNN | 91.88 |
| K-Neighbors | 85.00 | ||
| Support Vector | 84.16 | ||
| Decision Tree | 82.50 | RNN | 90.27 |
| Random Forest | 84.16 | ||
| AdaBoost | 85.00 | ||
| GaussianNB | 84.16 | LSTM | 90.00 |
| Linear Discriminant Analysis | 84.16 | ||
| Quadratic Discriminant Analysis | 80.83 | ||
6.2 10-Fold Cross-Validation Approach
In the 10-fold cross-validation, the experimental dataset is randomly partitioned into 10 equal sub-datasets. Out of these sub-datasets, a single sub-dataset is assigned as a validating dataset, and the rest of the nine sub-datasets are retained as training data. The cross-validation technique repeats the process ten times and each of the 10 - subsamples is used exactly once as the validation data. The final result of 10-folds can be produced by aggregating the average results of each folding. Table 5 shows the experimental results of all machine learning application models with 10 folds cross-validation approach.
Table 5 Summary of experimental results of all ML and DL with 10 folds cross-validation approach
| Classification Models | |||
| Machine Learning Methods | Deep Learning Methods | ||
| Methods | Accuracy (%) | Methods | Accuracy (%) |
| Logistic Regression | 89.79 | CNN | 87.66 |
| K-Neighbors | 87.29 | ||
| Support Vector | 87.29 | ||
| Decision Tree | 83.75 | RNN | 86.49 |
| Random Forest | 89.16 | ||
| AdaBoost | 87.91 | ||
| GaussianNB | 83.54 | LSTM | 86.66 |
| Linear Discriminant Analysis | 87.70 | ||
| Quadratic Discriminant Analysis | 82.29 | ||
In cases of relatively small samples, the k fold cross-validation approach is frequently used to measure the accurate classification performance of classifiers especially in health studies [35]. In table 5, we have observed the accuracy score of all ML and DL classifications methods based on 10 folds cross-validation techniques. The performance of all ML algorithms was better in 10 folds cross-validation approach comparison with the train-test split strategy but opposite performance results with DL methods. The accuracy results of all ML models have reached at least 82.29% and above.
Logistic Regression has achieved the best accuracy performance with an 89.79% score, followed by Random Forest as the second-best model with 89.16% accuracy. Moreover, the experimental results of all DL application methods were observed using the mean values of accuracy score. CNN has achieved the overall best accuracy 91.88% score, followed by RNN (accuracy = 86.49%) then LSTM (accuracy = 86.66%).
6.3 Results Interpretation of Area Covered Under the ROC Curve
The AUC-Score determines the best model prediction on classes and ranges in value from 0 to 1. The various points on the ROC curve determine the different characteristics of the model’s performance. The following table 6 determines the model’s characteristics based on range value [84]. The classification models achieved more than 0.60 AUC score value; we can say that those models were accepted for clinical prediction of COVID-19.
Table 6 Performance measurement based on AUC score
| AUC-Score | Model’s characteristics |
| 0 | Inaccurate Test |
| 0.5 | No Discrimination |
| 0.6 to 0.8 | Acceptable |
| 0.8 to 0.9 | Excellent |
| > 0.90 | Outstanding |
| 1 | Accurate Test |
The AUC score of logistic regression is considered acceptable since the results range between 0.8 and 0.9 (figure 3). The AUC scores of the remaining ML methods were excellent, all of the results were higher than 0.66. In the DL methods, the RNN achieved the highest score (AUC = 0.68), followed by CNN (AUC = 0.62), and then the LSTM approach (AUC = 0.50) (table 7).

6.4 Comparison of Experimental Results with Recently Published Articles
The paper [34] and [35] have used the classical machine learning algorithms i.e. Support Vector Machine, Random Forest, respectively. Similarly, the paper [37] compared the prediction performance of six different classical and hybrid deep learning algorithms i.e. ANN, CNN, RNN, LSTM, CNNRNN, and CNNLSTM. However, we have used both classical ML and DL algorithms. We can observe in Table 8, the best classification is obtained by deep learning methods (CNN, RNN, and LSTM). Yet, in our study, we have exposed the performance of both ML and DL methods. It has shown that the AUC-Score of all methods is acceptable for the prediction of COVID-19 infection.
Table 8 Comparison of experimental results with recently published works
| Ref. | Dataset Source | Techniques | Classification methods | Accuracy (%) | AUC | F1 – Score |
| [34] | Wenzhou Central Hospital and Cangnan People’s Hospital in Wenzhu, China | ML | Support Vector Machine | 80.00 | - | - |
| [35] | Hospital Israelita Albert Einstein at Sao Paulo, Brazil | ML | Support Vector Machine, Random Forest | - | 0.87 | 0.72 |
| [36] | Hospital Israelita Albert Einstein at Sao Paulo, Brazil | ML | Logistic Regression | 89.00 | 0.85 | - |
| Our work | Hospital Israelita Albert Einstein at Sao Paulo, Brazil | DL | CNN, RNN, LSTM | 91.88, 90.27, 90.00 | - | - |
7 Conclusion and Future Works
In this study, we have designed and developed deep learning-based machine learning models for predicting the COVID-19 infection. We have carried out the nine classical machines (logistic regression, K-Neighbors classifier, support vector classifier, decision tree classifier, random forest classifier, AdaBoost classifier, GaussianNB, linear discriminant analysis, quadratic discriminant analysis) and three deep learning methods (CNN, RNN, and LSTM) to accomplish the clinical prediction work.
The experimental data were preprocessed using standardization and then fed to our models. Further, the classification results were measured based on the accuracy score. To validate our model, we have used the train-test split approach, 10-fold cross-validation, and AUC-ROC curve score. In the train-test split approach, the best result was achieved using CNN with an accuracy of 91.88% and an AUC score of 62.11% in the deep learning application.
However, Logistic Regression, K-Neighbors, and AdaBoost classifiers have obtained a similar accuracy of 85.00% and AUC score of 85.00%, 78.00%, and 71.00%, respectively. The best accuracy value was achieved by CNN (Deep Learning) with an accuracy of 87.66% and Logistic Regression (Machine Learning) with an accuracy of 89.79%. All the ML and DL algorithms used in this study, have achieved an accuracy of over 80%.
This study carried out a major limitation with a small and imbalanced experimental dataset. The performance of our prediction model can be enhanced by increasing the size of the dataset either combining the data from different laboratories or using data augmentation techniques. Further studies were carried out from our study with findings the additional parameters such as genders, travel details, previous medical treatment details, etc. for enhancing the prediction rate. Based on our experimental results, we conclude that the clinical system should explore the use of artificial intelligence for prioritizing the models as decision support systems while reducing the personalizing infection risks.

