


 nueva página del texto (beta)
 Inglés (pdf)
 Artículo en XML
 Referencias del artículo
 Enviar artículo por email
 Citado por SciELO
  Similares en
SciELO
Similares en
SciELO 
 Permalink
1 Introduction
On December 31st, 2019, China’s National Health Commission, reported to the World Health Organization Office (WHO) the identification of a new type of coronavirus in Wuhan, Hubei, China [1]. The coronavirus was isolated on January 7th, 2020, and on January 11th-12th, 2020, WHO received information that 41 cases of infection with the new coronavirus had been preliminarily diagnosed in Wuhan city, in which 7 were critically ill.
The outbreak is presumed to be associated with exposures at a seafood market in Wuhan, however, at that time the evidence was still highly suggestive. As a precaution measure, the market had been closed on January 1st, 2020.
At this stage of the outbreak, infection among health care workers is not reported yet, being a new disease, there was no clear evidence of person-to-person transmission [2].
To date, SARS-CoV-2 is known to be transmitted from person to person by inhalation or contact with respiratory droplets and aerosols [3].
The reported numbers WHO for this disease worldwide at 10:42 am CET on May 11th, 2021 amounts to 158,551,526 confirmed cases and 3,296,855 deaths [4].
On the other hand, there are several domains where large volumes of information are stored in centralized and distributed databases [5], such as in Multimedia, for the retrieval of information by content through the similarity of objects [6]. Commerce, customer behavior is evaluated by purchasing criteria [7], in Social Sciences, to determine socio-economic patterns [8] or in Medicine, to identify relationships in drug supply [9].
In this context, many efforts are made to understand the behavior of SARS-CoV-2, which is the reason of the present research it is verified whether there is a correlation between the number of SARS-CoV-2 infection and environmental factors, so that this knowledge can be used in favor of people's health.
2 Related Work
There are investigations that analyze the influence of daily temperatures on the number of covid-19 cases in the provinces of Spain and conclude that no evidence was detected suggesting a decrease in covid-19 cases at warmer mean, minimum and maximum temperatures, but they also warn that these results should be taken with caution [15]. [16] states that there is an optimal climatic zone in which SARS-CoV-2 is concentrated, and this temperature is 5°C to 15° C, and therefore suggest that the air temperature of hospitals and homes should be outside this range.
[17] indicates that there is evidence of a lower number of cases of COVID infections in countries where temperatures are warm despite the low socio-economic situation, and they find a correlation between temperature and total COVID-19 cases of 0.59 and 0.42 with total COVID-19 cases and deaths. [18] collected meteorological data from 122 cities between January 2020 and February 2020 and get results showing a positive linear relationship, between mean temperature and confirmed COVID-19 cases, with a threshold of 3° C. They reiterate that the results are robust to sensitivity analyses.
They further clarify that there is no evidence that COVID-19 cases decrease as the climate becomes warmer.
[19] studied the influence of temperature and humidity on the number of COVID-19 infections in 100 Chinese cities and 1005 U.S. countries and found a statistically significant negative correlation between temperature and relative humidity in both China and the U.S. They claim that higher temperature and higher relative humidity potentially suppress the transmission of COVID-19.
In addition, [20] indicate that there is no clear evidence of environmental factors such as temperature, humidity or UV radiation in the spread of COVID-19 or slowing its transmission. Each of the phases is detailed below.
And they state that the scientific evidence of SARS-CoV-2 behavior with environmental factors is limited and scarce and is based more on ecological studies that do not allow measuring causality and suggest doing more in-depth studies with epidemiological designs and with more extensive data series.
3 Methodology
The process to find the relationship between natural environmental factors and the transmissibility of SARS-CoV-2 is shown in Figure 1, where 3 phases are observed: (1) Raw Data Base, (2) Data exploration and pre-processing, (3) Relationship search. The data used in this research belongs to the Tambopata District, Department of Madre de Dios, Peru, from 2020 and the beginning of the year 2021. In order to fulfill the objectives, a series of steps had to be followed, which are summarized below.
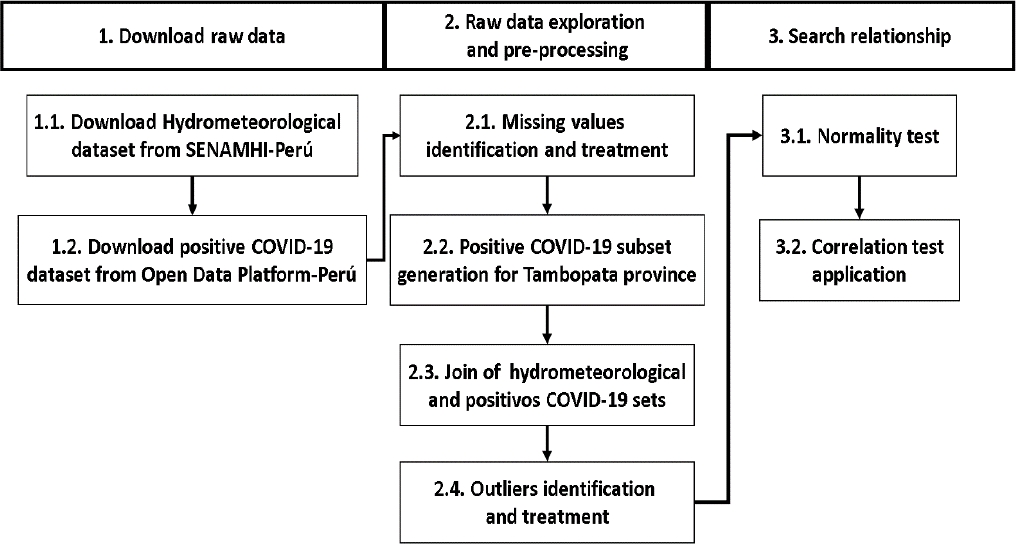
Fig. 1 Process for finding relationships between natural environmental factors and SARS-CoV-2 transmissibility
3.1 Download Raw Data
First, it was necessary to obtain environmental data from the National Service of Meteorology and Hydrology of Peru [10], and then to get medical data on the number of SARS-CoV-2 infections in Tambopata, Madre de Dios, Peru [11].
The hydrometeorological dataset was downloaded from the SENAMHI portal, which offers data from 370 stations located throughout Peru [10]. For the purposes of this study, the daily data records of the variables minimum and maximum temperature (ºC), relative humidity (%) and precipitation (mm/day) of the Puerto Maldonado MET CP station (code 100109) of the conventional-meteorological type, from March 1st, 2020 to February 28th, 2021 with a total of 365 records, were chosen because the first reported case of SARS-CoV-2 infection in the department of Madre de Dios occurred on March 18th, 2020.
Table 1 shows a sample of this dataset corresponding to the first 10 records of the aforementioned dataset. Table 1 shows from left to right the values recorded for the variables: date, maximum temperature, minimum temperature, relative humidity and precipitation.
Table 1 Structure of the Meteorological data set obtained from the Maldonado MET CP station
| Date | (°C) Maximum Temperature | (°C) Minimum Temperature | (%)Relative Humidity | (mm/day) Precipitation |
| 2020-03 | 35 | 24,4 | 87,5 | 0 |
| 2020-03 | 34,8 | 22,6 | 89,8 | 0 |
| 2020-03 | 35 | 23,8 | 86,3 | 0 |
| 2020-03 | 34,8 | 24 | 89,3 | 0 |
| 2020-03 | 34,6 | 24 | 89,6 | 0 |
| 2020-03 | 34,6 | 24,6 | 89,7 | 0 |
| 2020-03 | 34,4 | 23,6 | 90,4 | 0 |
| 2020-03 | 34,6 | 24 | 89 | 0 |
| 2020-03 | 34,2 | 24,2 | 90,9 | 10 |
| 2020-03 | 34,2 | 24 | 91,9 | 0 |
In relation to the transmissibility of SARS-CoV-2, we chose to download the dataset called Data positive for COVID-19 reported by the Ministry of Health in the National Open Data Platform of the Peruvian government, which contains the total number of reported cases that tested positive for COVID-19 in Peru, containing variables such as; department, province and district, method of diagnosis, age, sex and date of result, as of March 28th, 2021, with a total of 1,048,575 records [21].
Note Table 2, which shows the first 10 records of the aforementioned dataset.
Table 2 Structure of the data set COVID-19 Data Positive reported by the Ministry of Health (Peru)
| Region | Province | Distrit | MetodX | Age | Gender | Result_Date |
| San Martin | Mariscal Caceres | Juanjui | PR | 44 | Male | 20201110 |
| Ucayali | Atalaya | Sepahua | PR | 42 | Male | 20201012 |
| Ucayali | Coronel Portillo | Calleria | PR | 43 | Male | 20201019 |
| Amazonas | Condorcanqui | Nieva | PR | 49 | Male | 20201017 |
| Amazonas | Condorcanqui | Nieva | PR | 46 | Male | 20201103 |
| Amazonas | Condorcanqui | Nieva | PR | 49 | Male | 20201108 |
| Amazonas | Bagua | Aramango | PR | 49 | Male | 20200611 |
| Loreto | Maynas | San Juan Bautista | PR | 46 | Male | 20201029 |
| Loreto | Maynas | Belen | PR | 46 | Male | 20201104 |
| San Martin | San Martin | Tarapoto | PR | 45 | Male | 20201105 |
Table 2 shows from left to right the values recorded for the variables: department, province, district, method of diagnosis, age, sex and date of result.
In this sample, the cut-off date columns were omitted, which for all the records corresponded to 2021/03/28, indicating that the downloaded data contain information up to the indicated date, and the column called UUID, that is the universal and unique identifier for each row.
3.2 Raw Data Exploring and Preprocessing
A second step was the preparation of data, using simple statistical techniques, visualization techniques and joins, to ensure that the data were free of errors [12].
In this phase, the quality of the data was verified, starting with the identification of missing values in the two data sets. Figure 2 shows the amount of missing data for each data set, in the case of meteorological data (Figure 2a). It can be observed that the variables minimum temperature, precipitation and relative humidity have 1, 1 and 2 missing values, respectively.
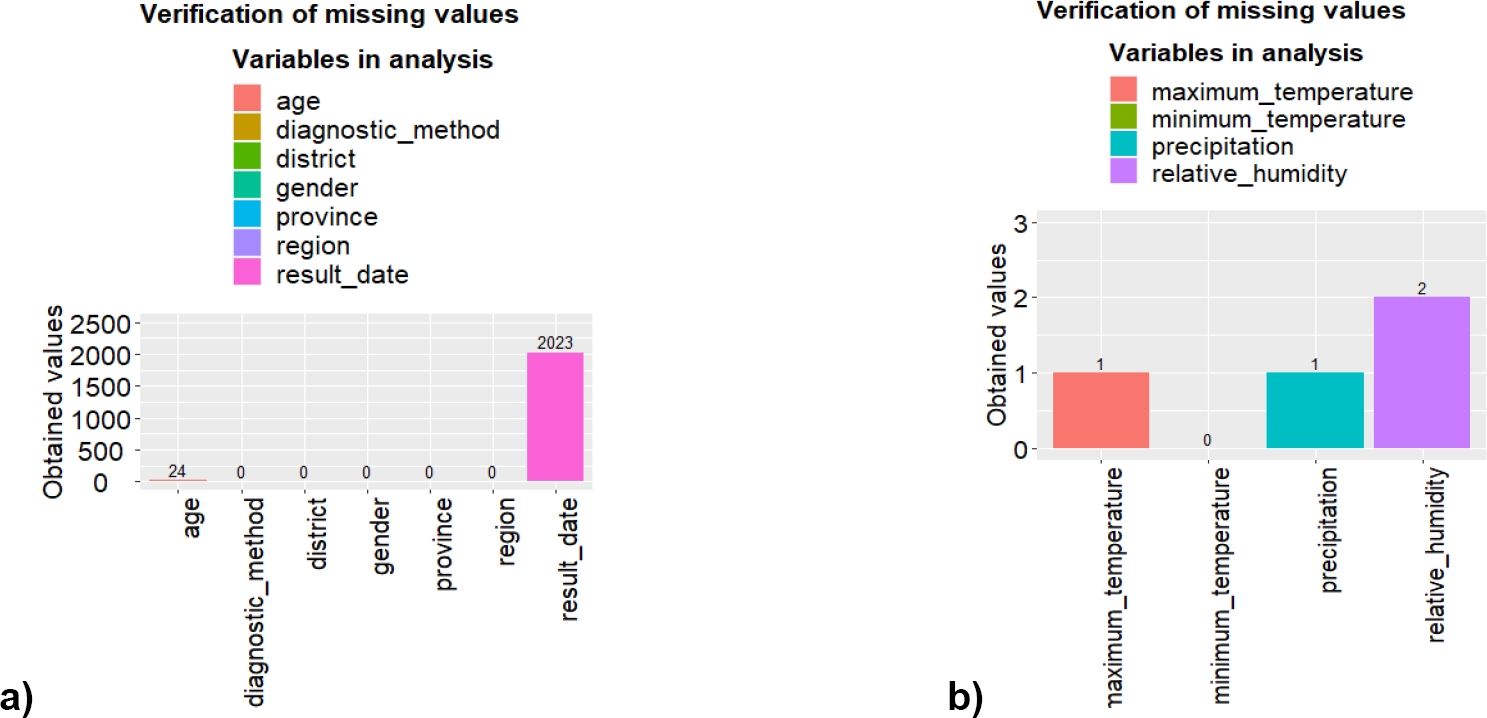
Fig. 2 (a) Amount of missing values in the meteorological data set. (b) Amount of missing values in the positive COVID-19 data set.
In case of the set of positive data for COVID-19 (Figure 2b), it can be observed that the variables age and date have 24 and 2023 missing values respectively, these values were imputed by their corresponding median, because these variables have extreme values (Figure 3a).
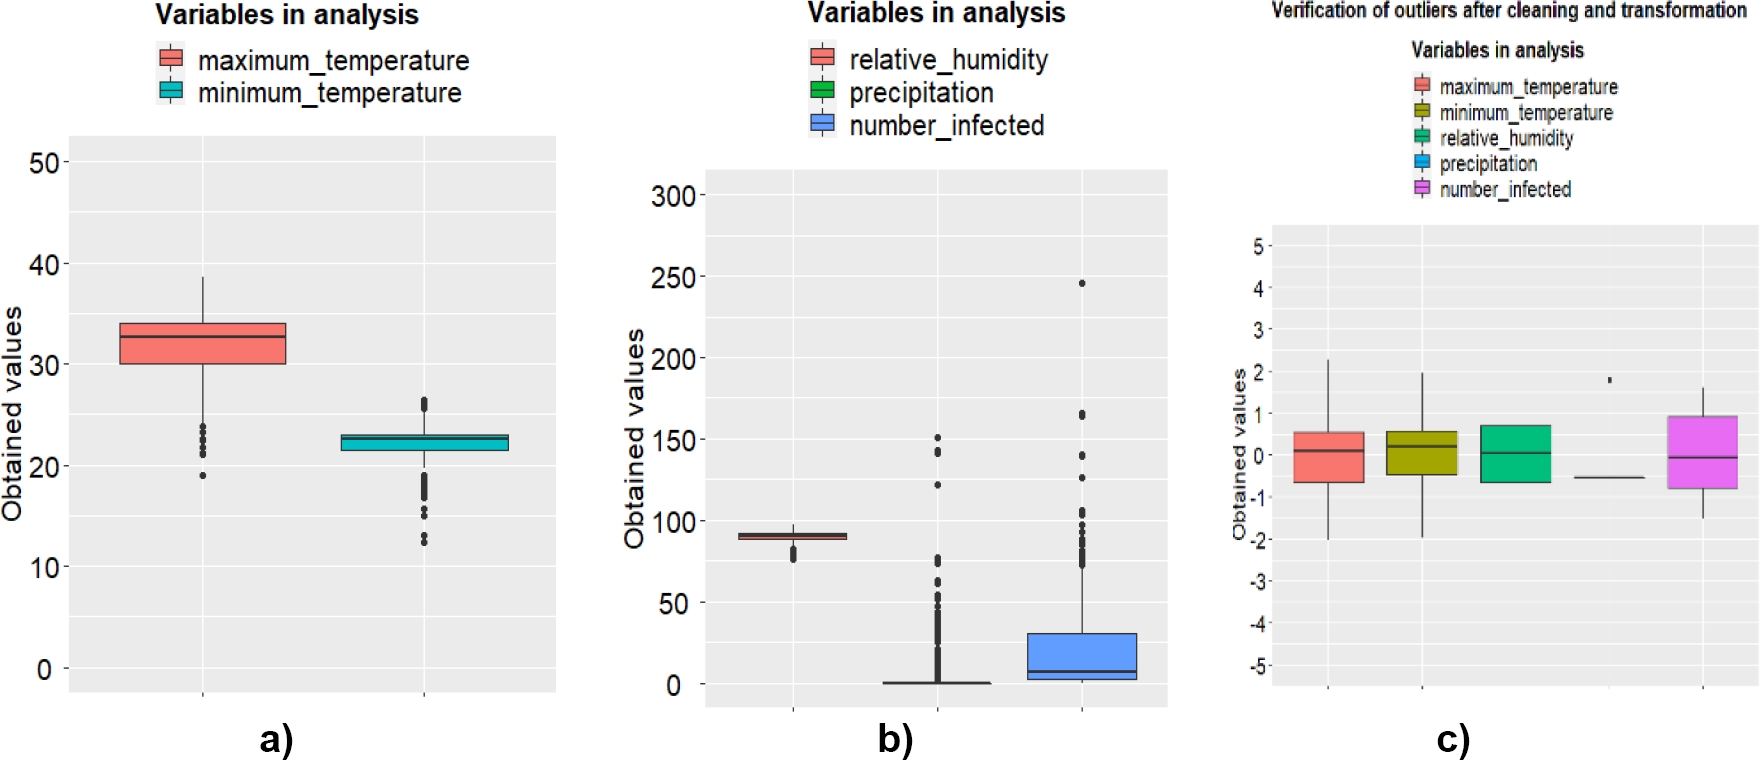
Fig. 3 (a) Verification of the outliers before processing. (b) Verification of the outliers before the processing treatment with Yeo-Johnson transformation
Since COVID-19 positive data, another subset was generated with information from the Tambopata province with the variables date of results and number of infected, this was possible by means of the functions filter(), group_by() and summarise() both from the library "dplyr" which is part of the R language, The next procedure was to join this subset with the meteorological data set by means of the function full_join() also belonging to the aforementioned package.
This resulted in a set of 365 rows and 6 columns representing the variables result date, maximum temperature, minimum temperature, relative humidity, precipitation and number of infected, which was used for the correlation analysis. Next, the extreme values were identified and treated.
Figure 3a shows that all the variables have extreme values, however, the variables precipitation and number of infected have very high extreme values
This is due to the fact that in the Madre de Dios region there are seasons with torrential rains, with respect to the variable number of infected, these extreme values are due to the maximum number of infections that occurred in the province of Tambopata during the study period.
In order to correct this, the imputation by the values of the 5th and 95th percentiles was applied to each of the variables.
It should be clarified that extreme values were considered to be those above 𝑄3 + 1.5 ∗ 𝐼𝑄𝑅 or below 𝑄3 − 1.5 ∗ 𝐼𝑄𝑅, being 𝑄1 and 𝑄3 the quartiles 1 and 3 respectively, 𝐼𝑄𝑅 = 𝑄3 − 𝑄1.
In addition, it was necessary to apply the Yeo-Johnson transformation using the yeojohnson() function found in the "bestNormalize" library of the R language for the purpose of centering and scaling the variables. Note the distribution of the data in figure 3b after this procedure.
3.3 Search of Relationships
The third step was to verify whether the data presented correctly, and it could be seen that the data was not uniform among themselves; it was necessary to transform them in order to stabilize them and reduce the distance between them; an alternative was sought to make them comparable, using the Johnson and Johnson method [13].
The procedures that were followed in this phase were as follows.
Normality Test
– The Shapiro-Wilks normality test was done. This test was chosen because it is one of the most powerful tests for all types of distribution and sample size [22]. The procedure followed is presented below:
Decision Rule
– p-value>alpha: H0 is not rejected (The variable under a study that presents a normal distribution).
– p-value<alpha: H0 is rejected (The variable under a study that does not have a normal distribution).
The results of the Shapiro-Wilks normality test are shown in Table 3. It shows that the p-value for all the variables of analysis is less than 0.05, indicating that none of them presents a normal distribution, therefore, to find the correlations the Spearman's nonparametric test was used.
Correlation Analysis
– Finally, Spearman's rank correlation coefficient was applied to detect the correlation between the number of SARS-CoV-2 infections and the environmental variables [14]. They were able to identify that minimum temperatures are related to the increase in the number of SARS-CoV-2 infections.
Spearman's nonparametric correlation test was applied to find possible relationships of each of the meteorological variables with the variable number of SARS-CoV-2 infections. The next stage shows the experiments carried out by taking into account a delay of 2, 3, 4, 4, 5, 6, 7, 7, 8, 9, 10, 11, 12, 13, 14 and 15 days for the variable number of infected by COVID-19.
In agreement with the results of the study carried out by [23], where they state that the median incubation period of SARS-Cov-2 virus was 4 days (interquartile range, 2 to 7) in 1099 patients with Covid-19, as well as [24] estimated a median incubation period of 5-6 days, with a range of 1 to 14 days.
4 Experiments and Results
Figure 4 shows the summary of the Spearman correlation plots. Each image corresponds to the results of the correlation experiments between meteorological variables and the number of SARS-CoV-2 infections with lags of 2, 3, 4, 5, 6, 7, 8, 9, 10, 11, 12, 13, 14 and 15 days.
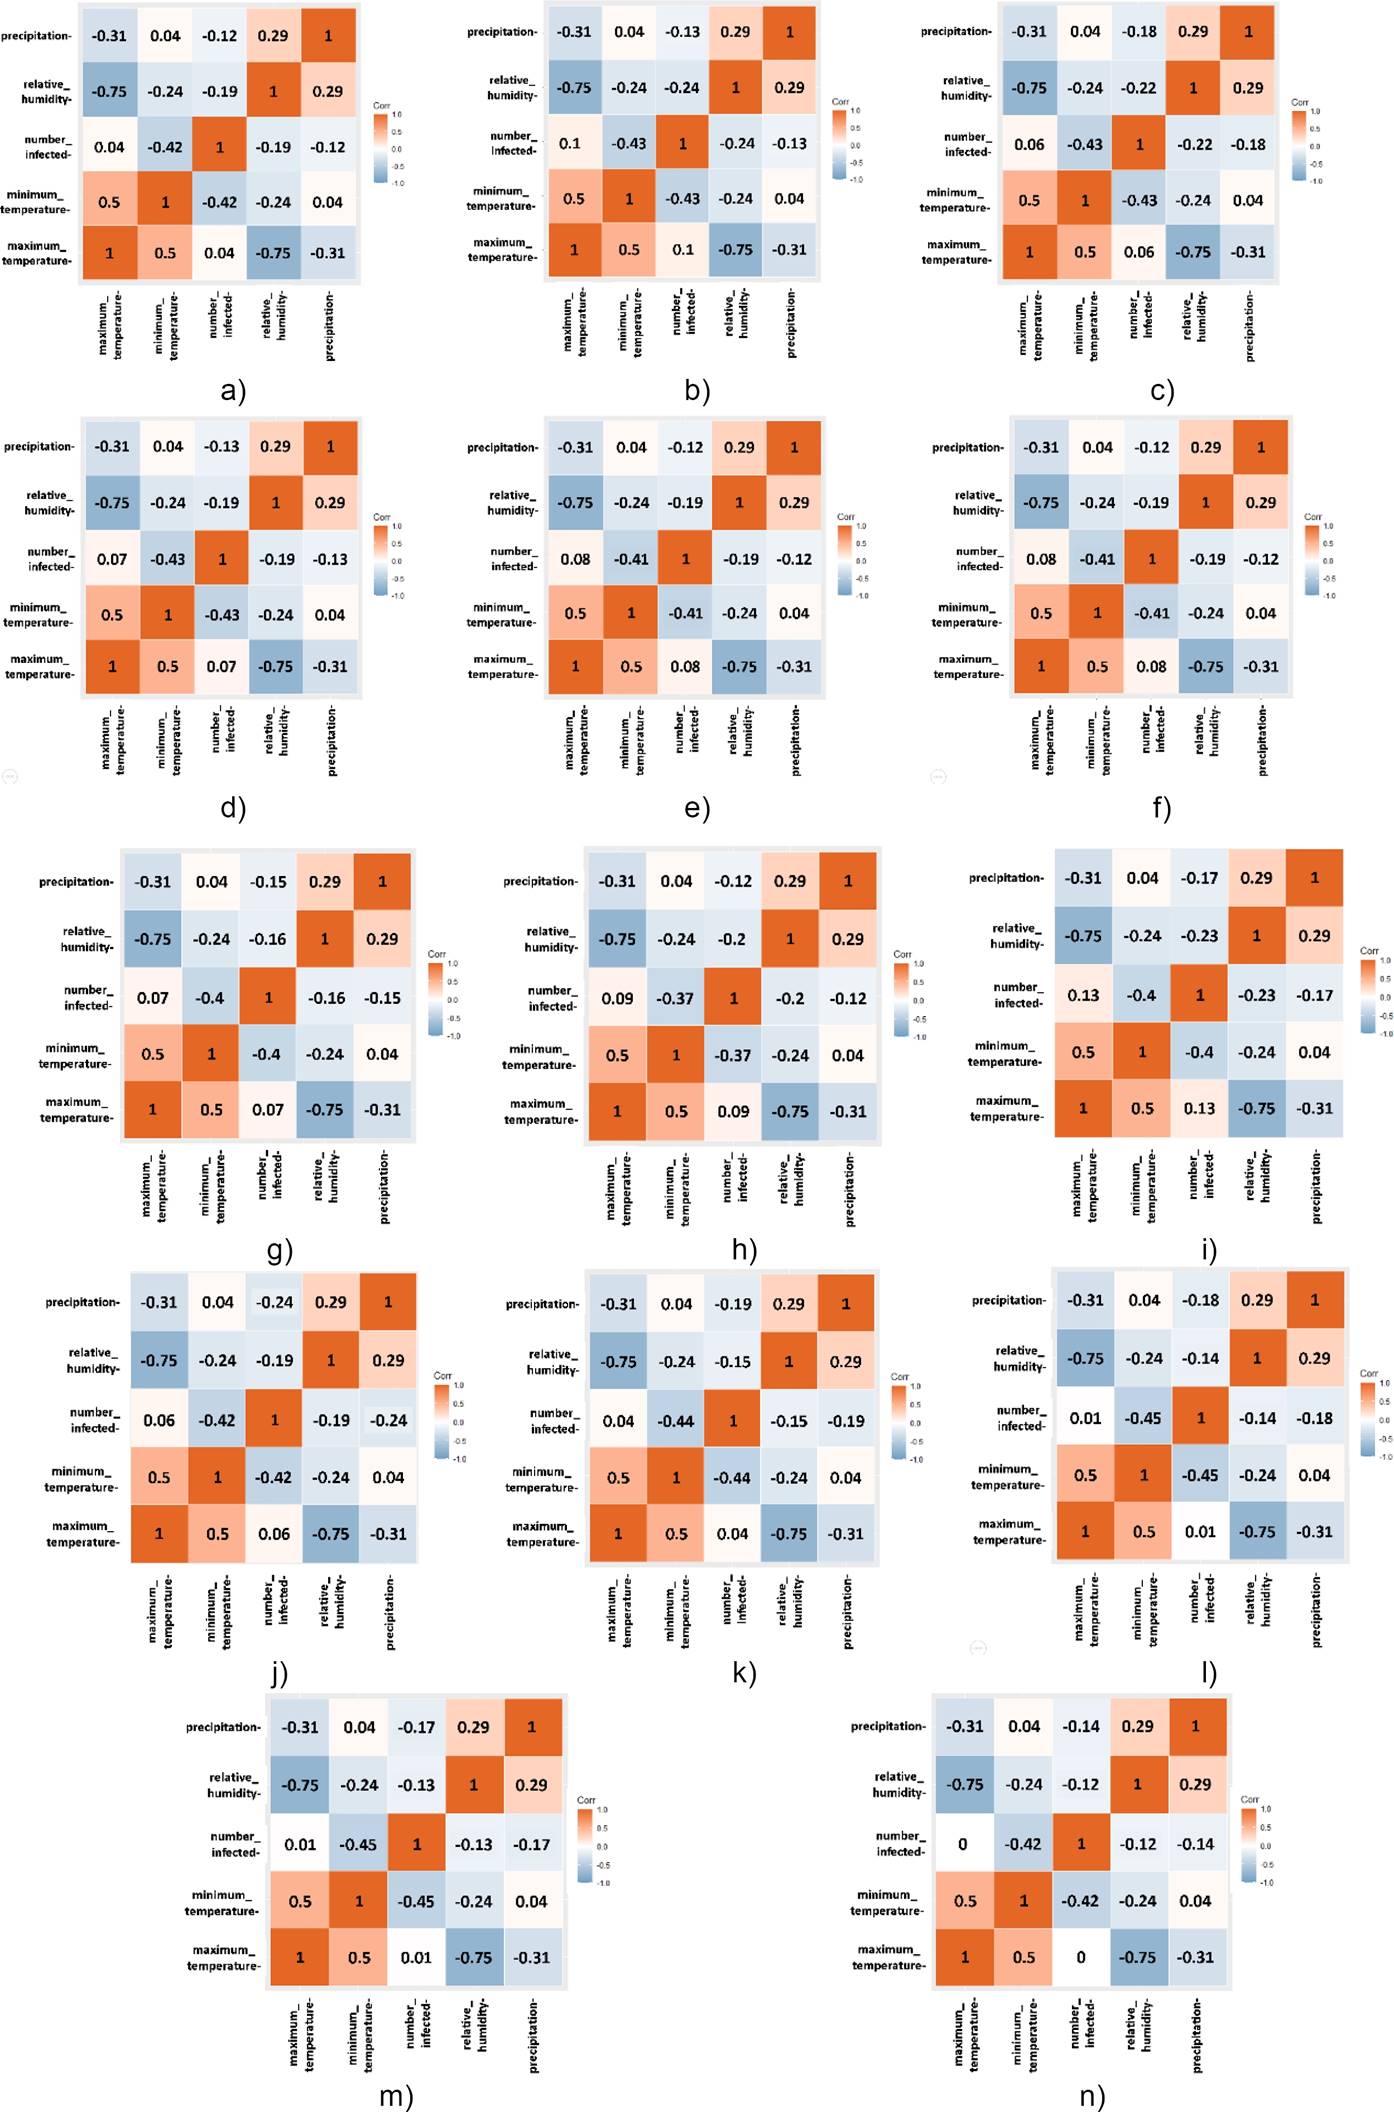
Fig. 4 Correlation among the meteorological variables and the variable of number of infections by SARS-CoV-2, with a delay of (a) 2 days, (b) 3 days, (c) 4 days, (d) 5 days, (e) 6 days, (f) 7 days, (g) 8 days, (h) 9 days, (i) 10 days, (j) 11 days, (k) 12 days, (l) 13 days, (m) 14 days and (n) 15 days
After applying the statistical test to the preprocessed data, correlation coefficients (rho) and statistical significances (p-value) were obtained between the meteorological variables and the variable number of SARS-CoV-2 infections. Table 4 shows in rows the correlation experiments performed for different values of lag days (from 2 to 15) for the variable number of SARS-CoV-2 infected with their respective rho and p-value values, and in columns the meteorological variables.
Table 4 Results obtained from the experiments with the Spearman correlation test
| Experiment | Days late | rho, p-valor | (°C ) maximum temperature | (°C) minimum temperature | (%) relative humidity | (mm/day)] Precipitation | number infected |
| 1 | 2 |
rho p-valor |
0,04 0,41 |
-0,42 0,00 |
-0,19 0,00 |
-0,12 0,03 |
1,00 - |
| 2 | 3 | rho p-valor |
0,10 0,06 |
-0,43 0,00 |
-0,24 0,00 |
-0,13 0,01 |
1,00 - |
| 3 | 4 |
rho p-valor |
0,06 0,23 |
-0,43 0,00 |
-0,22 0,00 |
-0,18 0,00 |
1,00 - |
| 4 | 5 | rho p-valor |
0,07 0,21 |
-0,43 0,00 |
-0,19 0,00 |
-0,13 0,01 |
1,00 - |
| 5 | 6 |
rho p-valor |
0,08 0,12 |
-0,41 0,00 |
-0,19 0,00 |
-0,12 0,02 |
1,00 - |
| 6 | 7 | rho p-valor |
0,08 0,13 |
-0,41 0,00 |
-0,19 0,00 |
-0,12 0,02 |
1,00 - |
| 7 | 8 |
rho p-valor |
0,07 0,20 |
-0,40 0,00 |
-0,16 0,00 |
-0,15 0,01 |
1,00 - |
| 8 | 9 | rho p-valor |
0,09 0,10 |
-0,37 0,00 |
-0,20 0,00 |
-0,12 0,02 |
1,00 - |
| 9 | 10 |
rho p-valor |
0,13 0,02 |
-0,40 0,00 |
-0,23 0,00 |
-0,17 0,00 |
1,00 - |
| 10 | 11 |
rho p-valor |
0,06 0,24 |
-0,42 0,00 |
-0,19 0,00 |
-0,24 0,00 |
1,00 - |
| 11 | 12 | rho p-valor |
0,04 0,43 |
-0,44 0,00 |
-0,15 0,00 |
-0,19 0,00 |
1,00 - |
| 12 | 13 |
rho p-valor |
0,01 0,84 |
-0,45 0,00 |
-0,14 0,01 |
-0,18 0,00 |
1,00 - |
| 13 | 14 | rho p-valor |
0,01 0,87 |
-0,45 0,00 |
-0,13 0,02 |
-0,17 0,00 |
1,00 - |
| 14 | 15 |
rho p-valor |
0,00 1,00 |
-0,42 0,00 |
-0,12 0,02 |
-0,14 0,01 |
1,00 - |
Of the 4 studied meteorological variables, 3 showed significant correlation with the number of SARS-CoV-2 infections. The most significant coefficient was obtained with the minimum temperature variable (rho=-0.45, p-value = 0.00<0.05) corresponding to the experiments with 13 and 14 days of delay. In relation to the relative humidity variable the most significant value (rho=-0.24, p-value=0.00<0.05) was obtained for 3 days of delay of the variable in question. Finally, the precipitation variable achieve his most significant value (rho=-0.24, p-value = 0.00<0.05) for the experiment with 11 days of delay.
5 Conclusions
In this research, the existence of a correlation between the level of SARS-CoV-2 infection and environmental factors was verified. For this purpose, data mining was used. The R programming language allowed the collection, exploration and preprocessing of the data, in order to find possible relationships between the meteorological variables maximum temperature, minimum temperature, relative humidity, precipitation and the number of SARS-CoV-2 infections.
In the data exploration and preprocessing stage, the presence of extreme values was observed in all the variables; to correct this, imputation by the 5th percentile was used for those values below 𝑄1 − 1.5 ∗ 𝐼𝑄𝑅 and by the 95th percentile for those values above 𝑄3 + 1.5 ∗ 𝐼𝑄𝑅, in addition to which it was necessary to apply the Yeo-Johnson transformation implemented in the R library "bestNormalize" to center and scale the variables.
The most significant results show a moderate negative correlation (rho=-0.45, p-value = 0.00 < 0.05) between minimum temperature and the number of SARS-CoV-2 infections. Thus demonstrating that minimum temperatures are related to the increase in the number of SARS-CoV-2 infections.

