


 text new page (beta)
 English (pdf)
 Article in xml format
 Article references
 Send this article by e-mail
 Cited by SciELO
  Similars in
SciELO
Similars in
SciELO 
 Permalink
1 Introduction
Microblogging platforms have become an interesting and fast way to share and consume information of interest on the Web in real-time. For instance, in recent years, Twitter (http://twitter.com) has emerged as an important source of real-time information exchange platform. It has empowered citizens, companies, marketers to act as content generators, that is, people share information about what they experience, eyewitness, and observe about topics from a wide range of fields such as epidemics, disasters, elections and more. This allows users not only to be consumers of the information, but prosumers of the information, where the information is produced by themselves.
To consume information, Twitter users follow other users who they think can provide useful information of their interest. Information shared on Twitter in the form of short text messages (\tweets") immediately propagated to followers, and implicitly starts a one-way conversation, which is also known as social interaction [1]. Often such conversations turn in two-way when followers reply back. Further spread of the information happens when followers post the received information to their followers (i.e., re tweeting).
Social interaction on social media has a resemblance to social interaction that one practices in daily routine. For instance, companies leverage insights from social media information to better market to its customers and increase sales. In this case, companies always seek to gain more in-depth information of their customers for better understanding and to improve interaction with them despite it is one-to-one, through a phone call, or on social media.
Moreover, understanding the types of users on social media is important for many reasons. For example, this includes detecting bots or spam users [2], recommending friends (e.g., potential users to follow on twitter) [3], finding credible information and users [4], for example, to receive trusted analysis or feedback of products or to ask questions to fulfill information needs [5], and so on.
In recent years, Twitter has been extensively used in a number of research studies that analyze and process mainly tweets content using different natural language processing (NLP) techniques to differentiate Twitter users [6]. Moreover, many studies focus on aspects like, who follows whom, who is in which list, etc. However, understanding the types of twitter users using their tweeting behavior or, more important, what their profile information reflects, is an aspect which is broadly overlooked. Twitter profiles provide useful information, furthermore determining various behavioral aspects of users on Twitter such as how often they post, re-tweet, or reply could provide significant insights about users.
In this paper, we study Twitter from a different perspective, that is, we visualize Twitter users into different forms by exploiting their profiles and tweeting behavior information. Validation of our hypothesis is conducted by performing a visualization Treemap technique. Finally, we claim that the proposed approach can effectively visualize users profile helping to discover patterns and clustering similar Twitter users.
Rest of the paper is organized as follows. In the next section, a related work is presented, then, in section 3 we discuss the concepts of Twitter profile and the visualization technique used. Based on that, we present in section 4 the methodology used in this research and some technological tools are explored. In section 5, we report the results of our experimentation. Finally, we conclude the paper in section 6.
2 Related Work
Analyzing users and their behavior on online social networks has been the subject of many previous works [7, 8, 9]. The particular domain of the Twitter microblogging service has not been an exception. By looking at the contents produced by users, or at the actions they perform, researchers have been able to derive user characterizations and other useful information, with the goal of, for example, doing sentiment analysis [10] or predicting the diffusion of information [11].
An example is the work of Chu et al. [12], where they observe the differences between human users and what they designate as bot and cyborg users. The authors characterize a bot as a user whose actions are all automatic, i.e. without any human intervention.
In a similar manner, Java et al. propose a taxonomy of user intentions on Twitter [13]. To achieve this, users were manually categorized according to their link structure and tweet contents. Based on link structure, three main categories of users where identified:
(1) Information sources, i.e., a user that can be seen as a hub and has a large number of followers;
(2) Friends, where most of users belong to, forming social networks of friends, family, co-workers, among others; and
(3) Information Seekers, i.e., users that post very few times, but follow other users, thus regarding Twitter mostly as a source of information.
Tweeting behavior, network structure, and the linguistic content were used by Pennacchiotti et al. to infer the political orientation and ethnicity of users [14]. They show that network features perform well when used to classify user political orientation. According to the authors, this occurs due to the interaction between users and media or personalities with an established Twitter presence.
While still trying to classify Twitter users, other researchers have focused on a different set of characteristics, namely, the user’s ability to influence others or to divulge information. Cha et al., for instance, define three types of influence on Twitter: Indegree, Retweet and Mention [15]. Indegree influence regards the user’s popularity, and is measured by the number of followers. Retweet influence regards the tendency of the user’s audience to retweet her posts, and is measured as the total number of retweets. Mention influence regards the likelihood that the user will be mentioned in other users’ posts, and is measured by the number of times the @username tag occurs within tweets.
In other work, Petrovic et al. [16] conducted an experiment showing that humans can predict which tweets will be retweeted, just by looking at tweet content. These results were then compared to those of an automatic classifier, which uses social features and content features to automatically predict retweets.
Social features include the number of followers, friends, user status, favorite tweets, number of times the user appears in other users’ lists, if the user’s language is English and whether the user is verified. If the identity of a user is susceptible of being confused with other users (e.g., Obama) then it needs to get verified.
The features that proved to have better results in predicting retweets were the number of followers and presence in user lists. The authors show that tweets written by verified users have a higher probability of being retweeted. This is the case of most celebrities, who thus have more ability to diffuse content and cause more retweet chains.
All work described so far concerns Twitter. Gomez-Rodriguez et al. [17] developed a method to trace diffusion and influence paths through the network on a dataset of MemeTracker. In this work, the authors try to infer the network based on recurrent patterns of diffusion between different nodes, i.e. if node A and B always have a similar text with different timestamps, then there is a possible edge between node A and B. Moreover, authors do not observe the content of diffused posts, but they cluster a set of phrases to aggregate different phrase variants instead.
Since users do not influence all their neighbors in the same way, it is possible to use this methodology to infer the real patterns of interaction between users and their neighbors, i.e. instead of doing an analysis based on user network connections, one should focus on the result of the interactions between a user and the surrounding neighborhood to study user behavior.
3 Tweeting Behavior and Treemaps
Twitter users can be analyzed based on their profiles, posts, and tweeting behavior. Users' profiles exhibit an extensive set of informational pieces, users' posts represent rich content (i.e., tweets) often used to perform NLP based analysis, and users' tweeting behavior represents different aspects related to a user's interaction with the platform as well as with other users (e.g., followers). In figure 1 we show a partial view of the information that can be obtained from Twitter about a user. The figure shows a meta-data part (i.e., profile specific information, followers, and friends), and a content part (i.e., tweets). To identify Twitter users into different classes, we exploit users' profile and their tweeting behavior.

Users on Twitter can be anyone. These users can be classified into two broad categories, which are, (i) real-users, (ii) digital-actors. Real-users represent human-beings (e.g., home users, business users, or professional users), and digital-actors represent automated computer programs (e.g., bots, online services, etc). Both types of user built their profiles on Twitter by specifying information such as name, website, description, bio, etc. Other information such as created at, status count, listed count that a twitter profile contains automatically provided or manipulated by Twitter platform and it tends to change over time (e.g., number of followers change over time, listed count change over time).
In general, tweets posted by users are publicly available and are followed by subscribers called followers. Users who share particular interests are included in one's reading list.
A profile's listed count is the number of users whose reading lists contain the profile's tweets.
In other hand, treemaps are a space-filling graph visualization technique first introduced in [18]. An important feature of treemaps is that they make very efficient use of display space. Thus it is possible to display large trees with many hierarchical levels in a minimal amount of space. In figure 2a shows a sample tree structure and in figure 2b shows the corresponding treemap.

The algorithm used to partition the display space is known as the “slice-and-dice algorithm" and functions like a k-d tree space partition. The positioning of tree nodes in a treemap is a recursive process.
First, the children of the root are placed across the display area horizontally, where each node's area is directly proportional to its weight. Then, for each node n already displayed, each of n's children is placed across vertically within n's display area. This process is repeated, alternating between horizontal and vertical placement until all nodes have been displayed.
Treemaps can be especially helpful when dealing with large clustered graphs. When viewing a graph at some level of abstraction, the viewer is really looking at nodes belonging to some level in the cluster tree. A treemap can display the whole structure of a cluster tree, thus allowing the user to place the current view in context.
In the standard treemap of Shneiderman [18] the nodes are represented as rectangles of various shapes. This makes a visual comparison of their importance (as determined by area) difficult, especially as the rectangles vary in orientation as well. In squarified treemaps [19] the aspect ratio (the ratio between the width and height of a rectangle) is taken into account when placing nodes in the treemap. The resulting treemaps contains squarish elements, making it easier to visually compare their areas.
Squarified treemaps with a modified visual appearance are implemented in the prototype visualization system. In traditional treemaps, only the leaf nodes of a tree are displayed as rectangular areas. It is often difficult to determine the nesting depth of the treemap structure.
4 Methodology and Selected Features
Twitter provides us information through its official API in JSON (Java Script Object Notation) format, that in general terms we obtain is simply text, which by its nature does not allow a comparative analysis in large amount of data, on the other hand there are variables difficult to identify without any visual tool. Using the Twitter API, we have the information generated by the user when a tweet is published, this by itself provides us a lot of information. Also, we have the option to extract a dataset limited to 200 tweets that have been published or republished (retweet) by a specific user. The information extracted is cited in figure 3.

Then we created a web application in order to visualize using treemaps of all different users. We identify the steps that the web application will carry out:
Twitter Username has to be inserted on the application.
The application will connect to through the API and extract tweets from the Twitter account.
Each of the tweets will be analyzed and the important data is grouped sharing similar characteristics.
The system will create a hierarchical structure (tree) where they will be grouped the different data.
A treemap is created using these hierarchical structure.
Having these steps, the frontend and the backend can be distinguishing.
The frontend will be the part that interacts with the user of the web application, while backend will be the processing information and the creation of the hierarchical structure. Technologies like HTML, CSS, Java Script, Reactjs, VueJS and Angular was used to implement the web application. To identify Twitter profiles into the defined groups, we choose 16 features as summarized below. These features include a few trivial ones, which can be easily obtained from profiles, for example, statistical features like # of tweets, # of replies, followers, etc. However, some of the selected features are derived like Answer with hashtag and mentions or Retweets with mention, etc.
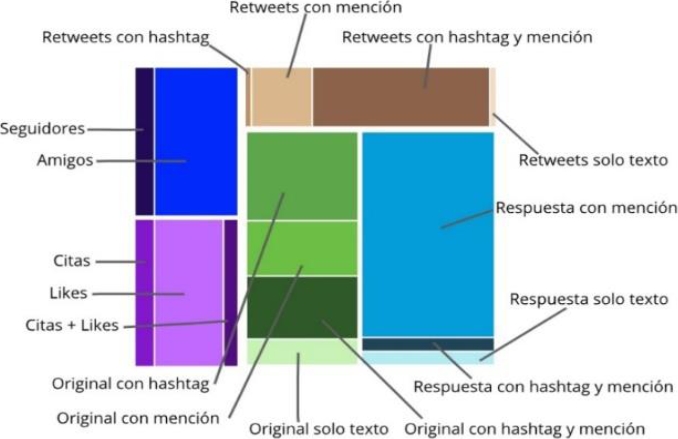
The selected features are: followers, friends, # of likes, original tweet having a hashtag, original tweet having a mention, original tweet having only text, original tweet having hashtag and mention, answer having a mention, answer having only text, answer having a hashtag and a mention, retweet having a hashtag, retweet with a mention, retweet having a hashtag and a mention, retweet having only text.
All these information is then analyzed in order to create the hierarchical structure and the treemap. In figure 4 a treemap with all these features is shown.
5 Experiments
Some case of study was conducted in order to verify the accuracy of the visualization and to identify some different user’s profiles using the web application.
In the first case the president of Mexico, Andrés Manuel López Obrador was analyzed. The tweeter account is @LopezObrador_. A treemap with all information was created and is shown in figure 5.
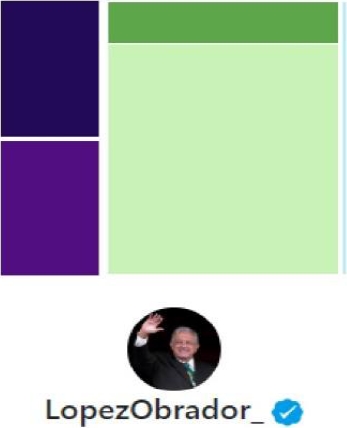
In this case, the account was verified by Twitter and the number of Tweets obtained was 200, with this specific user there is impossible to analyze his community since the answering section number is very short, this is because the user doesn’t answer using this account (light blue). In the interaction analysis is the similar case, since cited tweet and followers are more than 99% of Tweets with interaction (navy blue), on the other hand in the Tweets section we can see that there are no Retweets or they are less than 1% of the total tweets, in this very particular case we can see that the Original Tweets (light green) is very important because the user, @LopezObrador_, publishes a lot and has a very small number of responses.
This information could be interpreted as an account that seeks to spread a message, clearly someone relevant in the political context but it doesn’t interact with other accounts.
In the next case, it was decided to use the “small multiples” technique to compare different user profiles at the same time. All users are Mexicans politicians and some recognized journalist. Figure 6 shows this Treemap.
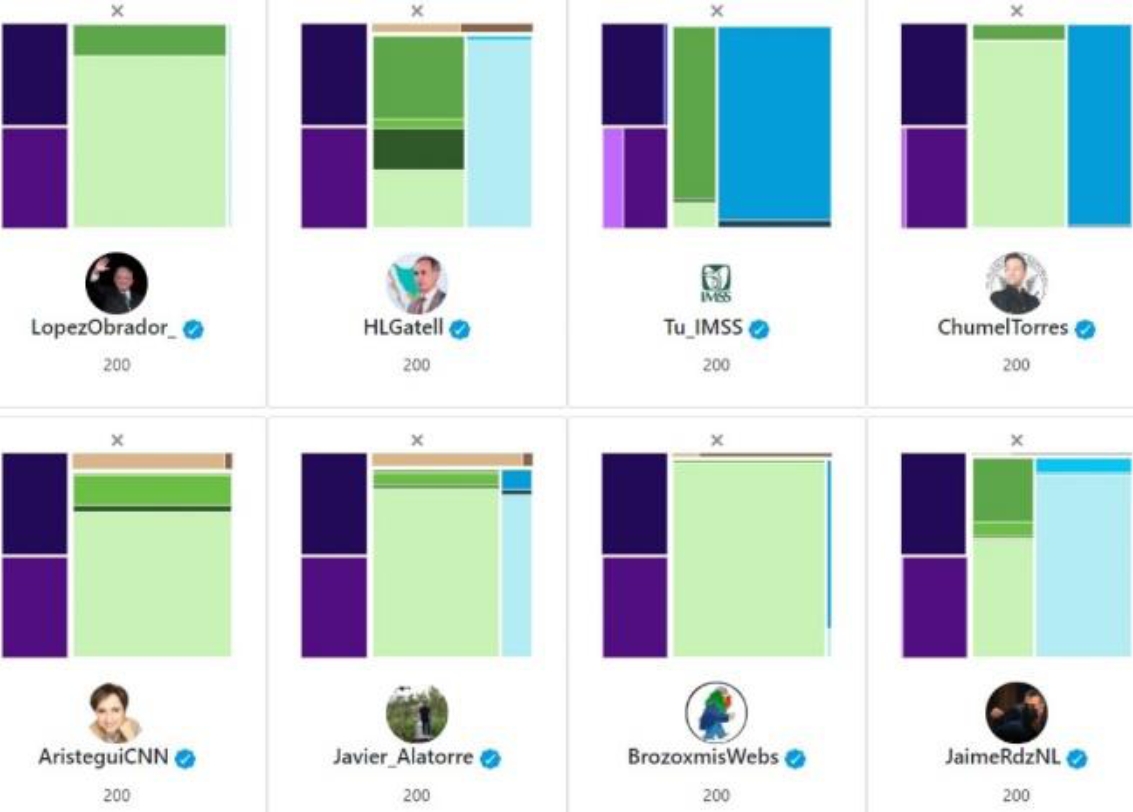
Some similarities can be found regarding all different users, for example the @HLGatell and @JaimeRdzNL are very similar. Both users are politicians and had a lot on interaction with other accounts (light blue) because they have a lot of answers. In the case of @AristeguiCNN and @Javier_Alatorre, (both journalist), show a similar profile with the Retweet section (light brown). In the other hand, comparing @LopezObrador_ and @BrozoxmisWebs, although they are two completely different characters (politician and journalist), their profiles are very similar, which shows that they behave very similarly in the social network.
Finally, in other completely different context, we analyzed 12 profiles of football teams in the Mexican soccer league (figure 7), here we can notice clearly a regular pattern and we can start grouping different profiles like the users @ClubLeonFC and @ClubPueblaMx or even @Xolos, @TolucaFC and @Atlas.
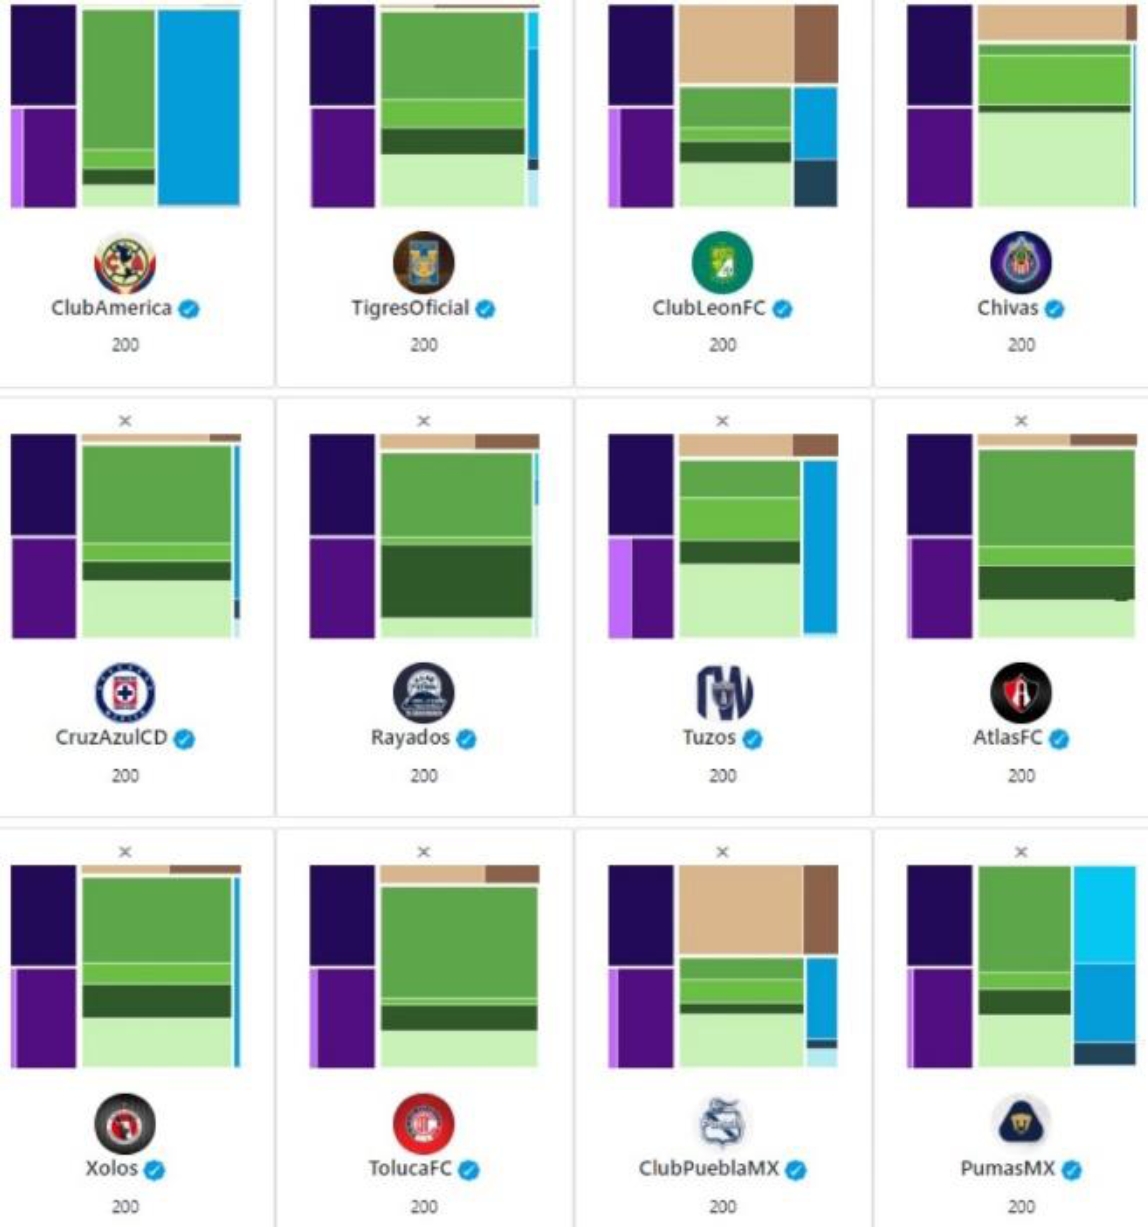
It is important to notice that all this profile clustering and profile identification is due to the Treemap visualization, demonstrating that the Treemap can be a very powerful visualization technique.
6 Conclusions
Twitter is a famous microblogging platform used by companies, businesses, professionals, and also by home users in their daily routine to disseminate information online in real-time. Twitter users exhibit different characteristics that distinguish one user from others. Understanding Twitter users is important for many reasons such as for companies to plan their marketing campaigns differently for different types of users.
In this paper we proposed a set of features that allow us to characterize and distinguish user activity patterns on Twitter using a treemaps as a visualization tool. Through the analysis of diffusion patterns we are able to infer different kind user behavior. Our approach uses a lot of information from the user profile.
We explored the treemap visualization and demonstrate that can be very interesting tool to identify automatically some user’s profiles. Also the “small multiples” technique has been used to compare different user’s profile.
A future work will be the user classification using this automatic visualization, only a manual verification and classification has been made in this work. Automatic clustering will be a priority to continue with this work.
Also, in future we want to combine this approach with other features to detect spammers. Spammers on Twitter tend to do many posts with similar text and URLs, and since normal users are able to detect a spammer and ignore her posts, it is expectable that few retweet and network chains are generated by this type of users.
Moreover, we want to include user profile and content features. Profile features can help to contextualize user behavior, e.g. it may be possible to detect different behavior depending on the geographic localization of users. Content features can help to understand how different behavior can be generated based on what and how users write.

