


 nueva página del texto (beta)
 Inglés (pdf)
 Artículo en XML
 Referencias del artículo
 Enviar artículo por email
 Citado por SciELO
  Similares en
SciELO
Similares en
SciELO 
 Permalink
1 Introduction
News allow people to learn about relevant events that occur every day. Throughout time, several means of information have been used to transmit them, but today the most widely used is the Internet [5]. The importance and impact that news has on society cannot be denied, an example can be seen in the United States elections in 2016, where fake news about Hilary Clinton were spread [4], and this influenced voters. Considering this impact and the large amount of information available on the Internet, the automation of news analysis processes has attracted a great deal of interest; however, doing it manually is time consuming and laborious.
There is extensive work focused on news and most of the research has used a set of documents previously identified as news. The task of identifying news from a set of documents in which other documents are not news is costly in terms of time and effort. Given the large number of documents currently published on the Internet, it is very important to have an automatic method to identify news and separate them from other documents, helping to create data sets more easily and quickly. It is important to mention that, to our knowledge, work related to this particular task is scarce and this is even more evident when it is addressed from approaches other than supervised.
Considering the limited work done in news identification and the problem of manually annotating large dataset, in this work we propose to use a semi-supervised approach for this task.
The semi-supervised learning is compared to human learning in that few examples can be used to learn and generalize [19]. The advantage of following this approach is that when a limited amount of labeled data is available, the use of this data can be optimized and complemented with unlabeled data to learn from it.
2 Related Work
The problem of news detection was addressed in [10]. The authors used a set of 2,000 Twitter users known to post news as a data source, as well as two services to access tweets from other Twitter users posting on different topics. To separate news from not news a Naive Bayes classifier was used with bag of words as feature representation. Once a tweet is classified as news, an online clustering algorithm is applied to group the tweet according to its topic, TF·IDF and cosine similarity measure were used to create the clusters.
A similar approach was followed in [9]. In this work the authors propose a method to collect, group, sort and track news on Twitter. In order to identify news in tweets, they analyzed the features of these, collecting 121,000 tweets from any user and 33,000 from a select group of 250 users previously identified as news contributors on Twitter. They extracted the following features from the set of documents:
The authors identified whether the tweet was related to the news and topic through hashtags and through external links further information was obtained. Using the number of retweets a tweet had, the authors estimated the importance or relevance of that tweet (the more retweets, the more relevant); interactions between users was addressed using hashtags. Named Entity Recognition [11] and Conditional Random Fields were also used to obtain information from documents.
The aforementioned proposals focuses only on tweets, so it cannot be used with other types of documents extracted from the Internet since it relies heavily on features such as users that post the data, hashtags, number of retweets, among others that can only be found in tweets.
In contrast, the solution proposed in this project can be applied to any type of document extracted from the Internet regardless of its length or platform where it is located.
Although both proposals perform an analysis of news features, the methodology of our proposal is different, since it relies on automatically generated pseudo tags for learning, in addition to the fact that the selected features, as already mentioned, can be found in any text.
In general news categorization relies on supervised learning [1, 8, 3, 18] which, again, requires great amounts of manually tagged data. Building this resource is expensive, or might be unfeasible in some situations—for example some news media that include information other than news. In [6], regular expressions were used to extract non-news items such as advertisements, links to other news articles, photos, and videos from three news websites.
The authors analyzed the HTML documents and created a content pattern to extract the news text article and a filter pattern to remove non-news items. This kind of methods can be used when these elements are clearly separated from the rest of the content, but in particular advertising has evolved to be less obvious and more intrusive. In [13] the authors mention that it is difficult for readers to determine whether a document is related to advertising or not. Our work also includes documents that are advertisements and the proposed method was used to differentiate them from those that are news.
3 Development
Documents for identifying and classifying news were provided by Telegram1 as HTML files. From there, raw texts were extracted.
1,000 documents were randomly selected and manually tagged with a news or non-news label. The tagging process was performed by two people who reviewed the content of the documents and based on the characteristics described in section 3.1.1 determined whether they were news or not. Documents labeled as news were assigned an additional label indicating to which category they belonged from those listed in Section 3.4, this process was performed by the same people based on the content of the news. We have two important sets: the development set and the validation set. Within the 1,000 labeled documents, 790 were news and the remaining 210 were non-news, so the dataset was unbalanced. Because of the problems with unbalanced sets, we decided to use undersampling [2] to create a new balanced dataset. This new set is formed with the 210 non-news documents and another 210 randomly selected news documents; of these 420 documents we used 360 for the development set and the rest will be used as the validation set.
Features of the texts were identified and analyzed, making use of Named Entities; then several experiments were carried out on the analyzed features without the help of a labeled data set, namely: unsupervised learning [7], and supervised learning: using models such as Logistic Regression [15] or Decision Trees [7] where it is possible to know which features were most important for learning. Features to be used were selected, and finally the classification was carried out with semi-supervised learning, using the SelfTraining model [16] based on Logistic Regression with Stochastic Descending Gradient.
This proposal can be generalized to any type of document, and it is also hypothesized that the number of Named Entities (who, where and when) can help differentiate news from other texts. There is also the use of automatically generated pseudo tags, which help to improve performance.
The performance of this method will be evaluated using standard evaluation metrics for classification problems: recall, precision, accuracy, and F score.
With the objective of profiting from a semi-supervised approach, first we sought to determinate the efficiency of certain simple heuristics; then we verified the performance of a supervised classifier, to finally improve the its performance through automatic pseudo-labeling techniques.
3.1 Rule-based Classification
First we show the experiments results using simple rule-based classification. We carry out tree types of experiments: for the first one our goal was to attest the existence of basic features in the text; then, we experimented with their frequency, and finally we considered the document’s subjectivity.
3.1.1 Basic Features
Based on the feature analysis, we based our first experiments on the following hypothesis: News always has who, where and when elements, therefore if we can extract these features from a document using Named Entity Recognition, then the document can be considered a news document. This hypothesis was tested in Experiment 1. Named Entities were obtained using SpaCy2, which have obtained competitive results (around 60% F1) compared to similar tools [12]. Despite the possible errors in NER, the identified entities proved to be useful in our experiments as is shown in the following sections. Additionally, we tested using only who and where in Experiment 2. Results are shown in Table 1.
3.1.2 Split based on the Average of the Basic Features Sets
Feature analysis showed that non-news have more Named Entities recognized as who, where and when: 100 documents were tagged as news and a 100 as non-news; from them we extracted the Named Entities corresponding to who, where and when and the average of the number of them. Results are shown in Table 2.
Table 2 Averages of who, when and where values for non-news documents
| News | Other | |
| who | 14.63 | 21.25 |
| where | 3.98 | 7.36 |
| when | 6.52 | 9.89 |
Two experiments were made under this premise: in Experiment 3, a document was considered news if the number of all Named Entities extracted belonging to the groups who, where and when was less than their corresponding averages in the non-news documents—for both experiments if a Named Entity appears two or more times it was counted once. As an example consider the following.
Suppose a document has 10 who, 8 where and 9 when. 10 is less than 21.25 (the average of who in non-news) and 8 is less than the average of when, 9.89, but 9 is greater than the average of when (7.36 is the average of when in non-news), thus the document is identified as a non-news document. If the number of identified where would have been, say, 4 (that is less than 7.36) the document would have been identified as news.
For Experiment 4, a document was considered as news if at least two quantities were less than their corresponding average of the non-news. Following our previous example of a document that has 10 who, 8 where and 9 when: 10 is less than 21.25 (the average of who in non-news); 8 less than the average of when (9.89), but 9 is greater than the average of when (7.36): in this case the document is identified as news, even if one of the quantity is greater than its corresponding average in non-news.
3.1.3 Classification based on the Subjectivity of a Document
Another important feature in news documents is the objectivity—a news document has to be as objective as possible, therefore, other experiments were performed considering this feature, making use of a TextBlob tool3, which evaluates the subjectivity value of a text. For Experiment 5 a document was identified as news if its subjectivity value was smaller that the calculated average of the non-news documents. Finally, we integrated features from Experiment 1 with Experiment 5 into Experiment 6, that is, if we can extract, through Named Entity Recognition, who, where and when and the subjectivity value is less than the average of non-news documents, the document is identified as news. Results are shown in Table 4.
Table 3 Results of experiments 3 and 4
| Recall | Precision | Accuracy | F score | |
| Experiment 3 | 0.44 | 0.57 | 0.56 | 0.49 |
| Experiment 4 | 0.75 | 0.57 | 0.59 | 0.64 |
3.2 Supervised Learning
Previous experiments allowed us to have an idea of the performance some simple heuristics can achieve for this problem. For supervised classification, we used classic features such as bag of words [17]. We used the following supervised classifiers: Logistic Regression and Decision Trees, which showed that Logistic Regression works better with binary representation and Decision Trees with frequency (count) representation. All the experiments that follow were done with these configurations (See Appendix A for details on other configurations.)
3.2.1 Selection of Features to Use
For experiment 7, two classifiers were used: Logistic Regression (LR) and Decision Trees (DT), using a bag of words representation. Additional to the bag of words we added features corresponding to the number of Named Entities found for who, where and when, along with the subjectivity value described in Section 3.1.3. In order to determine the individual contribution of each added feature, we separately concatenated them to the bag of words. Results are shown in Table 5. In this table features are represented with numbers: (1) Who; (2) Where; (3) When; and (4) Subjectivity. For example, the first row shows results for the LR classifier with bag of words + the number of named entities found for who, while the last row shows results for the DT classifier with bag of words + the subjectivity value. Experiment 8 will show results for combination of these features, see Tables 6 and 7.
Table 5 Results of Experiment 7. Features are (1) Who (2) Where (3) When and (4) Subjectivity
| Model | Feat. | Recall | Precision | Accuracy | F score |
| LR | 1 | 0.8352 | 0.7714 | 0.7861 | 0.8005 |
| 2 | 0.8538 | 0.7709 | 0.7916 | 0.8090 | |
| 3 | 0.8467 | 0.7735 | 0.7916 | 0.8068 | |
| 4 | 0.8467 | 0.7698 | 0.7888 | 0.8046 | |
| DT | 1 | 0.7293 | 0.6731 | 0.6777 | 0.6960 |
| 2 | 0.7408 | 0.6811 | 0.6888 | 0.7061 | |
| 3 | 0.7581 | 0.6714 | 0.6888 | 0.7095 | |
| 4 | 0.7225 | 0.6828 | 0.6888 | 0.7101 |
Table 6 Results of Experiment 8. LR: Logistic Regression with binary bag of words. Numbers represent added features (1) Who (2) Where (3) When and (4) Subjectivity
| Features | Recall | Precision | Accuracy | F score |
| 1,2 | 0.842 | 0.777 | 0.791 | 0.806 |
| 1,3 | 0.835 | 0.771 | 0.786 | 0.800 |
| 1,4 | 0.835 | 0.771 | 0.786 | 0.800 |
| 2,3 | 0.853 | 0.770 | 0.791 | 0.809 |
| 2,4 | 0.853 | 0.770 | 0.791 | 0.809 |
| 3,4 | 0.846 | 0.773 | 0.791 | 0.806 |
| 1,2,3 | 0.838 | 0.773 | 0.786 | 0.802 |
| 1,2,4 | 0.842 | 0.777 | 0.791 | 0.806 |
| 1,3,4 | 0.835 | 0.771 | 0.786 | 0.800 |
| 2,3,4 | 0.853 | 0.770 | 0.791 | 0.809 |
| 1,2,3,4 | 0.838 | 0.773 | 0.786 | 0.802 |
Table 7 Results of Experiment 8. DT: Decision Tree with frequency bag of words. Numbers represent added features (1) Who (2) Where (3) When and (4) Subjectivity
| Features | Recall | Precision | Accuracy | F score |
| 1,2 | 0.724 | 0.699 | 0.702 | 0.708 |
| 1,3 | 0.760 | 0.677 | 0.697 | 0.713 |
| 1,4 | 0.730 | 0.702 | 0.702 | 0.710 |
| 2,3 | 0.760 | 0.677 | 0.697 | 0.713 |
| 2,4 | 0.736 | 0.705 | 0.708 | 0.716 |
| 3,4 | 0.766 | 0.683 | 0.702 | 0.719 |
| 1,2,3 | 0.752 | 0.680 | 0.694 | 0.711 |
| 1,2,4 | 0.762 | 0.699 | 0.705 | 0.723 |
| 1,3,4 | 0.770 | 0.687 | 0.702 | 0.722 |
| 2,3,4 | 0.770 | 0.687 | 0.702 | 0.722 |
| 1,2,3,4 | 0.745 | 0.672 | 0.686 | 0.703 |
3.2.2 Evaluation on the Validation Set
In general, Logistic Regression obtained better results, so that now we will present results using this classifier. We observed also that, in both models, Feature 1 (who), does not improve classification—this can be seen also from Table 5 with DT classifier (worst results). When the who feature is combined with other features, results are worsened. This is why from now on selected features will be only the amount of where and when along with the subjectivity value. This combination of features was tested with the validation set. Results are shown in Table 8.
3.3 Semi-Supervised Learning
The objective of this proposal is to identify news with semi-supervised learning. Simple heuristics and supervised learning helped with the feature selection, nevertheless they will not be used as classifier. As qualifier we experimented with SelfTraining and LabelSpreading [14]. After some experiments (see Apendix B) we decided to use SelfTraining. SelfTraining generates pseudo labels from a small data set previously tagged, the pseudo labels join the labels to make a larger training set.
This algorithm relies on supervised models to generate the pseudo labels; said pseudo labels are assigned to external data never seen before by the model and not belonging to the development set. For this task we used Logistic Regression with Stochastic Gradient Descendent. We tested with different percentages of the total of tagged data. For the development set we removed some percentage of the tagged data and automatically assigned pseudo-labels to it.
When the tagged data is 100% only manual labels were used (no pseudo-labels were used for training). For the development set we obtained the results shown in Table 9 and Figure 1. We included a box plot because of the randomness. We made 10 runs for each percentage changing the ignored labels randomly, so in the figure, the percentages showed there represents the tagged percentage that was used for the training, the orange line is the average of the run. The distribution of results can be observed, as well as the highest value in the top and the lowest in the bottom.
Table 9 Results of SelfTraining with the development set
| Tagged % | Recall | Precision | Accuracy | F score |
| 100 | 0.85 | 0.77 | 0.79 | 0.80 |
| 80 | 0.76 | 0.91 | 0.81 | 0.82 |
| 60 | 0.71 | 0.90 | 0.78 | 0.77 |
| 40 | 0.58 | 0.87 | 0.70 | 0.67 |
| 20 | 0.70 | 0.83 | 0.71 | 0.73 |
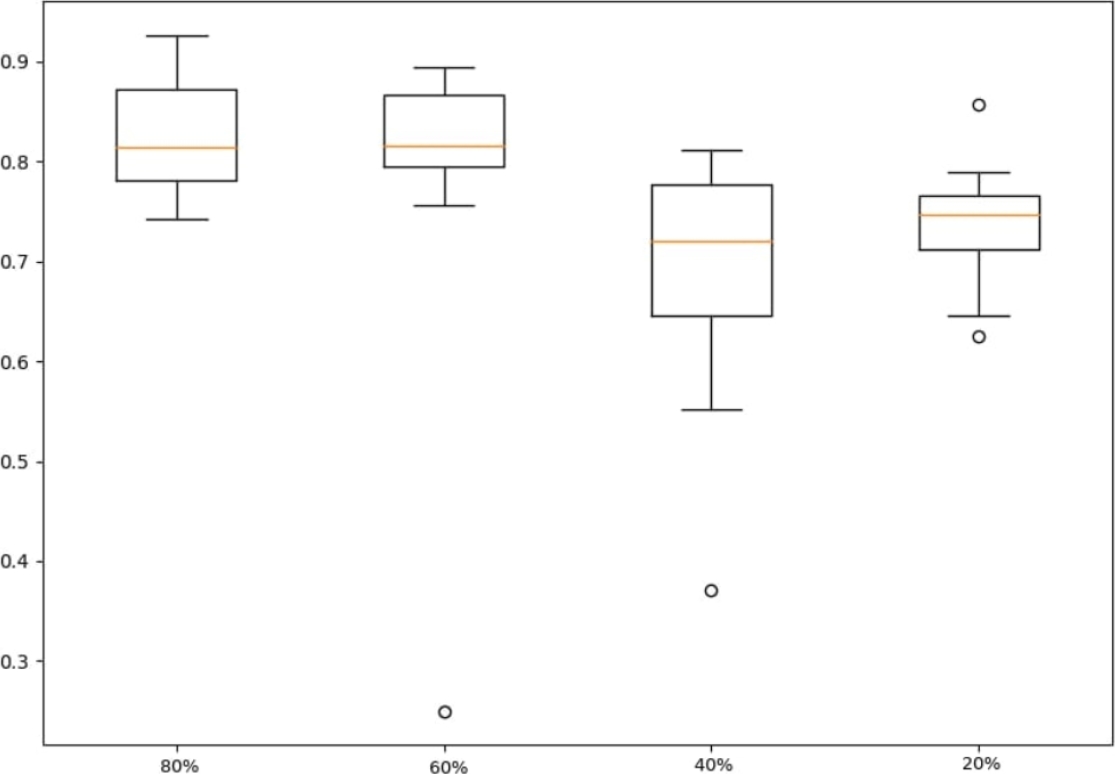
Then we also tested with the validation set in order to compare the supervised learning with the semi-supervised one using the same set of manually tagged data but this time, external data are added, not previously seen, for which a pseudo-label will be automatically generated using SelfTraining. The total amount of data changed with different percentages of labeled data, but the original manually tagged data remains the same (360 instances).
Results are shown in Table 10 and Figure 2 (details on precision, recall and accuracy of the LR classifier are included in Table 11.)
Table 10 Augmenting manually Tagged data with pseudo-labels (Pseudo-L) using SelfTraining. F score on the validation set using the LR classifier
| Tagged | Pseudo-L | Total | F | ||
| 100 % | 360 | 0 % | 0 | 360 | 0.73 |
| 80 % | 360 | 20 % | 90 | 450 | 0.75 |
| 60 % | 360 | 40 % | 240 | 600 | 0.72 |
| 40 % | 360 | 60 % | 540 | 900 | 0.73 |
| 20 % | 360 | 80 % | 440 | 1800 | 0.74 |

Table 11 Comparison using different classifiers
| Classifier | Tagged % | R | P | Acc. | F |
| NB | 100 | 0.59 | 0.57 | 0.65 | 0.58 |
| NB | 80 | 0.61 | 0.60 | 0.66 | 0.60 |
| NB | 60 | 0.62 | 0.61 | 0.66 | 0.61 |
| NB | 40 | 0.63 | 0.57 | 0.63 | 0.60 |
| NB | 20 | 0.65 | 0.54 | 0.61 | 0.59 |
| SVM | 100 | 0.80 | 0.72 | 0.78 | 0.76 |
| SVM | 80 | 0.80 | 0.74 | 0.79 | 0.77 |
| SVM | 60 | 0.76 | 0.74 | 0.78 | 0.75 |
| SVM | 40 | 0.71 | 0.71 | 0.75 | 0.71 |
| SVM | 20 | 0.68 | 0.72 | 0.75 | 0.79 |
| LR | 100 | 0.80 | 0.67 | 0.75 | 0.73 |
| LR | 80 | 0.78 | 0.72 | 0.77 | 0.75 |
| LR | 60 | 0.78 | 0.68 | 0.74 | 0.72 |
| LR | 40 | 0.76 | 0.71 | 0.77 | 0.73 |
| LR | 20 | 0.75 | 0.76 | 0.79 | 0.74 |
Finally, in order to verify that adding more data with automatically added pseudo-labels improves classification regardless of using different classifiers, we tested on the validation set with Support Vector Machines, Naive Bayes and again with Logistic Regression. The training set was the development set with different augmentations, and the test set the validation set. Results are shown in Table 11.
3.4 News Categorization with Semi-Supervised Learning
In order to apply our model to other tasks, we proposed its use in the problem of news categorization. In this task, documents identified as news were classified according to the following categories:
As mentioned at the beginning of this section, we have 1,000 documents labeled as news and non-news, and they were also labeled with a number from 1 to 7 in reference to the previous list of categories. Of these 1,000 documents, 790 were news and the rest, 210 non-news, were discarded. So again we divided the documents into development and validation sets, the former with 695 documents and the latter with 95.
In order to increase the training set with external data, we used the proposed method for news identification to filter news, and then we used the same semi-supervised SelfTraining method. For news categorization we selected the same classifiers: Naive Bayes, Support Vector Machines and Logistic Regression, with bag of words (this time with a frequency representation) and previously selected features (2,3,4).
Results are shown in Table 12. We can appreciate that, as in the previous experiments, augmenting the data with pseudo-tags after identifying the news documents with our method, helps to improve the performance in solving this new task.
Table 12 News categorization
| Classifier | Tagged % | R | P | Acc. | F |
| NB | 100 | 0.54 | 0.61 | 0.71 | 0.55 |
| NB | 80 | 0.54 | 0.63 | 0.72 | 0.56 |
| NB | 60 | 0.54 | 0.59 | 0.72 | 0.55 |
| NB | 40 | 0.53 | 0.58 | 0.71 | 0.53 |
| NB | 20 | 0.54 | 0.59 | 0.72 | 0.54 |
| SVM | 100 | 0.57 | 0.72 | 0.68 | 0.61 |
| SVM | 80 | 0.59 | 0.73 | 0.69 | 0.63 |
| SVM | 60 | 0.60 | 0.73 | 0.70 | 0.63 |
| SVM | 40 | 0.61 | 0.76 | 0.72 | 0.65 |
| SVM | 20 | 0.61 | 0.82 | 0.72 | 0.64 |
| LR | 100 | 0.70 | 0.84 | 0.78 | 0.72 |
| LR | 80 | 0.69 | 0.78 | 0.78 | 0.71 |
| LR | 60 | 0.68 | 0.80 | 0.78 | 0.71 |
| LR | 40 | 0.68 | 0.81 | 0.78 | 0.70 |
| LR | 20 | 0.71 | 0.80 | 0.79 | 0.72 |
4 Conclusion and Future Work
We have found that augmenting the training data set with pseudo-labeled instances improves classification’s performance for two different tasks: news identification and news categorization. We assessed this behavior using three different classifiers (NB, SVM and LR). Improvement is observed even with relatively small augmentation (20%). Being a scarcely explored task, these results are promising—even if recall drops, precision increases and this finally improves the F-measure performance. We can say the proposal is robust because we can observe a general improvement using different classifiers—there is improvement using added pseudo-labeled data.
It can be seen in figures 1 and 2 that when we have tagged percentages around 50% (e.g. 40% and 60%) there is more variability, but for 20% or 80% tagged data there is less variability. Therefore, our recommendation is to use a tagged percentage of 20% or 80%. Additionally, it can be seen in Table 11 that using 20% or 80% of tagged data always outperforms the baseline consisting on using only manually tagged data.
Document analysis is very important in this task, so that an in-depth study of their particular features could improve this method’s performance. In the future we plan to apply the proposed method to other tasks and explore the properties that make these tasks susceptible of being addressed better with the aid of pseudo-labeling.

