


 nueva página del texto (beta)
 Inglés (pdf)
 Artículo en XML
 Referencias del artículo
 Enviar artículo por email
 Citado por SciELO
  Similares en
SciELO
Similares en
SciELO 
 Permalink
1 Introduction
Studies by the National Population Council (CONAPO) in Mexico indicate that, between 2015 and 2050, the population of older adults will almost double and will increase from 900 million to 2000 million in 2050 [1]. This demographic change represents several challenges for current social programs that intend to maintain the independence of elderly in their family and in their community.
Older adults are exposed to changes such as retirement, or even widowhood that can lead to the development of emotional and psychological conditions [2]. The problem of the development of emotional and psychological disorders can be associated with the prevalence of affective, cognitive, and behavioral disorders in advanced age that, despite being potentially treatable conditions, are not properly diagnosed or treated.
On the other hand, new information and communication technologies provide different ways of monitoring people's daily activities and behavior. This information can be analyzed with robust statistics that can help predict certain behaviors that could indicate a health issue for an elderly. The disciplines of statistics, data mining [3] and machine learning play a very important role in understanding and describing characteristics, and to search for relationships and data patterns to build predictive models [4]. Data mining and pattern recognition allow us to obtain models created using efficient and effective techniques and algorithms that permit us to discover useful patterns for the detection of psychological disorders.
In the literature it is possible to find several research works focused on detecting several medical conditions. For example, the determination of the level of subjective loneliness in older adults through smartphone sensing [2] and the detection of social isolation in older adults through environmental intelligence and social networking sites [5]. These studies propose predictive models designed to determine the level of susceptibility of these psychological conditions. However, these studies address the conditions autonomously, that is, they work independently, so it is convenient to take advantage of this knowledge to define a new predictive model that combines these models. The objective of our research proposal is to develop a prediction model of psychological disorders using relevant characteristics of loneliness and social isolation obtained from the monitoring of daily activities of an older adult.
Paper is organized as follows: section 2 presents the related works, section 3 presents the overview of the proposed solution, section 4 presents the proposed predictive model for detecting loneliness and social isolation. Section 5 presents the evaluation of the proposed approach, and finally, section 6 presents the conclusions and future work.
2 Related Works
In healthcare, predictive analytics have been widely used to enable better decision making and to support preventive care [6, 7]. Several predictive models have been developed focused on detecting health issues in the elderly like predicting increased activity patterns [7], risk of frailty [8], analyzing behavioral and health-related changes [9], analyzing the factors affecting the presence of traumatic brain injury in the elderly occupants of motor vehicle crashes [10], even predicting the severity of COVID-19 in elderly patients [11].
There are predictive models that deal with diverse mental health issues like bipolar disorder [12], delirium on elderly [13], social emotions [14], detection and regulation of emotional states [15], emotional wellbeing [16], loneliness [–22], and social isolation [–25]. These predictive models were constructed analyzing different types of data like behavioral data [9, 15, –24, 26], physiological data [10, 15, 16], facial expressions [15, 16], text data [12, 14], 17, 25], imaging data [10], clinical data [8, 11, 13, 25], and social networking sites [24]. The analysis was done using statistical analysis [11, 13, 19, 20, 23], and artificial intelligence [–10, 12, 14–18, 21, 22, 24, 25].
2.1 Loneliness Predictive Models
Assessing loneliness in older adults is challenging due to the negative desirability biases associated with being lonely. However, some studies have objectively detected loneliness. In the work of Austin et al. [19], authors proposed a system to measure loneliness by assessing in home multiple objective behavioral measures. Elderly movements were captured using wireless motion sensors. Open and close door events were captured using contact sensors installed on the doors. Call activities were captured using phone monitors. Computer behavior was captured using software. Data was collected from 16 older adults who agreed to have the sensor platform installed in their own homes for up to 8 months. Loneliness was assessed using the University of California Los Angeles (UCLA) Loneliness Scale [27]. The results showed that loneliness is significantly associated with time out-of-home and number of computer sessions.
In the work of Badal et al. [17], authors assessed loneliness employing natural language processing techniques in transcribed speech text of older adults. Participants completed semi-structured qualitative interviews regarding the experience of loneliness and a quantitative self-report UCLA loneliness scale [27] to assess loneliness. Lonely individuals showed sadness and longer responses regarding loneliness questions. Women were more likely to be lonely. Men used more fearful and joyful words in their responses. The resulting predictive models predicted qualitative loneliness with 94% precision and quantitative loneliness with 76% precision.
In the work of Sanchez et al. [18], authors developed four predictive models to determine each aspect of loneliness: family loneliness, spousal loneliness, social loneliness, and existential crisis, according to [28]. Data was collected from 100 older adults who answered a questionnaire regarding their daily activities. Predictive models were developed by implementing a range of classifier algorithms. The best predictive models were implemented in a mobile application called “¡Vive!” which can collect data and predicting loneliness. Mobile application was evaluated with 12 participants. Results showed that the mobile application obtained an accuracy of 91.67% for family loneliness, an accuracy of 83.34% for spousal loneliness, an accuracy of 66.67% for social loneliness, and an accuracy of 83.34% for existential crisis.
2.2 Social Isolation Predictive Models
In the work of Campos et al. [24], authors presented a prediction model of social isolation in older adults through ambient intelligence and social networking sites. They identified attributes correlated with social isolation.
Data was collected from 144 older adults. They applied a survey to collect demographic data and the Lubben scale [29] to determine social isolation level. The prediction model obtained an accuracy score of 85% and a type II error rate of 15%. To evaluate the model, 8 older adults were monitored for one month using their mobile phones, four wireless IP cameras, a wireless router, an internet connection, and their Facebook message history.
A comparison between Lubben scale and predictive model was carried out, obtaining a prediction accuracy of 87% and a type II error rate of 15%.
2.3 Loneliness and Social Isolation Predictive Models
In the work of Goonawardene et al. [23], authors have detected social isolation in older adults through a sensor-based monitoring system which comprises passive infrared motion sensors installed in every room of the apartment and a door contact sensor. Each sensor reports if motion has been detected within its coverage area.
They extracted different features to examine the association with elderly’s social isolation level: going out, sleep, time spent in the living room, and activity level in the kitchen. Results showed that goingout behavior, daytime napping, and time spent in the living room are associated with different social isolation dimensions.
Further, elderly who perceived themselves as socially lonely tend to take more naps during the daytime.
In the work of Akgul et al. [21], authors presented an expert system which uses the artificial neural network and linear regression models to estimate emotional loneliness and social loneliness. Data was collected from 809 older adults through the Loneliness Scale for Elderly [30] using face-to-face interview technique. The results showed RMSE values of 0.1994 for social loneliness and 0.1883 for emotional loneliness with an artificial neural network model and RMSE values of 0. 3553 for social loneliness and 0.3837 for emotional loneliness with linear regression model. The artificial neural network model performed better than the linear regression model.
3 Overview of our Proposed Solution
The overview presents the main development phases of our prediction model for psychological disorders using relevant attributes for loneliness and social isolation. This model uses information obtained from the non-invasive monitoring of the daily activities of an older adult. Figure 1 summarizes the four main phases of the proposed methodology:
Phase1. Data Collection. In this phase, the databases of loneliness and social isolation are analyzed. The objective of this phase is to obtain data from the study sample.
Phase 2: Data Processing. In this phase, the data analyzed in the previous phase are preprocessed. This phase integrates the following activities: data transformation, training and test data, class balancing, and selection of relevant attributes. The objective of this phase is to improve the efficiency of the data mining process.
Phase 3. Predictive model construction. This phase considers the development of the predictive model for loneliness and social isolation. Several models were generated with different classification algorithms and hyperparameters. Also, the evaluation of these models and the analysis of the metrics obtained were carried out in this phase.
Phase 4. Model combination. In this phase the models generated in the previous phase are analyzed to obtain common features. The features are used for the construction combined model of loneliness and social isolation.

Fig. 1 Overview of our proposed solution4. Proposed Predictive Model for detecting loneliness and Social Isolation
4.1 Data Collection
The understanding of data is the core of the first phase of the proposed methodology. Two databases were considered in this phase: loneliness [2] and social isolation [5].
The loneliness database was created through a questionnaire applied to 100 older adults, including both men and women between 60 and 90 years of age (69 ± 7.165). The participants' older adults fulfill the following characteristics: they have full mental and physical capacities, they use a cellular phone, they had no difficulty understanding the questions, they signed the informed consent, and they were willing to take part in the research.
Older adults with physical, sensory, or cognitive disability were excluded because they were not part of the scope of the study. The questionnaire comprises two parts.
The first one gathered the level of loneliness in the older adult through the ESTE-R scale [28] which is targeted to Spanish speakers. This scale includes different dimensions of loneliness and groups them into four factors: family loneliness, spousal loneliness, social loneliness, and existential crisis. The scale consists of 34 items and the response options are: never, rarely, sometimes, regularly, or always. The Cronbach’s Alpha is 0.915, which indicates an excellent internal consistency. The scale results reflect the subject’s loneliness level and are valid for one month before the test is applied.
The loneliness database is composed of 100 information records on older adults organized into 5 sections (see https://docs.google.com/ document/d/1QIYIMCwqL7zbX9Hbn7e1A5T_m65 _IxTo). The first section is made up of 5 demographic questions. The next segment represents 15 questions about older adult cell phone information. The next segment contains 7 questions related to the times that the older adult is away from his house.
The next segment represents the information of the activities that the elderly adult performs at home, this segment is represented by 4 questions. In addition, the time that the elderly person spends in each of the rooms of their home is also analyzed through 4 questions. Finally, the level of loneliness of the older adult detected through the ESTE-R [28] loneliness survey is also collected
The data of the loneliness levels obtained from the questionnaires are the following: 17 people with loneliness, 12 people with principles of loneliness and 71 people without loneliness.
The isolation database was created through a questionnaire applied to 144 older adults. The sample included both men and women between 60 and 89 years of age (68.2 ±8.9), all of them with following characteristics: they have full cognitive and physical capacities without mobility impairment, they use a cellular phone and can use it to make calls or send text messages, they had no difficulty understanding the questions, they signed the informed consent, and they were willing to take part of the research. The older adults were surveyed about their social interactions over the last 30 days.
The questionnaire consists of two parts. The first one is the Spanish version of the Lubben Social Network Scale (LSNS-6) [29], which was used to determine the level of social isolation of older adults. The second part of the questionnaire collected data concerning demographic information as well as social interaction activities. The questions formulated by the LSNS-6 request information about the frequency of social interactions during one month prior to the interview, which is often difficult to remember accurately.
The social isolation database is composed of 144 records of information on older adults organized into 4 sections1. The first section is made up of 8 demographic questions. The next segment represents 17 questions related to the use of the cell phone of the elderly, such as: communication activities with friends and family. The next segment contains information about communication activities through social networks (8 questions). The next segment is made up of information on mobility activities of the elderly inside and outside the home. This segment is represented by 9 questions. Finally, the level of social isolation detected through the Lubben of social isolation survey [29] is also collected.
The social isolation database consists of 44 fields and 144 records of older adult participants. They were classified as follows: 48 people with high isolation, 93 people with low isolation and 3 people with no isolation. Having little information on people with no social isolation, inconsistent classifications were generated in the results, so it was decided to discard this class.
4.2 Data Processing
Data processing is the conversion of data into a usable and desired form called dataset. Raw data is highly susceptible to noise, missing values, and inconsistency. The quality of data affects the data mining results. To improve the quality of the data and, consequently, of the mining results, raw data is preprocessed to improve the efficiency and ease of the mining process.
In this research work, the quality of raw data was improved by using a preprocessing procedure that includes a) data transformation, b) training and test data c) class balancing and d) the selection of relevant attributes to improve the miner efficiency. As a result of these processes, two preprocessed datasets prepared to perform the attribute union analysis and generate behavior models were obtained. Following, the data preprocessing procedures are presented in detail.
4.2.1 Data Transformation
A data transformation step was necessary to convert the original data into a data format appropriated for the learning algorithms used in this research work. The task consisted of transforming the character type attributes to numeric type attributes, excluding the target class. As a result, a transformed dataset is generated. For example, the following transformation was made for the attributes: Sex (Female = 1; Male = 2), the attribute Works (Yes = 1; No = 0), the attribute Work situation (Housewife = 1; Retired = 2; No occupation = 3; Pensioner = 4; Worker = 5), etc.
4.2.2 Training and Testing Data Splitting
Training and testing data splitting were carried out before class balancing and feature extraction in order to avoid biased models and overly-optimistic estimates. Class balancing and feature extraction was applied only to training data during cross validation as suggested by Santos et al. [31] and Kuncheva et al. [32]. This guarantees that testing data is never seen by the feature selector or classifier. We used 10-fold cross validation with a 1/10 ratio for testing data.
4.2.3 Class Balancing
This step consists of balancing the classes of the target variable (prediction variable) to improve the precision of the predictive algorithms.
In an unbalanced database, the classes of the predictor variable are not equally represented, and this class imbalance can cause a predictive model being biased in favor of the majority class [33].
The class balancing step was carried out using the Synthetic minority oversampling technique SMOTE [33]. This technique creates synthetic instances to over-sample the minority class, and it also under-samples the majority class if it is necessary.
It creates synthetic instances between the k nearest neighbors of each object belonging to the minority class. Synthetic instances are calculated by the difference of the feature vector of the instance under consideration.
After applying the SMOTE technique implementing Euclidean distance function and a k = 3 to loneliness and social isolation datasets, 192 instances were obtained for the loneliness datasets and 166 instances were obtained for the social isolation datasets. Table 1 shows the detail of the balancing of each of the classes.
Table 1 Balancing of loneliness and social isolation classes
| Loneliness | Number of instances |
Balancing of loneliness classes |
Social isolation | Number of instances |
Balancing of social isolation classes |
| Without loneliness | 64 | 64 | Low risk social isolation | 83 | 83 |
| Onset of loneliness | 11 | 64 | High risk social isolation | 43 | 83 |
| With loneliness | 15 | 64 | |||
| Total | 90 | 192 | Total | 126 | 166 |
4.2.4 Attribute Selection
The attribute selection allowed us to select a subset of relevant attributes to be used in the construction of the predictive model.
The usefulness of the techniques of attribute selection techniques has several benefits because they simplify models, making them easier to interpret.
In addition, the attribute selection process reduces training times and its storage needs.
At the same time, a better view and understanding of the data is obtained.
The goal of the attribute selection process is to determine which data have redundant or irrelevant features that can be removed without much loss of information [34].
In this research work, three methods were used to carry out the selection of attributes: Pearson product-moment correlation coefficient, CfsSubsetEval method and InfoGainAttributeEval method.
CorrelationAttributeEval method, which evaluates the (Pearson) correlation between an attribute and the target class. Relevant attributes are those that have a moderate to high positive or negative correlation (close to -1 or 1) using 0.2 of correlation as the cut-off point.
CfsSubsetEval method with the Greedy Stepwise search criteria, which evaluates the value of a subset of attributes considering the individual predictive capacity of each attribute together with the degree of redundancy between them. All those indicated by the method are considered relevant attributes.
InfoGainAttributeEval method with the Ranker search criteria, which evaluates the value of an attribute by measuring the information gain (entropy) related with the target class. Relevant attributes are those attributes that have an entropy greater than 0.4.
A dataset was generated with relevant attributes for each one of the selection attributes methods2.
4.3 Predictive Model Construction
Several experiments were developed to generate the predictive model of loneliness and social isolation proposed in this research work. The experiments were conducted considering six of the top ten data mining algorithms identified by the IEEE International Conference on Data Mining [35]: C4.5, CART, Support Vector Machine, AdaBoost with Random Forest classifier, k Nearest Neighbor, and Naive Bayes.
The other four algorithms were not considered because they are focusing on clustering and because they have characteristics that were not adapted to the problem addressed in this research work. Two metrics were used to determine the performance of the six algorithms: Accuracy and F1 Score.
Experimentation
The loneliness and social isolation experiments are represented in Table 2, which includes the algorithms and the metrics that were evaluated in addition to one column for each experiment:
– LON1. Represents the best results of the parameterized algorithms using the preprocessed dataset with the relevant attributes from the CorrelationAttributeEval model.
– LON2. Represents the best results of the parameterized algorithms using the preprocessed dataset with the relevant attributes from the CfsSubsetEval model.
– LON3. Represents the best results of the parameterized algorithms using the preprocessed dataset with the relevant attributes from the InfoGainAttributeEval model.
– ISO1. Represents the best results of the parameterized algorithms using the preprocessed dataset with the relevant attributes from the CorrelationAttributeEval model.
– ISO2. Represents the best results of the parameterized algorithms using the preprocessed dataset with the relevant attributes from the CfsSubsetEval model.
– ISO3. Represents the best results of the parameterized algorithms using the preprocessed dataset with the relevant attributes from the InfoGainAttributeEval model.
Table 2 Comparison of loneliness and social isolation models
| Algorithm | Metrics | Loneliness experiments | Social isolation experiments | ||||
| LON1 | LON2 | LON3 | ISO1 | ISO2 | ISO3 | ||
| C4.5 | Accuracy | 0.7 | 0.5 | 0.5 | 0.866 | 0.866 | 0.866 |
| F-Measure | 0.689 | 0.547 | 0.533 | 0.87 | 0.87 | 0.87 | |
| CART | Accuracy | 0.6 | 0.8 | 0.7 | 0.933 | 0.866 | 0.933 |
| F-Measure | 0.618 | 0.8 | 0.722 | 0.935 | 0.87 | 0.935 | |
| Naive Bayes | Accuracy | 0.6 | 0.7 | 0.6 | 0.933 | 0.933 | 0.866 |
| F-Measure | 0.642 | 0.746 | 0.65 | 0.935 | 0.935 | 0.87 | |
| SVM | Accuracy | 0.7 | 0.8 | 0.8 | 0.733 | 0.733 | 0.866 |
| F-Measure | 0.7 | 0.514 | 0.514 | 0.667 | 0.667 | 0.87 | |
| kNN | Accuracy | 0.6 | 0.6 | 0.6 | 0.933 | 0.866 | 0.933 |
| F-Measure | 0.638 | 0.638 | 0.683 | 0.935 | 0.87 | 0.935 | |
| AdaBoost | Accuracy | 0.7 | 0.7 | 0.7 | 0.933 | 0.933 | 0.933 |
| Random Forest | F-Measure | 0.7 | 0.7 | 0.425 | 0.935 | 0.935 | 0.935 |
The evaluation of the models was performed using the test dataset which was split in section 4.2. The validation process was repeated 10 times and the results were averaged to obtain a single estimate.
As a result of the experimentation, two models were obtained, one for loneliness and one for social isolation. For the case of loneliness, the best model is LON2 with CART algorithm and for the case of social isolation, we can use any of the 9 models with 0.933 accuracy and 0.935 F-Measure.
4.4 Model Combination
We have constructed two new models for loneliness and social isolation using only common attributes. Data training and evaluation were carried out using the same algorithms and metrics of the previous steps. Results are shown in Table 3. For the case of loneliness, the best model was AdaBoost-Random Forest algorithm with an accuracy and an F-measure of 0.7. For the case of social isolation, the best model was k-Nearest-Neighbor algorithm with an accuracy of 0.8 and an F-measure of 0.794.
Table 3 Combined model validation
| Algorithm | Metrics | LON | ISO |
| C4.5 | Accuracy | 0.5 | 0.4 |
| F-Measure | 0.542 | 0.411 | |
| CART | Accuracy | 0.6 | 0.466 |
| F-Measure | 0.618 | 0.481 | |
| Naive Bayes | Accuracy | 0.5 | 0.466 |
| F-Measure | 0.348 | 0.407 | |
| SVM | Accuracy | 0.7 | 0.666 |
| F-Measure | 0.693 | 0.4 | |
| kNN | Accuracy | 0.6 | 0.8 |
| F-Measure | 0.676 | 0.794 | |
| AdaBoost | Accuracy | 0.7 | 0.6 |
| Random Forest | F-Measure | 0.7 | 0.6 |
These models have the same attributes, so we test original social isolation data using loneliness model and vice versa. This process is carried out with the objective of defining new classes that allow combining the models into one.
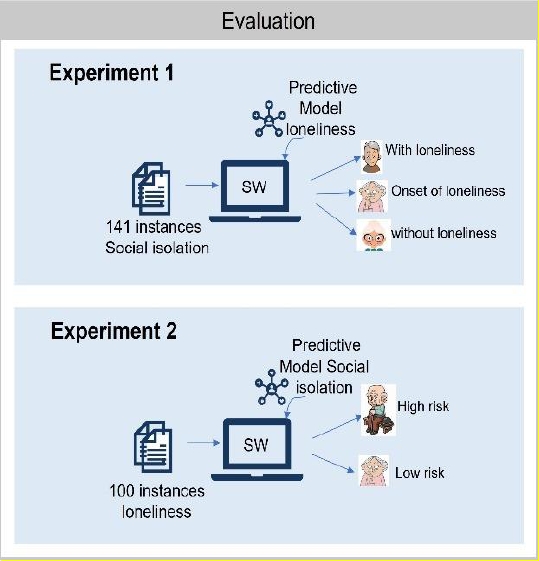
5. Evaluation of the Proposed Methods for Loneliness and Social Isolation
The evaluation of the models for loneliness and social isolation was performed by developing two software systems that implements the LON and ISO models (Figure 2). In both models, the relevant attributes of the models described in https://docs.google.com/document/d/1U-kpc4RY2qLUDXOvvJxutUu1QONFEdTD. and the instances of the databases were used. In the case of algorithm LON, 141 instances of the social isolation database were used; In the case of the ISO model, 100 instances of the loneliness database were used for the evaluation.
Figures 3-4 presents the results of the LON prediction model for the relationship loneliness-social isolation.


Figure 3 presents the results of the classification of 48 people diagnosed with high social isolation. The results indicate that 73% of this segment were classified by the model as people without loneliness.
Figure 4 presents the results of the classification of 93 people diagnosed with low social isolation. The results indicate that 88% of this segment were classified by the model as people without loneliness.
Figures 5-7 presents the results of the ISO prediction model for the relationship loneliness-social isolation. Figure 5 presents the results of the classification of 17 people diagnosed with loneliness. The results indicate that 59% of this segment were classified by the model as people with high risk of social isolation.
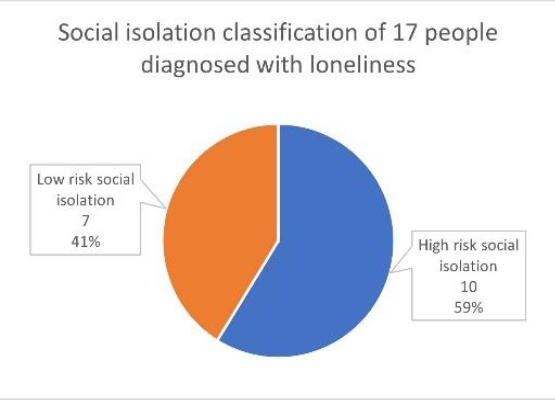


Figure 6 presents the results of the classification of 12 people diagnosed with onset of loneliness.
The results indicate that 50% of this segment were classified by the model as people with high risk of social isolation.
Figure 7 presents the results of the classification of 71 people diagnosed without loneliness. The results indicate that 58% of this segment were classified by the model as people with high risk of social isolation.
The result of the evaluation permits to infer that a person with loneliness may also have low social isolation or not present social isolation.
This implies that a person can feel lonely even having contact with other people in their environment.
6. Conclusions and Future Work
In this study, a model for predicting loneliness and social isolation in older adults was presented. The development of the model was based on joining specific models for loneliness and social isolation, and in detecting the relevant attributes that are common for both prediction models.
This research work evaluated 6 different algorithms to predict loneliness and social isolation and determined that algorithms LON and ISO have better performance of the evaluated methods. To evaluate the models, software systems were developed that implement LON and ISO algorithms.
The model LON has demonstrated to have an 70% accuracy and ISO with 80% accuracy performance with the attributes of gender, age, marital status, outgoing calls to relatives, outgoing calls to friends, incoming calls from relatives, incoming calls from friends, outgoing messages to relatives, outgoing messages to friends, incoming messages from family members, incoming messages from friends, average call time to family, average call time to friends, average time in bedroom, average time in living room, average time in kitchen.
The research work has permitted associating attributes that are relevant for both diseases and that revealed the relations among the different levels of social isolation and loneliness.
The current state of the research was very useful to validate the models; however, we need to develop a mobile application that enables the non-invasive monitoring of activities of older adults. The automatic monitoring of daily activities needs to be complemented with the application of ESTER-R and Lubben scale questionnaires that validate in real time the predictions of the models.

