


 nueva página del texto (beta)
 Inglés (pdf)
 Artículo en XML
 Referencias del artículo
 Enviar artículo por email
 Citado por SciELO
  Similares en
SciELO
Similares en
SciELO 
 Permalink
1 Introduction
The general terminology used in this paper is briefly discussed in Table 1. The Test Paper Blueprint (TPB) shown in Table 2 is a systematic design plan, which lays out exactly how the test paper is created.
Table 1 Terminology used for Dynamic Blueprint Generation
| Term | Meaning |
| Course | Course is a Degree/Diploma program offered at a university. Example: 1. Bachelor of Science (Computer Science), B.Sc (Comp. Sc.) 2. Bachelor of Computer Application, BCA. |
| Subject | S is a subject/paper offered in different semesters of a course. Example: Software Engineering (SE) in 6th Semester and Information Technology (IT) in 1st Semester of B.Sc. (Comp. Sc). |
| Modules/ Units | For each subject, there is a prescribed syllabus having different modules/units. A set of related topics is grouped as one unit/module. Each module is allotted a particular weightage. Example: Module on Software Requirement in SE subject has weightage of 30% in the 6th semester of B.Sc (Comp. Sc). |
| Educational Taxonomy | A classification system of educational objectives based on level of student understanding necessary for achievement or mastery. Example: Benjamin Bloom, Solo, etc. |
| Educational Taxonomy Levels | Educational Taxonomy has its cognitive stages in learning called taxonomy levels. Example: Bloom's Taxonomy Levels: Knowledge, Comprehension, Application, Analysis, Synthesis and Evaluation. |
| M,N,m,n,TM | M,N,m,n,TM are the number of modules in the subject, number of levels in the taxonomy, instructor specified number of modules, number of levels and total marks respectively for generating a dynamic Test Paper Blueprint (TPB). |
| Module (pi) | pi is the ith module specified by instructor for TPB, p =< p1..., pm > |
| Taxonomy Level (qj) | qj is the jth level specified by instructor for TPB, q =< q1..., qn > |
| Module Weight (ui) | ui is the weight assigned to the ith module in the TPB. |
| Level Weight (lj) | lj is the weight assigned to the jth level in the TPB. |
| Module-Level-Weight (xij) | xi j is the weight assigned to the jth module of jth level in the TPB. |
| Test Paper Blueprint (TPB) of maximum marks TM | TPB is an m× n matrix with rows representing Modules pi (i=1 to m), columns representing Educational Taxonomy Levels qj (j=1 to n), cells representing ith module of jthlevel xij such that |
| m', n', tm | m', n', tm is instructor specified number of modules, number of levels and total marks respectively for generating a scaled TPB. |
| Scaled Module Level-Weight (x'vw) | x'vw is the scaled weight assigned to the vth module of wth level. |
| Scaled Module Weight (u'v) | u'v is the scaled weight assigned to the vth module. |
| Scaled Level Weight (l'w) | u'v is the scaled weight assigned to the wth level. |
| Scaled TPB (tpb) Of maximum marks, tm | TPB is an m' × n' matrix generated from TPB by scaling its rows with respect to m' modules and scaling its columns with respect to n' levels such that |
Table 2 Test Paper Blueprint (TPB) Format
| Unit/Level | Level 1 | Level 2 | Level 3 | Level n | Unit Weight |
| unit1 | x11 | x12 | x13 | x1n | u1 |
| unit2 | x21 | x21 | x23 | x2n | u2 |
| unitm | xm1 | xm2 | xm3 | xmn | um |
| Level Weight | l1 | l2 | l3 | ln | TM |
The TPB with maximum marks (TM), distribution of unit/module weights (u1, u2..., um), distribution of cognitive levels weights (l1, l2..., ln), etc., so suggested in the TPB Format in Table 1 is expected to ensure that:
(a) The weight given to each unit/module, (u1, u2..., um) in a test paper is appropriate, so that the important modules are not neglected.
(b) The weightage of cognitive skills, (l1, l2..., ln) tested are appropriate. For example, there are sufficient questions requiring application and understanding of logical reasoning.
(c) Weight of modules and weight of cognitive skills are proportionately adjusted for generating blueprints that are used for different test papers with varying total marks, TM.
(d) Test paper satisfies both time and marks constraints.
(e) Test paper takes into account of different difficulty levels.
(f) Weight allotted to a cell of a blueprint also known as module-level-weight, x11..., xmn is the proportionate weightage assigned to the particular level under a module of a blueprint.
In order to incorporate all the above requirements of a blueprint, it is necessary to design an algorithm for dynamic blueprint generation and use it for generation of test paper.
This test paper has proper weightage allotted to subject content, cognitive learning domain, type of question, total marks, etc., and can be used for generation of several test papers almost without repetition depending on the paper-setter's choice.
The number of unique test papers (without any overlap) that can be prepared for the given subject using a generated blueprint (Suskie, 2009) depends on the quality and size of the Question Bank (QB) (Hwang et al., 2006). The quality of a QB is decided on the basis of the type of questions, such as questions of 1 mark, 2 marks, 5 marks, etc. that exist in the QB for each unit under different cognitive levels of an Educational Taxonomy (Krathwohl, 2002).
2 Related Work
Two main methods have been proposed by researchers for solving Multi-Objective Optimization Problems (MOOP) namely (1) conventional or classical method and (2) meta-heuristic algorithms. The classical methods commonly use a single random solution, updated at each of the iteration with a deterministic procedure to find the optimal solution. Hence, classical methods are able to generate one optimal solution at the end of the iterative procedure. On the other hand, meta-heuristic algorithms are based on a population of solutions, which will lead hopefully to a number of optimal solutions at every generation.
The population based meta-heuristics algorithms collect ideas and features present in nature or in our environment and use it for implementing them as search algorithms using a stochastic procedure. Search mechanisms of meta-heuristics have the capability to explore large and complex search spaces while finding one or more optimal solutions (Zitzler and Deb, 2008). The features found in nature represented as an algorithm through these methods generally use a substantial number of operators and parameters, which must be appropriately set. There is no unique/standard definition of meta-heuristics in the literature. However, the recent trend is to name all stochastic algorithms with randomization and global exploration as meta-heuristic.
Randomization provides a good way to move away from local search to the search on the global scale. Therefore, almost all meta-heuristic algorithms are usually suitable for global optimization. Meta-heuristic can be an effective way to use, by trial and error, to produce acceptable solutions to a complex problem in a reasonably practical time. The complexity of the problem of interest makes it impractical to search every possible solution or combination and therefore, the goal is to find good and feasible solutions in a satisfactory time period. There is no guarantee that the optimum solution can be found. Also, we are unable to predict whether an algorithm will work and if it does work, there is no reason that explains why it works. The idea is to have a competent and practical algorithm, which will work majority of the time and will be able to produce qualitatively good solutions (Gandomi et al., 2013).
Among the quality solutions found, it can be expected that some of them are nearly-optimal or optimal, though there is no guarantee for such optimality to occur always. Hence, meta-heuristic algorithms have been successfully applied to find solutions for many complex real-world optimization problems. Meta-heuristic algorithms can be classified into different categories based on the source of inspiration from nature. The main category is the biologically-inspired algorithms, which generally use biological evolution and/or collective behavior of animals as their model. Science is an added inspiration for meta-heuristic algorithms. These algorithms are generally inspired by physics and chemistry. Furthermore, art-inspired algorithms have been successful for global optimization.
These are generally inspired by the creative behavior of artists such as musicians and architects. Social behavior is an additional source of inspiration and the socially inspired algorithm simulate social manners to solve optimization problems. Even though there are dissimilar sources of inspiration for meta-heuristic optimization algorithms, they also have similarities in their structures. Therefore, they can also be classified into two main categories: 1) evolutionary algorithms and 2) swarm algorithms.
Evolutionary algorithm generally uses an iterative procedure based on a biological evolution progress to solve optimization problems, whereas swarm-intelligence-based algorithms use the collective behavior of animals such as birds, insects or fishes (Holland, 1975). Three main types of evolutionary algorithms have been evolved during the last few years: Genetic Algorithms (GA) mainly developed by J.H. Holland (Holland, 1975), Evolutionary Strategies (ES) developed by Ingo Rechenberg (Fogel, 1994), and Evolutionary Programming (EP) by D.B. Fogel (Fogel, 1995). Each of these Evolutionary Algorithms uses different representations of data, different operators working on them and different implementations.
They are inspired, however, by the same principles of natural biological evolution. Similar to evolutionary algorithms, three main types of swarm algorithm have also been evolved during the last few years: Particle Swarm Optimization (PSO) developed by Kennedy and Eberhart (Kennedy and Eberhart, 1995), Ant Colony Optimization (ACO) developed by D. Karaboga (Karaboga, 2005) and Artificial Bee Colony (ABC), algorithm also developed by D. Karaboga (Karaboga, 2005).
Each of these Swarm Algorithms deals with collective behaviors of animals that result from the local interactions of individual components with each other as well as with their environment. Finding an optimal solution to an optimization problem is often a challenging task, and depends on the choice and the correct use of the right algorithm.
The choice of an algorithm may depend on the type of problem, the available set of algorithms, computational resources and time constraint. For large-scale, nonlinear and global optimization problems, there is often no standard guideline for algorithm choice and in many cases; there are no efficient exact algorithms (Holland, 1975).
Therefore, depending on the number of multiple conflicting objectives that need to get satisfied as well as on the complexity of the search space, it is necessary to choose efficient and effective search and optimization mechanisms from the available population based, biologically inspired meta-heuristic Evolutionary Algorithms and Swarm Algorithms that solve the problem by applying reasonable time and space constraints.
The automated objective test sheet generation model has undergone many changes over a period of time and also has incorporated efficient algorithms such as Evolutionary Algorithms (Zhi et al., 2010; Lin et al. 2012; Peipei et al., 2012; Hu et al., 2011; Huang et al., 2009; Liu, 2010; Ho et al. 2009; Lirong & Jianwei, 2010; Liu et al., 2008) and Swarm Algorithms (Bloom, 1956; Ming et al., 2009; Dascalu, 2011; Yin et al., 2006) for generation of single test sheet or multiple test sheet sets that meet multiple assessment criteria. Both these algorithms were similar in terms of their search and optimization, and were found successful in composition of near-optimal multiple objective test sheets.
As a matter of choice, we proceeded with the pioneer algorithm among them; Evolutionary Algorithm (EA), for the generation of automated descriptive test paper model. EAs typically, have a set (population) of solution candidates (individuals), which we try to improve gradually. Improvements may be generated by applying different variation operators, most notably mutation and crossover, to certain individuals. The quality of solutions is measured by a so-called fitness function or objective function. Mutation means a new individual is generated by slightly altering a single parent individual, whereas crossover operator generates a new individual by recombining information from two parents.
Most Evolutionary Algorithms used in practice consider either one or both of these operators. Based on the fitness value of individuals, a selection procedure removes some individuals from the population. The cycle of variation and selection is repeated until a solution of sufficient fitness is found. The strength of this general approach is that each component can be adapted to the particular problem under consideration. This adaptation can be guided by an experimental evaluation of the actual behavior of the algorithm or by previously obtained experience.
In addition, not every Evolutionary Algorithm (EA) needs to have all components described above (Coello-Coello et al., 2007; Deb, 2001). Since a population of solution candidates gets processed in each of the iteration, the outcome of EA can also be a population of feasible solutions. If an optimization problem includes a single objective, EA population members are expected to converge to a single optimum solution satisfying the given objective.
On the other hand, if a problem includes multi-objectives, EA population members are expected to converge to a set of optimum solutions satisfying multiple objectives. Solution to multi-objective problems consists of sets of tradeoffs between objectives. Multiple optimal solutions exist because no one solution can be optimal for multiple conflicting objectives. If none of the two solutions, of multi-objective problem that are compared dominates each other, these solutions are called non-dominated solutions, Pareto-optimal solutions or trade-off solutions.
The set of all Pareto-optimal solutions is called the Pareto-optimal set (Pareto-front). Since such solutions are not dominant on each other and there exists no other solution in the entire search space, which dominates any of these solutions, such solutions are of utmost importance in a MOOP. Hence, Evolutionary MOOP consists of determining all solutions to the MOOP problem that are optimal in the Pareto sense (Deb and Gupta, 2005; Thiele and Zitzler, 1999).
2.1 Pareto Genetic Algorithm Approach for Test Paper Blueprint Generation
The adaptability of evolutionary approach was used best for TPB generation. Even though Evolutionary Algorithm (EAs) designed in (Jun, 2019) have been successfully implemented for test paper generation, they are found not efficient with respect to time for meeting multi-constraints specified by an instructor for generating multiple TPB for different types of test papers. The evolutionary approach-based test paper blueprint of (Jun, 2019) had a major disadvantage that it used randomized approach for assigning module-level weights. Even though it generated population of test paper blueprint iteratively, many of them were not adequate in terms of its fitness. During the iterative population generation, significant runtime delay was observed.
This is due to the wastage of time in searching a set of random module-level-weights that satisfied both module weights and level weights. Also, EAs never guaranteed the generation of the instructor specified number of blueprints even after running it for the instructor specified number of iterations.
In order to overcome the limitation of EAs, an enhanced EA using Pareto-optimal solution has been designed. This algorithm is found to generate multiple optimal Test Paper Blueprints (TPBs) in lesser time satisfying instructor specified multi- constraints. Pareto-optimality based Multi-Objective Evolutionary Algorithm (MOEA) generates optimal trade-off solutions also known as Pareto-optimal set of TPBs. As a notion in Pareto-optimal MOEA, the instructor/paper-setter has been provided with a set of Pareto-optimal TPB solutions, which are not dominated by any other TPB solutions. Each of these designed TPBs can act as a standard in generating a test paper by performing an intelligent search of questions based on the designed TPB.
2.1.1 Goals of MOEA Implemented for Pareto-Optimality
Two goals have been taken into account while designing Pareto-approach based MOEA for multiple TPB generation, which are listed below:
The first goal is mainly related to assigning scalar fitness values in the presence of multiple objectives. Scalar fitness assignment is carried out by transforming multi-objective problem into a mono-objective problem (Guang, 2010). The second goal concerns generation of diverse candidate solutions. In contrast to single-objective optimization, where objective function and fitness function is directly and easily related, in multi-objective optimization fitness assignment and selection have to take into account all the different objectives. Among the different fitness assignment strategies, the most commonly used are those based on aggregation (Talbi, 2009; Caramia and Olmo, 2008).
This approach, which mimics the weighted-sum method, aggregates the objectives into a single parameterized objective function. The parameters of this function are varied systematically during the optimization run in order to find a set of non-dominated solutions instead of a single trade-off solution.
In our MOEA, we apply the weighted sum method to optimize the two objectives such as: the percentage of coverage assigned to module weights and the percentage of importance assigned to taxonomy level weights.
Our aggregate function applies two different weights independently to these objectives and generates a single parameterized objective function equivalent to these two objectives. The methodology adopted is the same as the one used in evolutionary approach.
2.2 Steps for Evolutionary Approach in Test Paper Blueprint Generation
Step 1. Generate Population of TPB: Q different test paper blueprint as specified by instructor/paper-setter are either generated initially or at successive iterations to form a population. The set of blueprints of the initial population is formed by calculating the module-level-weights of each cell by using the formula: xmn= (um × ln) / TM and adjusting them to its nearest integer values.
Step 2. Calculate Fitness of TPB: Calculate fitness of TPBs using the Fitness Function. Details of Fitness (F) calculation is explained in section 4.
Step 3. Selection: Apply selection operation to the generated TPBs. It is carried out based on the criteria that the set of TPBs with fitness value in the range of 0.8-1.0, is to be identified and selected.
Step 4. Mutation: Among the selected TPBs, identify the ones that can be mutated to increase its fitness value. Perform mutation on these identified blueprints by altering the module-level weight of any cell and accordingly adjusting the rest of the cell values.
Step 5. Termination: Step 1 till step 4 are repeated iteratively until an optimum number of solutions is found or the instructor specified number of iterations is completed, whichever is earlier.
3 Problem Description
a) Input for TPB Generation:
(1) TM = Total marks allotted for designing TPBs.
(2) U=U=<u1, u2..., um>, the vector of selected unit/module weights where ui is the weight assigned to the i-th unit.
(3) L=<l1, l2..., ln>, the vector of selected cognitive level weights of educational taxonomy where lj is the weight assigned to the j-th cognitive level.
b) Problem Statement:
The problem is to assign module-level-weights, X=<x11..., xmn>, so as to get the optimum value for the Fitness Function (F).
Let w1 be the percentage of importance assigned to module coverage and let w2 be the percentage of importance assigned to taxonomy level coverage. In order to define fitness, we have defined the following terms:
The term Question Paper Blueprint (QPT) has been used interchangeably at many places in the paper instead of Test Paper Blueprint (TPB).
3.1 Algorithm Design
Pareto-optimal TPB generation has been carried out by Pareto-optimal TPB Generation Algorithm is presented as Algorithm 1.

4 Experimental Data
Using the Goa University examination test papers and the cognitive levels of Bloom's taxonomy, multiple TPB's were generated for the subject of Software Engineering (SE) offered at the third year of the three years bachelor's degree course of computer science (B.Sc. Computer Science):
Input Data:
Total marks= 50,
Selected module weights =05, 15, 15, 15,
Selected level weights = 15,15,05,15,
Population size=10,
Mutation rate=0.2,
Paper-setter Specified Number of iterations=50,
percentage of importance assigned to module coverage=0.50,
percentage of importance assigned to taxonomy level coverage =0.50,
Expected number of TPBs=3.
5 Obtained Results for GA
SE Pareto-optimal TPB1 of Table 3, SE Pareto-optimal TPB2 of Table 4 and SE Pareto-optimal TPB3 of Table 5 below shows the three different samples of generated TPB's for SE. Generation of these TPB's were successful within 50 iterations.
Table 3 SE Pareto-optimal TPB1
| Module/Level | know | under | appl | anal | module weight |
| Software Architecture | 2 | 1 | 1 | 1 | 05 |
| Software Test. Tech. | 4 | 5 | 1 | 5 | 15 |
| Software Process | 5 | 4 | 1 | 5 | 15 |
| Software Conf. Mgmt. | 4 | 5 | 2 | 4 | 15 |
| Level weight | 15 | 15 | 5 | 15 | 50 |
Table 4 SE Pareto-optimal TPB2
| Module/Level | know | under | appl | anala | module weight |
| Software Architecture | 1 | 2 | 1 | 1 | 05 |
| Software Test. Tech. | 5 | 4 | 2 | 4 | 15 |
| Software Process | 4 | 5 | 1 | 5 | 15 |
| Software Conf. Mgmt. | 5 | 4 | 1 | 5 | 15 |
| Level weight | 15 | 15 | 5 | 15 | 50 |
Table 5 SE Pareto-optimal TPB3
| Module/Level | know | under | appl | anal | module weight |
| Software Architecture | 1 | 1 | 1 | 2 | 05 |
| Software Test. Tech. | 5 | 5 | 1 | 4 | 15 |
| Software Process | 5 | 5 | 1 | 4 | 15 |
| Software Conf. Mgmt. | 4 | 4 | 2 | 5 | 15 |
| Level weight | 15 | 15 | 5 | 15 | 50 |
5.1 Performance Analysis of TPB Generation
Table 6 shows the experimental results obtained after iteratively generating the instructor specified number of SE TPBs (3 in this case).
Table 6 Performance Analysis of Pareto-optimal Evolutionary Algorithm
| Evolutionary Algorithm | Pareto-Optimal Evolutionary Algorithm | ||||
| Template No. | Iteration No. | Fitness | Template No. | Iteration No. | Fitness |
| t1,1 | 1 | 0.5001 | t1,1 | 0.7045 | |
| t1,2 | 1 | 0.5212 | t1,2 | 1 | 0.7066 |
| t1,3 | 1 | 0.5334 | t1,3 | 1 | 0.7077 |
| t1,4 | 1 | 0.5475 | t1,4 | 1 | 0.7079 |
| t1,5 | 1 | 0.5511 | t1,5 | 1 | 0.7093 |
| t1,6 | 1 | 0.5613 | t1,6 | 1 | 0.7108 |
| t1,7 | 1 | 0.5733 | t1,7 | 1 | 0.7127 |
| t1,8 | 1 | 0.5812 | t1,8 | 1 | 0.7149 |
| t1,9 | 1 | 0.5884 | t1,9 | 1 | 0.7158 |
| t1,10 | 1 | 0.6094 | t1,10 | 1 | 0.7198 |
| t 2,1 | 2 | 0.6104 | t 2,1 | 2 | 0.7202 |
| t 2,2 | 2 | 0.6183 | t 2,2 | 2 | 0.7209 |
| t 3,1 | 3 | 0.6275 | t 3,1 | 3 | 0.8223 |
| t 4,1 | 4 | 0.6364 | t 4,1 | 4 | 0.8291 |
| t32,1 | 32 | 0.6603 | t32,1 | 32 | 0.8717 |
| t32,2 | 32 | 0.6686 | t32,2 | 32 | 0.8726 |
| t34,1 | 34 | 0.6911 | t34,1 | 34 | 0.9313 |
| t34,2 | 34 | 0.6936 | t34,2 | 34 | 0.9326 |
| t 40,1 | 40 | 0.7198 | t 40,1 | 40 | 0.9971 |
| t 40,2 | 40 | 0.7205 | t 40,2 | 40 | 0.9988 |
| t 40,2 | 40 | 0.7232 | t 40,2 | 40 | 0.9997 |
| t 45,1 | 45 | 0.7311 | t 45,1 | 45 | terminate |
| t 45,2 | 45 | 0.7365 | t 45,2 | 45 | terminate |
| t 50,9 | 50 | 0.7399 | t50,9 | 45 | terminate |
Results indicate that the Pareto-optimal based evolutionary algorithm has achieved optimal TPBs at the 40th iteration.
5.2 Discussion for the Application of GA
A new approach for generating multiple set of test papers using TPBs has been discussed. The main advantage of Pareto-optimal based evolutionary algorithm as compared to state of art evolutionary algorithm is that the runtime delay of the evolutionary genetic approach is significantly reduced by avoiding randomized approach for population generation.
We have carried out the experimental study of Pareto-optimal evolutionary algorithm with a population size of 10 with its mutation probability of 0.2, which successfully explored the search space and optimally generated multiple sets of dynamic blueprints. This new approach is important in situations where instructors wish to generate multiple set of test papers in a subject for the same examination. Examinations such as in-semester, end-semester etc., forces the proportionate coverage of modules and cognitive levels.
Using multiple TPBs, there are lesser probabilities of similar questions automatically extracted during the question selection process. Complexity of Pareto-optimal evolutionary approach has been generally determined in terms of the relationship between the search space and the difficulty in finding a solution.
The search space in our multi-objective Pareto-optimal evolutionary approach-based optimization problem of dynamic blueprint generation is discrete and two-dimensional; that is, a solution in the search space is represented by two different types of components such as the selected units of the syllabus and the selected levels of Bloom's taxonomy. Hence, complexity of this blueprint generation algorithm is found to be proportional to the number of units and the number of levels specified for TPB generation.
6 Bi-Proportional Scaling Method for Test Paper Blueprint Generation
The dynamic blueprints generated by the previously discussed genetic approach is successful in providing the flexibility for constructing many qualitatively sound examination test papers using the same blueprint. Pareto-optimal based evolutionary algorithm has been able to reduce the run-time delay, but still is unable to guarantee always the generation of optimal solutions within the user specified number of iterations. In order to overcome the limitation, we have introduced a matrix balancing technique that automatically scales and balances all entries of the TPB.
The Bi-proportional matrix balancing technique performs iterative scaling and proportional fitting of the TPB to satisfy the instructor specified number of modules of the subject, instructor specified number of levels of taxonomy and instructor specified marks requirement of each examination.
The mathematical foundation and wide spread application of matrix scaling problem has attracted researchers from multiple disciplines to use it in various applications. Estimating the entries of a large matrix to satisfy a set of prior consistency requirements is a problem that frequently occurs in economics, transportation, statistics, regional science, operation research and other areas (Schneider and Zenios, 1990; Gake and Pukelsheim, 2008; Speed, 2005).
There are several scaling problems, each with different consistency requirements and therefore the definition of a scaled matrix is problem dependent (Mesnard, 2002; Lahr and Mesnard 2004).
In general, matrix scaling is considered as a mathematical scaling procedure, which can be used to ensure that a matrix of data is adjusted so that the scaled matrix agrees with the original row and column constraints. The original matrix values are adjusted gradually through repeated iterations to fit it to user input row and column constraints. To solve a problem using matrix scaling procedure, we need to identify the marginal tables and the seed cells.
The procedure alternates between fitting the rows and fitting the columns of the seed cells to the identified marginal table entries. Result of the fitting process is a scaled matrix with corresponding set of estimated cells probabilities or cell means (Fienberg and Meyer, 2004). An L1-error function is incorporated normally in matrix scaling problems for measuring the distance between current row and column sums and target row and column marginal entries.
The procedure converges to bi-proportional fit if and only if the L1-error tends to zero. In case of non-convergence, a separate procedure to handle error points (+e and -e) needs to be considered (Pukelsheim, 2014; Oelbermann, 2013). The seed cell entries can be of continuous variant or of discrete variant types (Oelbermann, 2013). In the continuous variant, non-negative real numbers are permitted, where as in the discrete variant, non-negative integers are considered.
Matrix scaling procedure with discrete variant is found appropriate for TPB scaling. The procedure alternates between fitting the modules and fitting the cognitive levels and converges with a bi-proportionally scaled and balanced TPB. Cognitive processing levels of a TPB are decided on the basis of the taxonomy that is selected for each examination.
The scaled TPB so generated is used for framing a test paper by performing an intelligent selection of questions.
6.1 Problem Statement
Given a TPB for subject S of maximum marks TM as shown in Table 1.10 represented as m × n matrix where m is the number of units/modules such that p={p1, p2,...,pm}, n is the number of levels such that q={q1, q2,...,qn} and each cell xi j representing the weight assigned to the i-th module for the i-th taxonomy level, the problem is to dynamically generate a scaled tpb for the instructor input number of modules m', instructor input number of levels n' and instructor input total marks tm.
6.2 Bi-proportional Matrix Scaling for Dynamic TPB Generation
The main modules for scaled TPB generation using bi-proportional matrix scaling procedure are shown in Figure 1.

The term Question Paper Blueprint (QPT) has been used interchangeably at many places in the paper instead of Test Paper Blueprint (TPB).
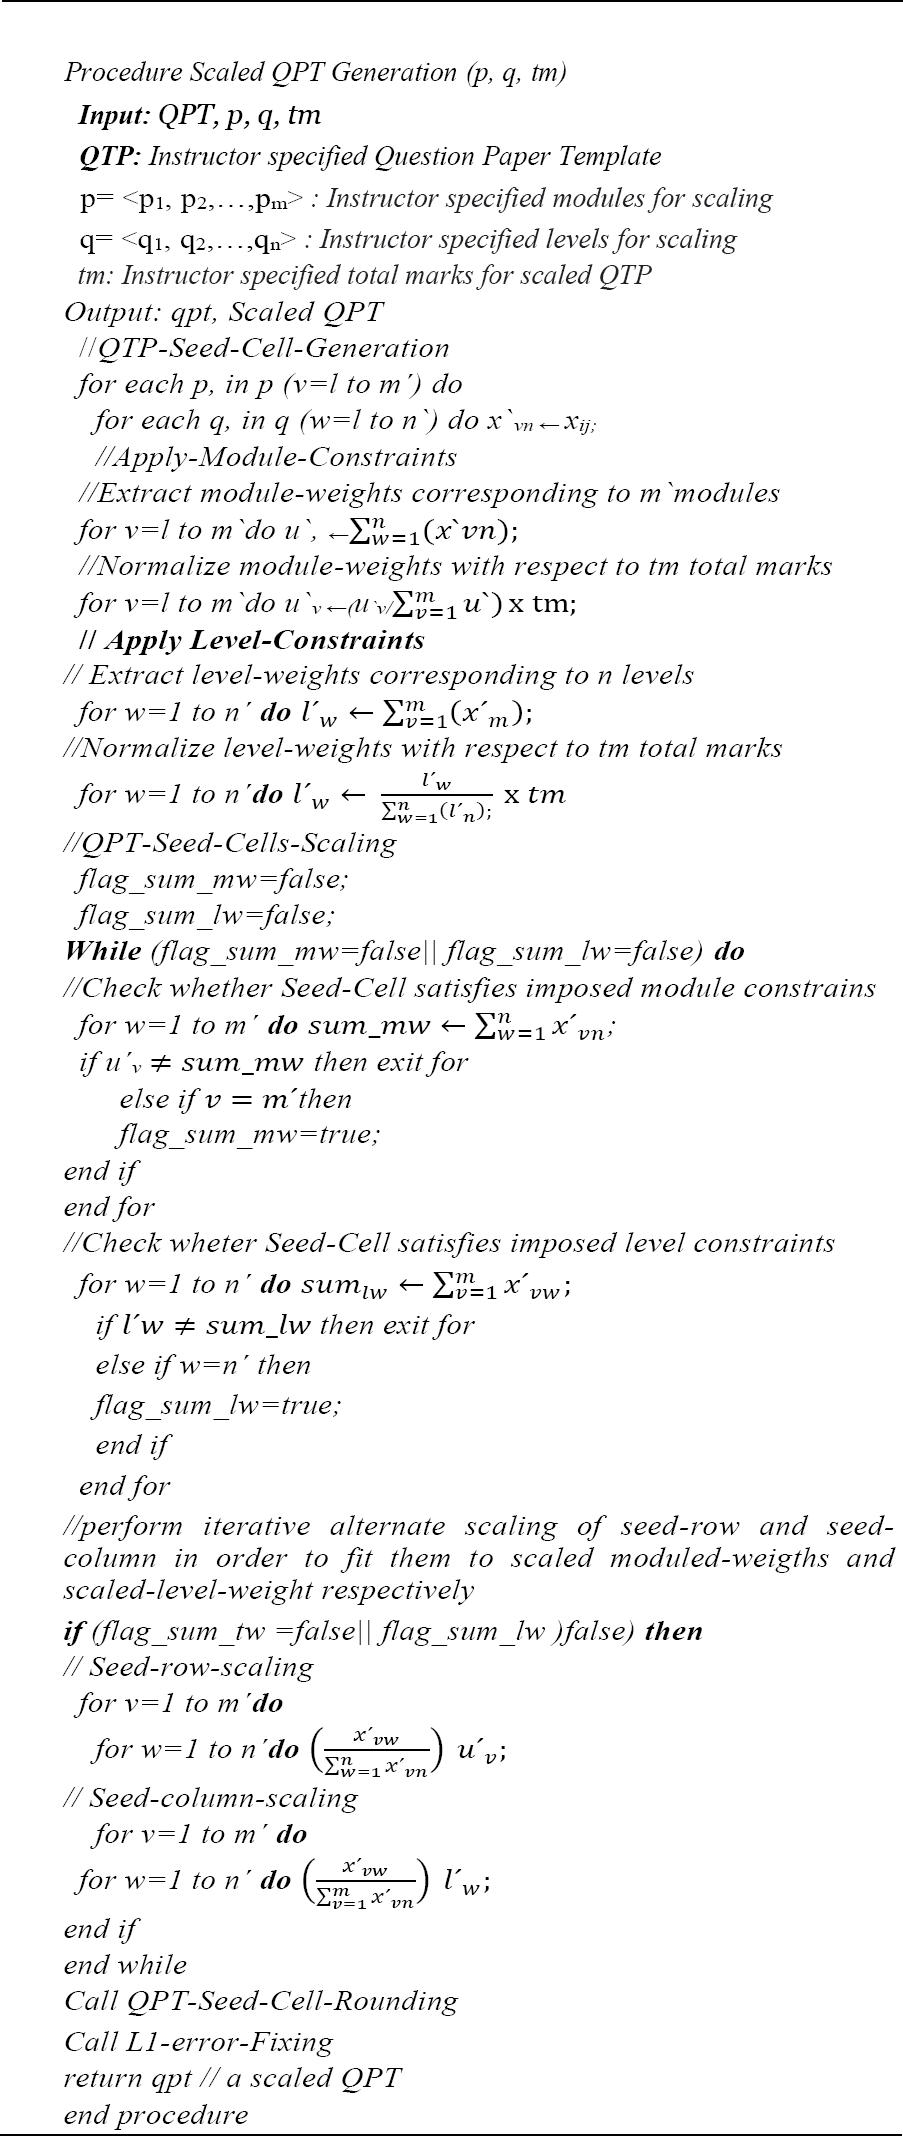
The brief details of modules of Scaled TPB generation are presented in different steps below:
Step 1. TPB-Seed-Cell-Generation: Extracts TPB module-level-weights corresponding to instructor input m' modules and n' levels and represents the extracted module-level-weights as Seed-Cells.
Step 2. Apply-Module-Constraints: Extracts TPB module weights corresponding to instructor input m' modules, normalizes the module weights with respect to instructor input tm (total marks) and represents the normalized module weights as scaled-module-weights.
Step 3. Apply-Level-Constraints: Extracts TPB level weights corresponding to instructor input n' levels, normalizes the level weights with respect to instructor input tm (total marks) and represent the normalized level weights as scaled-level-weights.
Step 4. TPB-Seed-Cell-Scaling: Iteratively scale the rows and columns of Seed-Cells to fit them to the scaled-module-weights and scaled-level-weights until the Seed-Cells meet the imposed module, level and total marks constraints and outputs the scaled matrix as tpb.
Step 5. TPB-Seed-Cell-Rounding: It applies closest integer rounding rule on tpb.
Step 6. L1-error-Fixing: The L1-error encountered during rounding procedure is identified by counting along the rows and columns of tpb and verifying how many of them are not yet adjusted to the row totals and column totals respectively.
If L1-error encountered is zero, then the generated output is considered as an optimal dynamic tpb. In all the other cases, the generated output is a near-optimal tpb. L1-error converges by proportionately adjusting the rows and columns with +e and –e errors.
Algorithm Design Scaled TPB generation has been carried out by processing six different modules such as TPB-Seed-Cell-Generation, Apply Module-Constraints, Apply Level-Constraints, TPB-Seed-Cell-Scaling, TPB-Seed-Cell-Rounding and L1-error-Fixing with a comprehensive Scaled TPB Generation Algorithm is Algorithm 2.
6.3 Experimental Results for Bi-proportional Matrix Scaling
Experimental study was carried out using the following case study. We have considered Bloom's taxonomy for this study. Experimental data used for the case study are as follows:
S = Software Engineering (SE), a subject offered at the third year of the three year bachelor's degree course of computer science (B.Sc Computer Science) at Goa University,
m=8; m'=6,
n=6; n'=4,
p = {legacy systems, requirement engineering, software prototyping, software architecture, software testing techniques, software processes, software configuration management, CASE tools}; p'= {legacy systems, software prototyping, software architecture, software testing techniques, software configuration management, CASE tools},
q = {knowledge(know), understanding(under), application(appl), analysis(anal), synthesis(synth), evaluation(eval)}; q' = {understanding, analysis, synthesis, evaluation},
TPB = SETPB, an end semester TPB of SE for maximum marks, TM = 100 as shown in Table 7; tm = 60.
Table 7 SE test paper blueprint (SETPB)
| Module/Level | Know | Under | appl | anal | synth | eval | Cumulative-Module-Weigth |
| Legacy Systems | 1 | 4 | 1 | 1 | 6 | 2 | 15 |
| Requirement Eng. | 1 | 6 | 2 | 2 | 2 | 2 | 15 |
| Software Prot. | 1 | 2 | 2 | 1 | 2 | 2 | 10 |
| Software Arch. | 1 | 1 | 1 | 4 | 2 | 6 | 15 |
| Soft. Test. Tech | 1 | 1 | 2 | 2 | 2 | 2 | 10 |
| Software Process | 1 | 1 | 2 | 2 | 2 | 2 | 10 |
| Soft. Conf. Mgtm. | 1 | 2 | 6 | 2 | 2 | 2 | 15 |
| CASE tools | 4 | 1 | 1 | 1 | 1 | 2 | 10 |
| Cumulative-Level-Weigth | 11 | 18 | 17 | 15 | 19 | 20 | 100 |
Sequence of steps carried out for Scaled SETPB Generation is as below:
Step 1. SETBP-Seed-Cell-Generation: SETPB seed cells are formulated by extracting SETPB module-level-weights corresponding to six selected modules and four selected levels. SETPB-Seed-Cells formulated are represented in Table 8.
Step 2. Apply-Module-Constraints: SETPB scaled-module-weights are generated by normalizing the module weights of modules such as legacy systems, software prototyping, software architecture, software testing techniques, software configuration management and CASE tools with respect to 60 marks. SE-scaled-module-weights, SE-mw generated is shown in Table 9.
Table 9 SETPB-Scaled-Module-Weights
| Module | SE-mw |
| Legacy Systems | 15 |
| Software Prot. | 7 |
| Software Arch. | 16 |
| Soft. Test. Tech | 8 |
| Software Process | 8 |
| CASE tools | 6 |
| Total Marks | 60 |
Step 3. Apply-Level-Constraints: SETPB scaled-level-weights are generated by normalizing the level weights of levels such as understanding, analysis, synthesis and evaluation with respect to 60 marks. SE-scaled-level-weights, SE-lw generated are represented in Table 10.
Step 4. SETPB-Seed-Cell-Scaling: SETPBs iterate alternate scaling starts by merging the SE-Seed-Cells with SE-mw and SE-lw. Initial stage of SE-Seed-Cell scaling is shown in Table 11.
Table 11 Initial Stage of SETPB-Seed-Cell-Scaling
| Start | 13 | 12 | 17 | 18 |
| 15 | 4 | 1 | 6 | 2 |
| 7 | 2 | 1 | 2 | 2 |
| 16 | 1 | 4 | 2 | 6 |
| 8 | 1 | 2 | 2 | 2 |
| 8 | 2 | 2 | 2 | 2 |
| 6 | 1 | 1 | 1 | 2 |
SETPBs iterative scaling continues until the scaled SETPB, SEtpb fulfills SE-mw and SE-lw. Iterative stages of SE-Seed-Cell-Scaling are represented in Table 12. SETPB iterative alternate bi-proportional scaling terminates at the end of fourth iteration.
Table 12 Iterative Stages of SETPB-Seed-Cell-Scaling
| Row Adjustement | Column Adjustement | ||||||||
| Iteration 1 | |||||||||
| 12.19 | 12.56 | 16.87 | 18.38 | 13 | 12 | 17 | 18 | ||
| 15 | 4.62 | 1.15 | 6.92 | 2.31 | 15.26 | 4.92 | 1.10 | 6.98 | 2.26 |
| 7 | 2.00 | 1.00 | 2.00 | 2.00 | 7.06 | 2.13 | 0.96 | 2.02 | 1.96 |
| 16 | 1.23 | 4.92 | 2.46 | 7.38 | 15.73 | 1.31 | 4.70 | 2.48 | 7.23 |
| 8 | 1.14 | 2.29 | 2.29 | 2.29 | 7.94 | 1.22 | 2.18 | 2.30 | 2.24 |
| 8 | 2.00 | 2.00 | 2.00 | 2.00 | 8.02 | 2.13 | 1.91 | 2.02 | 1.96 |
| 6 | 1.20 | 1.20 | 1.20 | 2.40 | 5.99 | 1.28 | 1.15 | 1.21 | 2.35 |
| Iteration 2 | |||||||||
| 12.93 | 12.07 | 16.92 | 18.09 | 13 | 12 | 17 | 18 | ||
| 15 | 4.84 | 1.08 | 6.86 | 2.22 | 15.04 | 4.87 | 1.08 | 6.89 | 2.21 |
| 7 | 2.11 | 0.95 | 2.00 | 1.94 | 7.01 | 2.13 | 0.94 | 2.01 | 1.93 |
| 16 | 1.34 | 4.78 | 2.52 | 7.36 | 15.96 | 1.34 | 4.76 | 2.54 | 7.32 |
| 8 | 1.23 | 2.20 | 2.32 | 2.25 | 7.99 | 1.23 | 2.19 | 2.33 | 2.24 |
| 8 | 2.13 | 1.91 | 2.01 | 1.95 | 8.00 | 2.14 | 1.90 | 2.02 | 1.95 |
| 6 | 1.28 | 1.15 | 1.21 | 2.36 | 6.00 | 1.29 | 1.14 | 1.22 | 2.34 |
| Iteration 3 | |||||||||
| 12.99 | 12.01 | 16.99 | 18.01 | 13 | 12 | 17 | 18 | ||
| 15 | 4.85 | 1.07 | 6.87 | 2.20 | 15.01 | 4.36 | 1.07 | 6.87 | 2.20 |
| 7 | 2.12 | 0.94 | 2.00 | 1.93 | 7.00 | 2.13 | 0.94 | 2.01 | 1.93 |
| 16 | 1.35 | 4.77 | 2.54 | 7.34 | 15.99 | 1.35 | 4.77 | 2.54 | 7.34 |
| 8 | 1.24 | 2.19 | 2.33 | 2.25 | 8.00 | 1.24 | 2.19 | 2.33 | 2.24 |
| 8 | 2.14 | 1.90 | 2.02 | 1.94 | 8.00 | 2.14 | 1.89 | 2.02 | 1.94 |
| 6 | 1.29 | 1.14 | 1.22 | 2.35 | 6.00 | 1.29 | 1.14 | 1.22 | 2.34 |
| Iteration 4 | |||||||||
| 13.00 | 12.00 | 17.00 | 18.00 | 13 | 12 | 17 | 18 | ||
| 15 | 4.85 | 1.07 | 6.87 | 2.20 | 15.01 | 4.85 | 1.07 | 6.87 | 2.20 |
| 7 | 2.13 | 0.94 | 2.01 | 1.93 | 7.00 | 2.13 | 0.94 | 2.01 | 1.93 |
| 16 | 1.35 | 4.77 | 2.54 | 7.34 | 15.99 | 1.35 | 4.77 | 2.55 | 7.34 |
| 8 | 1.24 | 2.19 | 2.33 | 2.24 | 8.00 | 1.24 | 2.19 | 2.33 | 2.24 |
| 8 | 2.14 | 1.89 | 2.02 | 1.94 | 8.00 | 2.14 | 1.89 | 2.02 | 1.94 |
| 6 | 1.29 | 1.14 | 1.22 | 2.35 | 6.00 | 1.29 | 1.14 | 1.22 | 2.34 |
Step 5. TPB-Seed-Cell-Rounding: Table 13 represents the scaled and rounded integer values of SE-Seed-Cells at the end of fourth iteration.
Table 13 Scaled and Rounded Seed-Cell-Scaling
| 13 | 12 | 17 | 18 | |
| 15 | 5 | 1 | 7 | 2 |
| 7 | 2 | 1 | 2 | 2 |
| 16 | 1 | 5 | 3 | 7 |
| 8 | 1 | 2 | 2 | 2 |
| 8 | 2 | 2 | 2 | 2 |
| 6 | 1 | 1 | 1 | 2 |
Step 6. L1-error-Fixing: The near optimal SE-Seed-Cells of Table 13 get proportionately adjusted with +1 and -1 L1-error. The SE-Seed-Cells generated after fixing L1-error are shown in Table 14. The resulting optimal SE-tpb is shown Table 15.
Table 14 SE-Seed-Cells after L1-error Fixing
| 13 | 12 | 17 | 18 | |
| 15 | 5 | 1 | 7 | 2 |
| 7 | 2 | 1 | 2 | 2 |
| 16 | 1 | 5 | 3 | 7 |
| 8 | 2 | 2 | 2 | 2 |
| 8 | 2 | 2 | 2 | 2 |
| 6 | 1 | 1 | 1 | 3 |
6.4 Discussion for Bi-proportional Matrix Scaling
This work focused on an incremental approach for dynamic test paper generation by using bi-proportional matrix scaling method. The main advantage of this approach is that it performs automatic scaling and balancing of all entries of the TPB by carrying out iterative scaling and proportional fitting procedure.
The procedure alternates between fitting the modules and fitting the cognitive levels and converges with a bi-proportionally scaled and balanced TPB. Bi-proportional matrix scaling has been found successful in generating a scaled TPB with lesser computational resources.
An L1-error function is incorporated normally in matrix scaling problems for measuring the distance between current row and column sums and target row and column marginal entries. The procedure converges to bi-proportional fit if and only if the L1-error tends to zero.
We have used matrix scaling with discrete variant, which iteratively scales the TPB, assigns integer valued marks (integer round up operation) under different levels of a module, x L1-error by proportionately adjusting the candidate rows and columns with +1 and -1 values respectively and generates a bi-proportionally scaled and balanced. The dynamic TPB so generated can drastically reduce the time and e ort of the user while ensuring test paper quality also.
7 Conclusion
Reforms in the educational system emphasize more on continuous assessment. Continuous assessment requires the generation of dynamic test papers for different examinations. Automatically generating dynamic TPB, satisfying instructors specified number of modules and instructor specified number of taxonomy levels, has been found to be very important in situations where novice instructors wish to formulate test papers for different examinations.
The evolutionary approach of section 2.3 has been able to generate population of TPBs, but encountered significant run-time delay during the iterative population generation. Alternatively, Pareto-optimal based evolutionary algorithm of section 2.3 has been able to reduce run-time delay, but still was unable to always guarantee generation of optimal solutions within user specified number of iterations.
In order to overcome these limitations, bi-proportional matrix balancing technique has been designed and implemented. The bi-proportional matrix balancing technique performs iterative scaling and proportional fitting of the TPB to satisfy the instructor specified number of modules of subject, instructor specified number of levels of taxonomy and Instructor specified marks requirement of each examination.
The best advantage of bi-proportional scaling technique is that it avoids re-execution of computationally expensive multi-objective evolutionary algorithms for generating different variants of the successfully generated evolutionary approach based optimal blueprint.
Finally, our experimental analysis concludes that evolutionary approach and Pareto-optimal evolutionary approach are efficient in generating new and different types of blueprint, whereas matrix scaling procedure is suitable for re-generating different variants of an existing evolutionary algorithm based TPB with lesser computational resources.

