


 nueva página del texto (beta)
 Inglés (pdf)
 Artículo en XML
 Referencias del artículo
 Enviar artículo por email
 Citado por SciELO
  Similares en
SciELO
Similares en
SciELO 
 Permalink
1 Introduction
Energy sustainability is of global interest and the oceanic sources constitute attractive alternatives for sustainable energy extraction [1, 2]. In this regard, wave energy conversion (WEC) is less developed than other renewables, but attention to it has increased in recent years, when we have witnessed the emergence of WEC technology in several countries [3, 4]. Important reviews of the status of the WEC, including an evaluation of the different technological devices developed can be found in [5-7].
Mexico has a coastline of 11,122 km (7,828 km belong to the Pacific Ocean and 3,294 km to the Gulf of Mexico and the Caribbean Sea), according to data from the National Institute of Statistical Geography and History of Mexico (INEGI) [8]. This makes it imperative to consider seriously oceanic renewable resources, especially for electricity generation. Recently, the Federal Commission for Electricity (State company in charge of the generation and distribution of electric energy, dependent on the federal government's energy secretary) and other institutions, like the national institute of electricity and clean energy (INEEL, for its initials in Spanish), carried out some studies and pilot projects to assess the feasibility to exploit Mexico's ocean energy.
The results are encouraging. In the case of marine currents in Mexico, potentials of up to 40,000 MW have been reported1. However, despite these estimates, the Mexican Department of Energy, which is mainly responsible for the proposal, planning, regulation, and application of energy legislations, considered renewable ocean energy only until 2018 [9-11].
With this background, the present work seeks to explore the wave energy potential in different nodes at Mexican coast and provide an overview of the essentials aspects for the design of distributed generation systems based on this renewable.
To estimate the wave potential several input variables are required, such as depth, periodicity wave, significant wave height, and wave direction. These parameters are measured by a floating asymmetric body known as point absorbing; unfortunately, involving all those degrees of freedom into the calculations greatly complicates the estimation of energy potential.
Therefore, in this work we focus our attention on the two most relevant ones: the significant wave height, 𝐻𝑚(m), and the wave’s periodicity, 𝑇(s).
With these parameters, one can estimate the power absorbed by point absorbing unto three degrees of freedom. We analyzed the data from oceanographic buoys databases at two coastal nodes. Fig. 1 shows the location of them (Campeche and Yucatan in the Gulf of Mexico and the Caribbean Sea, respectively).

Fig. 1 Location of the two coastal nodes from where databases of significant wave height and wave periodicity were obtained.
We chose coastal nodes far apart to account for measurements from areas with significantly different characteristics; we note that the values of 𝐻𝑚 and 𝑇 are similar in areas nearby the nodes.
2 Wave Energy and Power
Most common ocean surface waves are wind-driven and result from the friction between the wind and the surface of water.
The wave energy depends directly on the wind being an intermittent energy source. The formation of these waves originates indirectly from the solar energy that creates air displacements that rub against the sea surface.
Wave energy depends on wave behavior and it can be characterized by its spectrum, 𝑆(𝑓, 𝛼), which quantitatively describes the energy of the wave contained at frequency 𝑓 for the portion of the wave traveling along the angular direction 𝛼.
This work assumes that spectrum can be synthesized by the two parameters 𝐻𝑚 and 𝑓 = 𝑇−1(Hz), while neglecting 𝛼 (rad). Therefore, it is possible to describe the average energy density per unit area of sea surface by [12]:
where 𝐸 is the average energy density per unit area, in units of (J/m2); 𝜌 is the density of sea water (1025 kg/m3); 𝑔 is the acceleration of gravity (9.81 m/s2); and, 𝑆(𝑓) is the wave spectrum, in units of (m2/Hz).
For a real wave, the wave energy transport or power density level is a function of the spectrum 𝑆(𝑓) and can be expressed in terms of the significant wave height and periodicity 𝑇 by [12]:
where:
is the energy velocity at which a wave group moves.
Therefore, when a sinusoidal wave strikes an axisymmetric body (point absorber) with a power density Eq. (2), it could absorb a power level in any of the six degrees of freedom, just three are translation modes: 1) surge; 2) sway; 3) heave; and three are rotational modes: 4) roll; 5) pitch; 6) yaw; as we can see in Fig. 2.
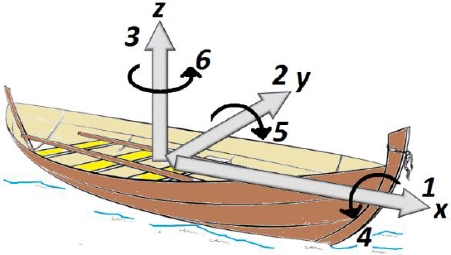
In this work, we consider only translational modes, so the magnitude of the power level can be estimated by following [11, 12]:
where 𝑛 is the number of translational degrees of freedom i.e., 𝑛 = 3 for three degrees of freedom; 𝜆 is the wavelength (m), which depends on the depth of the analyzed node, and it can be estimated as:
for depths deeper and shallower than 300m, respectively [10, 11]. From Eq. (2)-(5), one can notice that 𝐻𝑚 and 𝑇 are necessary to estimate the wave power magnitude.
These parameters were determined from oceanographic databases from two coastal nodes in Mexico.
3 Descriptive Statistical Analysis
The two nodes analyzed (see Fig. 1) are:
“Campeche”, station 42055 Bay of Campeche:
- Located at 22.203 N 94.000 W (22°12'10" N 94°0'1" W, 214 NM NE OF Veracruz, MX).
- Water depth at buoy’s location, 3566 m.
- Radius of the observation area, 3983 m.
“Yucatan”, station 42056 Yucatan Basin:
- Located at 19.802 N 84.857 W (19°48'6" N 84°51'24" W, 120 NM ESE of Cozumel, MX).
- Water depth at buoy’s location, 4684 m.
- Radius of the observation area, 3648 m.
Both stations belong to, and are maintained by, the National Data Buoy Center (NDBC). The coast distance and the depth were taken from Bathymetry program of the National Oceanic and Atmospheric Administration (NOAA) [13] and Google Earth (Google). Historical data from the nodes were included from May 2005 to January 2016. Of these data, at least 99% are correctly acquired. Each database consists of measurements performed every 15 minutes; so, for each analyzed node there are 35,040 data points per year.
Due to the large amount of ocean data obtained at each station, we make use of descriptive statistics to determine the relevant values of 𝐻𝑚 and 𝑇 for wave power estimation. In this regard, we find that boxplots are appropriate representations for graphically depicting groups of numerical data through their quartiles.
Fig. 3 shows the boxplots of 𝐻𝑚 for the two nodes analyzed. It can be noticed that the relevant values are below 2 m in all cases: for both coastal nodes and for all months. In fact, the relevant values of 𝐻𝑚 are in the range from 0.5 to 1.90 m.
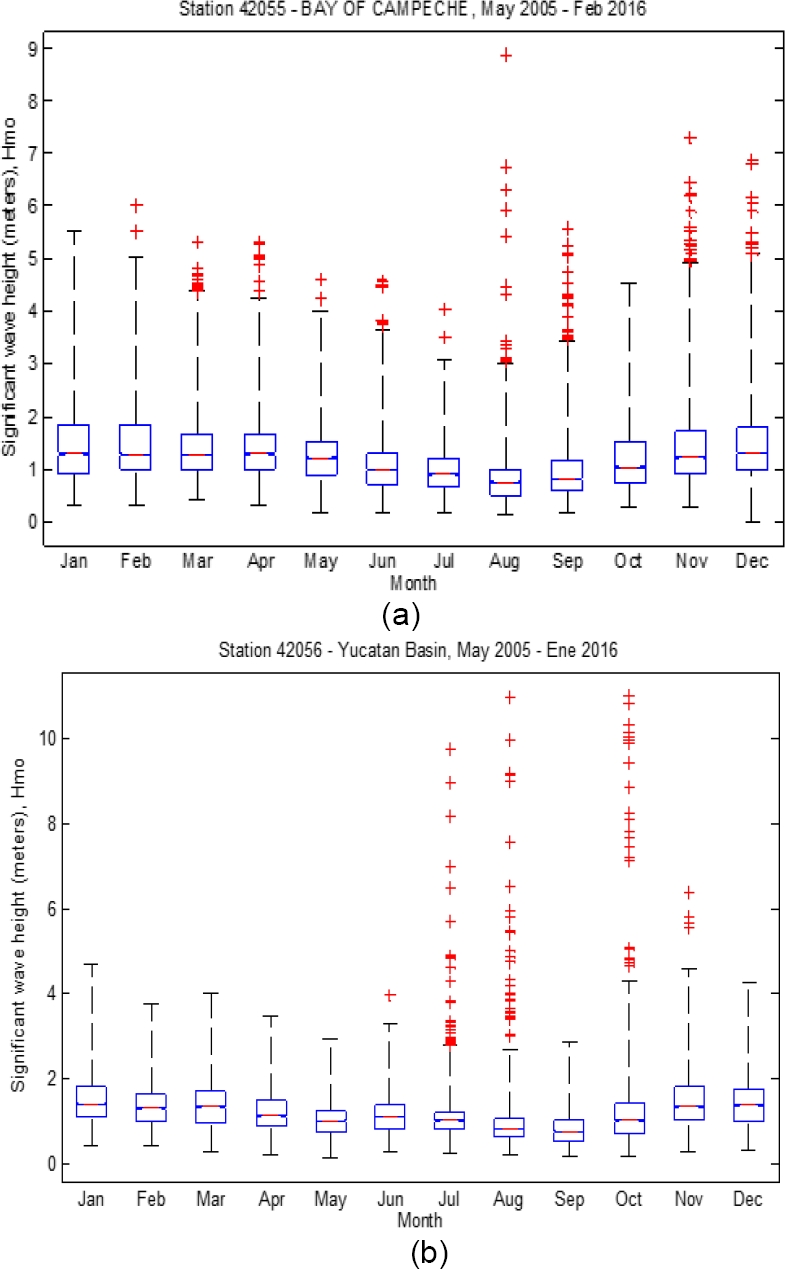
Fig. 3 Boxplot for 𝐻𝑚 at the coastal nodes analyzed, a) Campeche and b) Yucatan. The plots summarize data collected over the course of 11 years, from 2005 to 2016
Fig. 4 shows the boxplots of 𝑇 for the two nodes analyzed. In this case, the relevant values of 𝑇 are in the range from 4 to 6 s. In both Fig. 3 and 4, atypical values far from median are denoted with cross marks; those values coincide with measurements performed during storm season.

Fig. 4 Boxplot for 𝑇 at the a) Campeche and d) Yucatan coastal nodes. The plots summarize data collected over the course of 11 years, from 2005 to 2016.
For each pair of 𝐻𝑚 and 𝑇 in the entire collection of data, we calculated the corresponding average energy density, 𝐸, (Eq. (1)) and the maximum power, 𝑃𝑚𝑎𝑥, (Eq. (4)) for a vertical electric generator (one degree of freedom; ; 𝑛 = 1 in Eq. (4)). For each coastal node, we use the corresponding value of 𝜆 according to the depth at that location.
Table 1 summarizes the wave energy estimations obtained for each node analyzed. We are reporting the first three quartiles of the entire collection of data.
Table 1 Wave energy estimations for the two coastal nodes analyzed a) Campeche and b) Yucatan
| a) Campeche | ||||||
| Month | E (J/m2) | P (kW/m) | ||||
| Q1 | Q2 | Q3 | Q1 | Q2 | Q3 | |
| Jan | 544 | 1050 | 2080 | 1.98 | 4.44 | 9.98 |
| Feb | 628 | 1030 | 2170 | 2.16 | 3.89 | 9.17 |
| Mar | 604 | 1010 | 1730 | 2.09 | 3.79 | 7.40 |
| Apr | 628 | 1050 | 1770 | 2.32 | 3.93 | 7.13 |
| May | 476 | 905 | 1450 | 1.69 | 3.33 | 5.61 |
| Jun | 291 | 604 | 1080 | 1.90 | 3.82 | 8.93 |
| Jul | 266 | 498 | 905 | 0.82 | 1.66 | 3.25 |
| Aug | 151 | 335 | 641 | 0.44 | 1.04 | 2.17 |
| Sep | 211 | 412 | 846 | 0.71 | 1.43 | 3.13 |
| Oct | 363 | 733 | 1490 | 1.13 | 2.60 | 5.90 |
| Nov | 520 | 951 | 1880 | 1.86 | 3.60 | 7.95 |
| Dec | 604 | 1050 | 2040 | 2.13 | 4.12 | 8.91 |
| b) Yucatan | ||||||
| Month | E (J/m2) | P (kW/m) | ||||
| Q1 | Q2 | Q3 | Q1 | Q2 | Q3 | |
| Jan | 747 | 1210 | 2040 | 2.88 | 4.92 | 8.86 |
| Feb | 654 | 1080 | 1650 | 2.46 | 4.07 | 6.79 |
| Mar | 604 | 1160 | 1900 | 2.26 | 4.54 | 7.84 |
| Apr | 498 | 831 | 1400 | 1.67 | 2.96 | 5.50 |
| May | 363 | 628 | 1010 | 1.24 | 2.26 | 3.86 |
| Jun | 465 | 788 | 1230 | 1.61 | 2.88 | 4.77 |
| Jul | 443 | 667 | 951 | 1.56 | 2.46 | 3.71 |
| Aug | 249 | 423 | 693 | 0.83 | 1.45 | 2.60 |
| Sep | 197 | 373 | 693 | 0.65 | 1.22 | 2.41 |
| Oct | 363 | 706 | 1410 | 1.28 | 2.54 | 5.39 |
| Nov | 680 | 1180 | 2100 | 2.45 | 4.37 | 8.17 |
| Dec | 693 | 1210 | 1970 | 2.61 | 4.81 | 8.09 |
Recall 𝑃𝑚𝑎𝑥 is the maximum electrical power that can be extracted using a buoy and the energy converter device. Using the information of the second quartile alone (median), we estimate that it could be possible to extract a power of around 38 kW throughout the year for both stations.
4 Conclusions
It is imperative to apply new energy alternatives with renewable resources. In this work, in addition to promoting the use of sustainable energy in Mexico due to its vast ocean resources, we contribute to the knowledge of the wave power estimation. We used the values of 𝐻𝑚 and 𝑇 measured at two coastal nodes over the course of 11 years, from 2005 to 2016. With that information, we were able to estimate realistic values for the power extraction. According to our estimations, a power of around 38 kW could be extracted throughout the year for both stations, based on the second quartile in our descriptive statistical analysis.
Importantly, with the estimations presented one can extend our work and take the next step into simulating the electromagnetic performance of electric generators [12, 14].

