


 nueva página del texto (beta)
 Inglés (pdf)
 Artículo en XML
 Referencias del artículo
 Enviar artículo por email
 Citado por SciELO
  Similares en
SciELO
Similares en
SciELO 
 Permalink
1 Introduction
Tuberculosis is a disease that has existed since ancient times, and over the time, it has received several names such as phthisis, the Kings Touch, or The White Plague. In addition, although scientific advances have found better methods for detecting and treating it, the rate of registered cases still represent an important number.
According to the World Health Organization (WHO), tuberculosis (TB) is one of the ten leading causes of death in the world, until 2018 there were more than 10 million people infected with tuberculosis and 1.5 million died with this disease, it is estimated that one third of the world population has latent tuberculosis, with a mortality rate of 16% (registered in 2017 according to the "World TB Report 2017" and emitted by the WHO).
In 1882, Robert Koch discovered the tuberculosis bacillus known as Koch bacillus. In 1905, Robert Koch receive a novel prize for his work.
In 1895, Wilhelm Roentgen discovered the X-rays, which allow the development of more advanced diagnosis for tuberculosis. This allowed a much earlier diagnosis and isolation of infected individuals.
Peru ranks 2nd in the reported cases of tuberculosis in Latin America (WHO 2017). Since tuberculosis is a disease that mainly affects low socio-economic sectors, it is very important that the diagnosis time is shortened as much as possible; in this way the transmission time could be reduced.
The social gap in Peru is one of the factors why this disease is still latent in the lower classes. According to the MINSA in its 2015 report, respiratory diseases such as TB were the main cause of death, and the most affected areas were low-class districts in Lima and the department of Madre de Dios.
Currently, there are models that have been proposed by various authors to detect pulmonary tuberculosis, for example, [1] proposes a solution through a pre-processing to eliminate noise from the image, and then match it with the database of radiography that it has. In [2], it is proposed the use of 3 segmentation methods, for each method indicators are obtained to normalize and obtain a kinship relationship with the data base information. There are also some other models that have been proposed. There are some items that can be improved such as the scale invariance, because the segmentation used by the mentioned studies vary depending on the age of the patient and the convergence of the iterations, and therefore the execution times could be reduced.
In [7], a pre-trained neural network was used to identify radiographies that have TB, combining it with a segmentation of the lung. In [2], the authors propose a different architecture, division of automatically segmented lung fields into four sub regions: central, upper, middle, and lower. Texture scores were computed on the four regions and on the difference in scores between left and right for each corresponding region. Both studies [2-7] used the segmentation of pulmonary radiography.
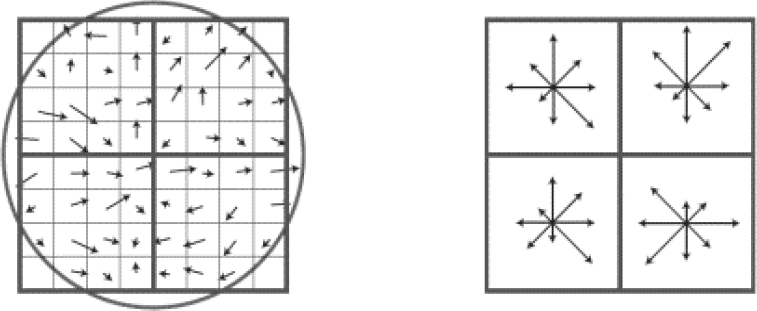
The Scale-invariant feature transform algorithm (SIFT) [16] produces distinctive key points of image characteristics, these points are algorithm invariant to rotation. Other special feature of this is also invariant to escalation. The location of each point of interest found is refined to sub-pixel precision for this the algorithm uses the Taylor series expansion of the space-scale.
There are studies that opt for a scale invariant algorithm to perform the analysis of clinical images such as SIFT. In [3], they give a much more optimal solution than other methods using SIFT with Deep learning in the area of the analysis of mammograms.
In this research, we propose an architecture to detect tuberculosis with image processing on lung radiographs, using the SIFT algorithm and the K-means cluster.
In Section 2, we present the state of the art, which addresses other solutions. These solutions aim to solve the same problem (the one stated in the present study), the importance of the problem is also explained both in social and in research aspects and we have also compared between the architectures proposed by the authors.
In section 3, we propose an architecture to detect tuberculosis with algorithms SIFT and K-means. It expands on the phases that compose it and the processes that allows making a diagnosis.
In section 4, we present experimental design and results. Key points were obtained, and then images were classified to determine if they were “Healthy" or "Sick".
Finally, in section 5, we present discussion and comparison with other research works.
2 State of the Art
The analyzed researches are directly related to the diagnosis of TB, different researchers analyzed below propose architectures, types of analysis for diagnosis, combinations of algorithms to optimize the diagnosis, among others.
On the other hand, the analysis of microbiological photography of the sputum test for diagnosis of TB, it is integrated by article [10]. In this article, they present a new approach to the diagnosis of TB, which aims to analyze a picture of 1 bit of the sputum test.
In the diagnosis by using algorithms of energy of an image in [5], they propose the use of an algorithm to detect the energy that is concentrated. They vary the frequencies of the image to find the most outstanding points of it and do a lung segmentation, but unlike the other group, this one does it by energy.
These items can be classified into 3 important subgroups: Proposals that use segmentation, proposals that use hybrid techniques and proposals that work on image processing.
2.1 Proposals using Deep Convolutional Neural Network
In work [4], they present a method for the detection of tuberculosis by deep learning that classifies lung radiography images into two categories: normal and abnormal, they have used 7-layer CNN and 3 of them are fully connected, achieving an overall precision of 94.73 % and a validation accuracy of 82.09%.
In the research [10], they were able to detect the level of tuberculosis infection using deep learning, they were based on the microscopic and panoramic images of ZNSM-iDB, they managed to extract texture characteristics among others by means of a deep convolutional neural network, finally they classified with FC-SVNN show a maximum accuracy of 0.935
In the study [11], they propose a method for the automatic segmentation of the images of CXR lungs, they reconstruct the lost regions, they used deep convolutional neuronal network, they tested their model with 138 chest X-ray images from Montgomery county Tuberculosis control program, they show its results an average of 96.97% accuracy.
2.2 Proposals that use Hybrid Techniques
In [1], it proposes a segmentation of the lung so that the subsequent analysis is done only in the delimited area and then a clavicle segmentation was made. The first stage covers the preparation and standardization of the radiography to avoid failures due to the scale of the photo (some x-rays may contain parts of the abdomen and arms). The cropped and rescaled image will have a size of 1024pixels. The system consists of 3 subsystems of analysis. These subsystems are analysis of forms, textures and detection of focal lesions that was integrated on a vector of 14 obtained values that are standardized to obtain a final value of relationship.
The proposed architecture uses what is called "Watershed segmentation combined with registration" by using two parameters that they define as sensitivity and specificity; they contrast the results in a data bank of 200 radiographs. By doing this, the proposal is much more sensitive to detection of cavernous cavities of minor size.
In [2], the re-establishment of the image is proposed as the initial stage. Unlike other exposed works, this one uses a neural network in the final stage that analyzed the vector resulting from the algorithms obtained through the lung segmentation.
In [3], they detail and propose their architecture, which differs from the previous ones. These techniques are used to detect cavities in the radiography.
They mix both the segmentation and the classification of points in two different processes that are eventually analyzed by an expert system that will allow the diagnosis. Its architecture can be divided into 3 stages. In the first stage, they found 2 processes.
They help to define, which are the convergence centers of the possible cavities. These cavities were calculated in the next stage. The next stage uses the GICOV algorithm and the circularity algorithm from which an average is obtained.
In the last stage, the segmentation is used to calculate the cavities that are closest to the clavicles, the possible cavities and the cavities calculated in the previous stage are contrasted. Finally, the calculated averages are analyzed by an expert system.
In [5], it is proposed an algorithm to segment a pulmonary radiography by using localized energy and with a normalization of the parameters. The authors propose to generate 6 images varying the image frequency interactively from minor to mayor. Then, by overlapping the images, we can obtain the segmentation areas that increase its intensity according to the color.
In [6], they propose the automation of the tuberculosis diagnosis by two stages: the segmentation of the lung regions, where the indicators under analysis are compared to indicators carried out in a trained system. To train the system, three data sets were used: two for the classifiers and one for the segmentation model:
The first stage is about the implementation of min-cut / max-flow algorithm (Graph cut) that provides the segmentation of the radiography.
The second stage is composed, as mentioned, of two classifiers that provided two results for two types of data.
In the detection of TB in CXR, there are inherent characteristics that are uncertain, to deal with these problems in [12], they propose three methods: the first is a lung segmentation; the second is extraction of the texture characteristic and finally its pixel classification.
The segmented images were classified with the Convolutional neural network. Their results show improvement of the proposal compared to the existing systems. Regarding segmentation in [13], they propose an automatic TB detection system processing chest X-rays applying image processing techniques, followed by adaptive segmentation, then they extract multiple characteristics which are optimized by selecting better characteristics, then for classification they used Neural Networks to classify reaching the maximum curve and an accuracy of 0.99 and 97.03 respectively.
In [15], they propose a method to detect tuberculosis in chest radiographs divided into three stages: first stage they perform lung segmentation with adaptive threshold, the second stage they perform the extraction of characteristics and in the third stage they classify using the K-NN algorithm, they show 90.86% accuracy.
3 Architecture for Detection of Tuberculosis with SIFT and K-Means
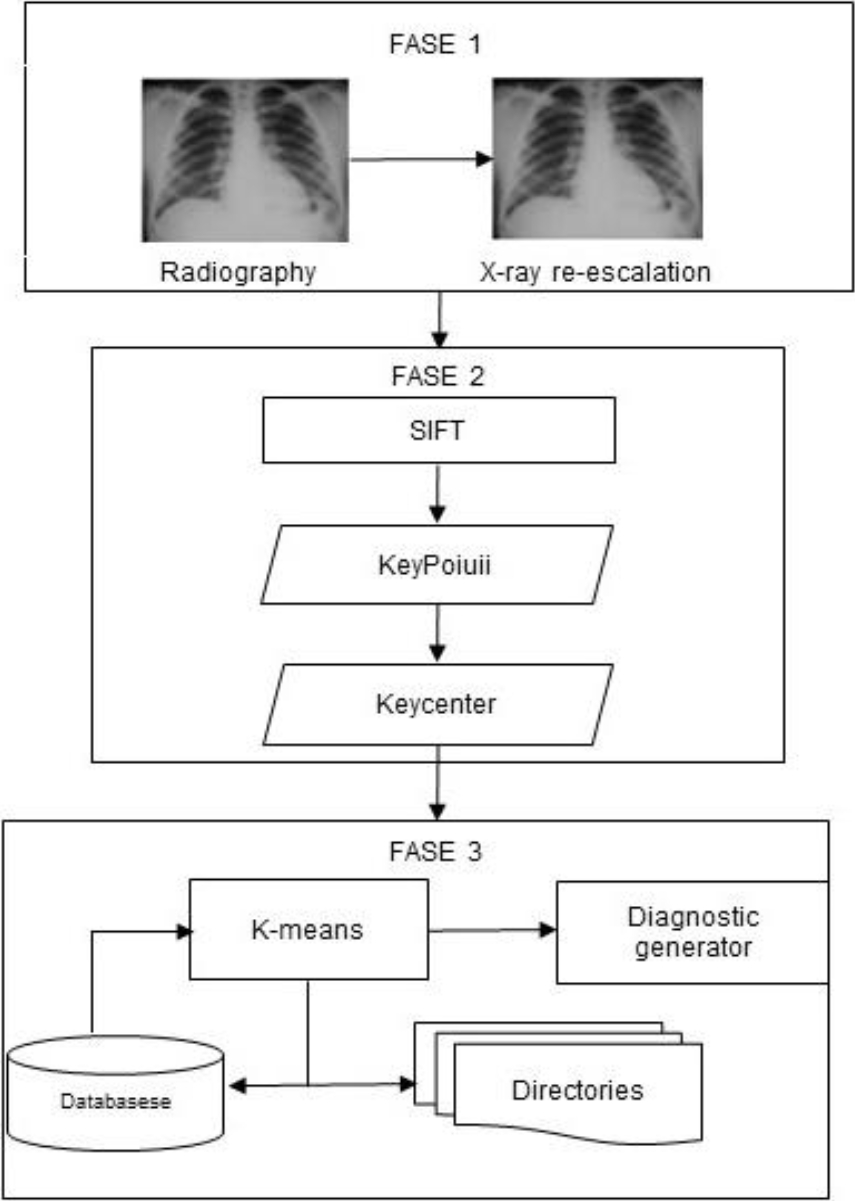
Our architecture is oriented to the diagnosis of pulmonary TB, which is separated into three stages that interact with different components to achieve its purpose.
The components and processes considered in the architecture: Re-scaling of image, calculation of key points, calculation of key center, repositories of radiographs, diagnosis, and results. These components and processes are those in charge of diagnosing the incoming radiography.
This architecture is sub-divided into three sequential stages, and these stages are composed of different processes that determine its start and end.
The Stage 1 is responsible for pre-processing the image to get a standard of it. The stage 2 is responsible for processing the image according to the SIFT algorithm and the normalization of these values to obtain a keyCenter; this keyCenter is input of the last stage (stage 3). The stage 3 is responsible for the classification of the new value, and its preparation to present a diagnosis.
3.1 Pre-Processing of the Image
This process is responsible for standardizing the input image to a resolution of 1024px, for this we use the resize algorithm to be able to rescale the lung radiography.
When receiving the image, the first thing we obtain is the x-ray dimensions (height and width), we calculate the relative percentage with the width, and we use a resize algorithm.
3.2 Calculation of Keypoints
The Scale-invariant feature transform (SIFT) algorithm allows us to extract characteristics from the images of lung radiographs, in this case it allows us to extract the points of interest from the images, this algorithm is better because it is invariant to rescaling and rotations.
The SIFT algorithm allows us to obtain the keypoints of the lung radiography images, these show the characteristics to determine whether there is TB or not.
This process is responsible for obtaining a set of image keypoints, the SIFT algorithm has been used, which returns a set of key points with their attributes, in this work we use the coordinates, radius and angle.
Once the image has been re-scaled, the key points of the radiography are obtained by using the SIFT algorithm.
3.3 Calculation of Keycenter
This process is responsible for normalizing the key point obtained in the previous process. This normalization is made by the calculate for each coordinate, in order to obtain the keyCenter.
The formula come in this equation:
where:
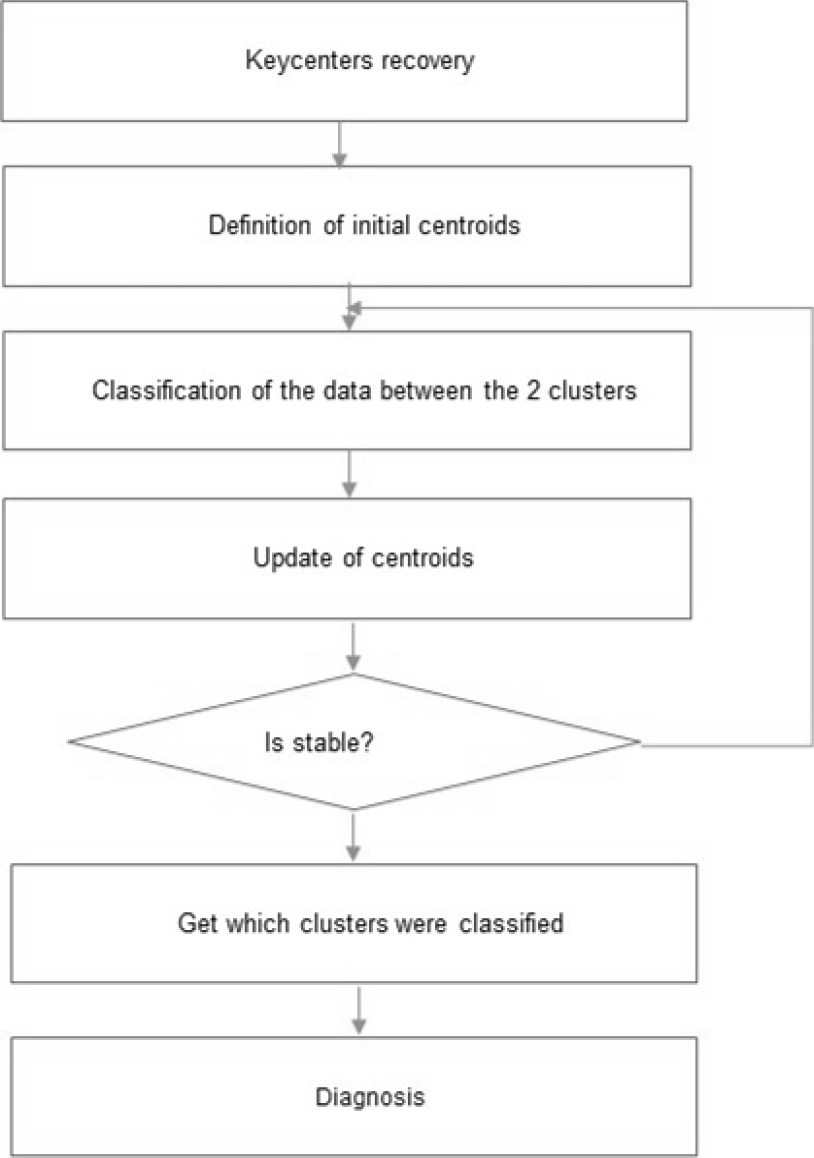
3.4 Classification and Diagnosis with K-Means Algorithm
This process is responsible for issuing a diagnosis of TB.
Considering the keycenters already stored in the previous process, the new keycenter obtained from the image is added, with this data set we proceed to iterate using the k-means algorithm for 2 clusters (HEALTHY AND SICK), in this way the keycenter issues the diagnosis.
We consider the keycenters obtained in the previous process, then we provide it as input for its classification, we submit it to a cluster for its classification, applying the K-means algorithm gives us as a result if there is presence or absence of TB in the image of the radiography provided.
4 Test Design and Results
4.1 Test Design
For testing, the Montgomery County X-ray set dataset with 300 lung radiography images has been used. Of the total radiographs, 270 were taken for training in the model and 30 radiographs were used to test the results.
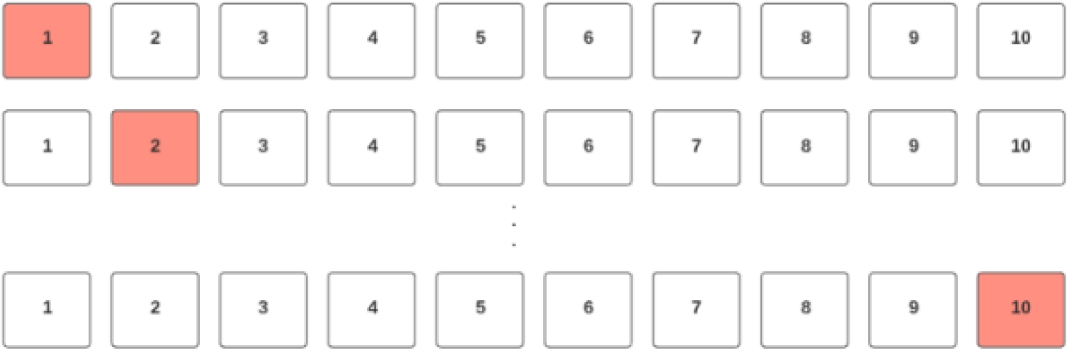
We applied k-Fold Cross-Validation with k=10, i.e., 10-fold cross-validation.
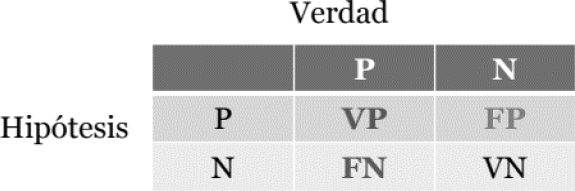
The test used the accuracy and recall metrics as evaluation metrics in figure 6, where:
– VP: True Positives (sick X-rays that were diagnosed sick).
– FP: False Positives (Healthy radiographs that were diagnosed positively).
– FN: False Negatives (Sick X-rays that were diagnosed as healthy).
– VP: True Negatives (Healthy X-rays that were diagnosed healthy).

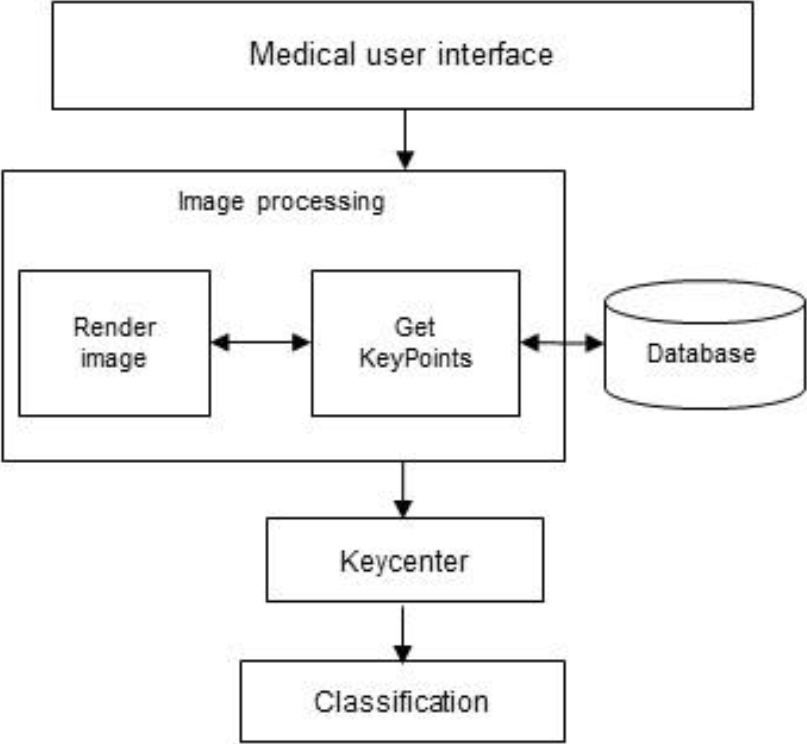
4.2 Design of the Application Tool for the Doctor
We have designed an application tool for the doctor that allows him to detect tuberculosis, to apply he must provide a lung radiography image, as a result the application shows the presence or absence of tuberculosis.
In its process it analyzes the resolution of the image, if it is necessary to perform a rescaling, then performs calculations with the SIFT algorithm, then sends the results to a K-means cluster, finally it is sent for its diagnostic elaboration and is shown to the doctor the result.
We present the architecture of the application as part of the proposal in this research.
4.3 Individual Test Results
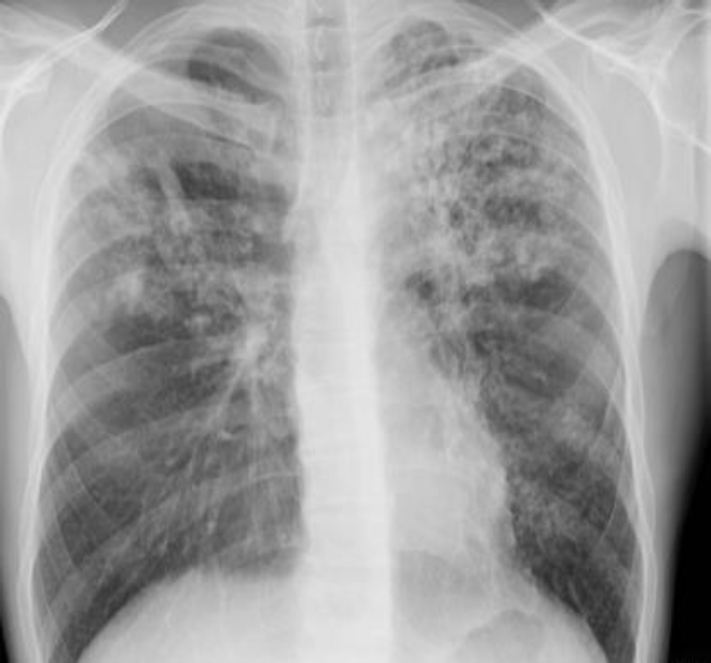
Through the application tool proposed in this work, an x-ray has been provided for the diagnosis, in its process the tool is responsible for rendering the image in a 1024px format, then the tool applies the architecture of detection of pulmonary tuberculosis. For this, it uses the SIFT algorithm to extract characteristics from the image, finally it classifies using the K-Means algorithm.
The lung radiography provided for this test corresponds to a SICK person, that is, he has tuberculosis. Our model must classify whether it corresponds to a HEALTHY or SICK person.
4.3.1 Obtaining Keypoints
The image is submitted to the SIFT algorithm, which returns an array of keypoints, from which we have taken the coordinates: X indicates the vertical position of the point, Y indicates the horizontal position of the point, the radius indicates the intensity of the point interest, and the angle indicates the direction.
4.3.2 Calculation of KeyCenter
Once the keypoints of the image were calculated, the calculation of the keyCenter was carried out, the formula of which is described in Section 3 (Figure 9), as a result we have the point (23.86511267, 25.1990811) as the keyCenter.

4.3.3 Classification with K-Means
The keyCenter obtained in the previous step we put as input for its classification with the k-means algorithm, for this experiment we have used our proposed architecture and its training with 299 radiographs and keyCenters labeled as 150 healthy and 149 sick.
With the previous data, the new keyCenter provided was classified, which has resulted in cluster 2, this indicates (SICK), in this case the classification is correct, the image provided is a lung radiograph of a sick person.
4.4 Group Test Results
Considering the design of the test of the experiment as shown in figure 11. From which 9 groups have been taken for training and 1 group for the test, submitting to the architecture proposed by the tool, the results have been obtained and We evaluate with the metrics: Roc curve, Accuracy and Recall.
4.2 Accuracy and Recall
We have also evaluated our architecture with the precision, accuracy and Recall metrics, 9 tests have been carried out of which in each test we calculate the Accuracy and Recall as we show in the following table.
Table 1 The keyCenters of the trained model
| N° | X | Y | Class |
| 1 | 23.48508774 | 25.9694319 | HEALTHY |
| 2 | 23.19487516 | 24.7495833 | HEALTHY |
| 3 | 24.26868542 | 24.9848992 | HEALTHY |
| 297 | 21.0586106 | 23.7698034 | ILL |
| 298 | 20.6418248 | 24.8170333 | ILL |
| 299 | 21.0544536 | 22.2045722 | ILL |
We calculate the average for precision is 90.302%, the average for accuracy is 89.07%, which reflects the proximity of the correct classification of different measurements in the experiment. In the same way, we calculate the average for the Recall 94.44% metric that indicates the sensitivity.
From the obtained results, we can see that the recall is high, we can observe the decrease of false negatives in the results, and this is a very favorable point for the presented proposal.
On the other hand, the obtained precision is an acceptable value, this is a representation of both true positives and true negatives, there must be taken into account that there is a low rate of false negatives in the recall indicator from which it was deduced. It is interpreted that a large part of the wrong diagnoses are false positives, (healthy patients who were diagnosed as sick) which reduces the negative impact of the errors.
5 Discussions
Our architecture to detect tuberculosis with the SIFT and K-MEANS algorithms was evaluated with machine learning metrics and our main results show that we achieved 90.3% precision, 89.07% accuracy and 94.4% recall, see Table 2, these Results we have compared with other results from other researches, below we present the details of the comparison.
Table 2 The obtained indicators
| N° | Precision | Recall | Accuracy |
| 1 | 90.25% | 95.87% | 90.48% |
| 2 | 90.49% | 96.95% | 87.86% |
| 3 | 90.81% | 94.95% | 89.46% |
| 4 | 88.81% | 93.72% | 89.64% |
| 5 | 91.43% | 96.5% | 87.37% |
| 6 | 89.90% | 94.5% | 87.45% |
| 7 | 89.82% | 95.02% | 89.08% |
| 8 | 90.96% | 89.3% | 90.35% |
| 9 | 89.95% | 96.89% | 89.86% |
| 10 | 90.60% | 90.71% | 89.14% |
| Average | 90.302% | 94.44% | 89.07% |
In the research [6], they proposed an architecture that combines Deep Learning with segmentation techniques to diagnose tuberculosis. They also tested its architecture with different optimizers and various indexes, with a sample space of 800 radiographs, reaching an average accuracy rate of 82.09 %, comparing with our research we managed to improve with 90.3% accuracy.
In the research [5], they propose an algorithm to segment a pulmonary radiograph by localized energy, by means of a normalization of the parameters. In the test, they only considered 100 radiographs achieving an accuracy of 90.90%, comparing with our work we used a greater number of radiographs to analyze the different tests while we achieved 90.30% accuracy, the difference is minimal, it could be said that it is the same but our results show greater reliability by using more tests.
On the other hand, in the study carried out by [7], they used a pre-trained neural network to identify the radiographs that have tuberculosis. In their results, they show 91.20% accuracy, however they only used 78 radiographs, in our research we approached with a little less than 90.30% accuracy in our case, but we maintain better reliability because we have tested our architecture with 300 radiographs.
In the works [10, 11], they apply deep convolutional neural network to detect tuberculosis in chest X-ray images, reaching the accuracy of 93.5% and 96.97% respectively. In our research, we applied another approach with keypoints, although we did not achieve accuracy compared to those with CNN. Nevertheless, our work uses much less computational resources to process images.
6 Conclusions and Future Work
We present a tuberculosis detection architecture with image processing using SIFT and K-means algorithms. This architecture was tested with 300 images classified with 90.30% accuracy. We compared to other contributions and our architecture improves in accuracy.
In the future, the accuracy can be improved using other techniques such as Neural Networks to extract characteristics and then place them in the cluster using K-means.

