


 nueva página del texto (beta)
 Inglés (pdf)
 Artículo en XML
 Referencias del artículo
 Enviar artículo por email
 Citado por SciELO
  Similares en
SciELO
Similares en
SciELO 
 Permalink
1 Introduction
Mobility is the quality of being capable of movement from one place to another. IEEE 802.11 based wireless devices provide this kind of uninterrupted freedom. With the increase in number of wireless users and their highly mobile habits, there is a need to transfer the existing connections of the mobile users to a different access point (AP).
This is necessary to continue their active sessions and this phenomenon is called handoff. This means users’ connections are constantly being switched from one access point (AP) to another. A timely handoff is possible only if the network resources are made available at the next location and the current AP can inform the next AP before the mobile user reaches there. A failure in this process leads to session termination due to the reasons such as delay, lack of resources etc. With the influx of the users and limited available bandwidth, if no prior reservation of the resources is made, there is a possibility that the desired level of Quality of Service (QoS) is compromised.
On the other hand, reserving resources at all neighboring cells leads to wastage of resources. It also significantly increases the blocking rate for new connection requests. Misplaced reservation of network resources will compromise the desired level of QoS and the performance of the network will be degraded.
There are several techniques or approaches for next location prediction of mobile users in wireless local area network (WLAN). One of the existing techniques is the location prediction model for indoor next location prediction [1]. This model was developed for predicting the next location of the customers in a shopping center of about 110mX130m area. However, this approach has some drawbacks.
The area of prediction is fixed as well as small and this approach is applicable for business purpose only. As the area of prediction is fixed and small, this approach is inefficient when the number of locations traversed by the mobile user is large. The Extended Mobility Markov-chain model [2] and the Mixed Markov-chain model overcome the drawbacks of the next location prediction model. But these models have some drawbacks. The Extended Mobility Markov-chain model uses a density based clustering algorithm Density Joinable (DJ) clustering [3], which is a variant of Density Based Spatial Clustering of Applications with noise (DBSCAN) [4] for predicting the next location of the mobile users. But the DBSCAN algorithm fails in case of varying density clusters.
The Mixed Markov-chain uses a variant of K-Means clustering algorithm. However, it requires more execution time for large data sets. It is sensitive to noise and outliers. Hence, an intelligent clustering algorithm is required that works efficiently in case of varying density as well as requires less execution time. It should be robust to noise and outliers. In this paper, a technique named K-Medoids Clustering Based Next Location Prediction has been proposed. The scheme has been developed to predict the next location of the mobile users when the area of prediction is vast.
Rest of the paper is organized as follows. The existing techniques have been discussed in section 2. The proposed K-Medoids Clustering Based Next Location Prediction technique has been presented in section 3. Performance analysis and comparison of the proposed scheme with some of the existing techniques has been discussed in section 4. Finally, the paper has been concluded in section 5.
2 Related Work
In this section, some of the existing schemes have been discussed.
In Indoor next location prediction model, the area is divided into square zones. Each point in the node movement area belongs to a zone. The location data is collected by capturing the Wi-Fi signals, which are emitted from shopper’s tablets, and Wi-Fi enabled smart phones using a set of Wi-Fi routers.
The collected location data is stored in transition table. Using this data, the scheme predicts the next location of the user.
For predicting the next location, the node may use only the current location or it may use last two locations of the mobile user. Although the model is expected to have high accuracy, its implementation also comes with significant overhead of computation power and storage space for learning and storing the generated models. This approach is inefficient if the number of locations traversed by the user is large. The Extended Mobility Markov Chain model [2] and the Mixed Markov-chain model [5] overcome the drawbacks of the indoor next location prediction model.
In Extended Mobility Markov Chain model, a Mobility Markov Chain (MMC) [2, 6, 7] is used. It is a random process, which models mobility behavior of any individual as a discrete stochastic process. The probability of a node moving to a state depends only on the previous visited state and the probability distribution of the transitions between states. In this scheme, Density-Joinable (DJ) clustering [8] technique is used to cluster the movement area of the mobile user. Each cluster contains a point of interest (POI). A transition matrix is computed to record the transitions of mobile users from one POI to another. The next location of the mobile user is predicted based on its last n positions obtained from the transition matrix. The algorithm has been tested using Phonetic dataset [9]. Drawback of this scheme is that number of state increases as size of the system increase.
The Extended Mobility Markov Chain model uses a density based clustering algorithm DJ-Clustering, a variant of DBSCAN (Density Based Spatial Clustering of Applications with Noise) [10], for predicting the next location of the mobile users. However, the DBSCAN algorithm fails in case of varying density clusters.
In Mixed Membership Stochastic Block model [11], users’ situations are analyzed and recognized from the sensor logs. It is a context aware system. A context is defined as combination of features, which are extracted from a set of relational data generated by phone's sensor logs. A set of contexts correlated with a location is extracted by applying a stochastic block model to a graph of relationships between features.
Every context is scored using current features. The location having higher score context is selected as next predicted location.
In Hidden Markov Mobility Model (HMM) [12, 3, 13], only the outcome is visible but the state is invisible to an external observer. Therefore, the parameters are hidden to an observer. In this technique, users’ movement information is extracted using real user dataset. Predictions are made though the HMM which is trained by the user movement information.
Long user movement sequences can be efficiently predicted by this scheme using the observed sequences. For training its learning parameters the technique also uses the successive sequences as observed data. The disadvantage of this model is, it considers that the states are independent. This is usually not true. Another problem with this scheme is that, it does everything in HMM which goes through all possible paths of the model. Therefore, this technique is slower in comparison to other techniques. Hence, an efficient next location prediction technique needs to be developed using such an intelligent clustering algorithm that could be used to predict the next location of the mobile users when the area of prediction is vast.
3 Proposed Scheme
In this section, the proposed K-Medoids clustering based next location prediction technique for mobile users in WLAN has been presented.
The K-Medoids algorithm is a partitioning algorithm [4] related to the k-means algorithm that clusters the data set of n objects into k clusters. It minimizes the sensitivity of k-means to outliers and noise. It picks actual objects from the data set to represent clusters instead of mean values.
Each mining object is clustered with the representative object (Medoid) to which it is the most similar. K-Medoids algorithm [10] is independent of density of cluster. So, it works efficiently in case of varying density. K-Medoids clustering seems to perform better for large data sets. It requires less execution time for large data sets.
The algorithm minimizes the sum of the dissimilarities between each object and its corresponding reference point:
where E is the sum of absolute error for all objects in the data set. P is the data point in the space representing an object and Oi is the representative object of cluster Ci.
The steps for the enhanced K-Medoids based Next Location Prediction Technique are shown in figure 1.

In the first step, the dataset of user movement is studied to observe the mobility behaviors of the users.
From the study of database, the transition traces of each mobile user are observed to determine the most frequently visited locations. Then, these most frequently visited locations are recorded as the POIs for predicting the next location of the users.
The POIs are arranged in descending order of importance, i.e. most frequently visited to least visited locations.
In the second step, the observed POIs or locations traversed by the mobile users are clustered using K-medoids clustering [10] technique. By means of clustering, the POIs are grouped into a predefined fixed number of clusters, based on distance between the locations. The locations that are grouped in any of the clusters do not appear in other clusters, i.e. each location appears in one cluster only. In the third step, a transition traces chain table is created where transitions of all users are recorded. Let the POIs are clustered into 5 clusters which are named as c1, c2, c3, c4 and c5. The transition trace chain is shown in table 1.
Table 1 Transition traces chain table
| MAC address | Location 1 | Location 2 | Location 3 | ... | Location N4 |
| #1 | c1 | c4 | c2 | ... | c4 |
| #2 | c1 | c3 | null | null | null |
| #3 | c4 | c1 | c4 | ... | null |
| #4 | c5 | Null | null | Null | null |
The first column of the transition table represents the MAC addresses of the WLAN devices. Location 1 to Location N represent the locations visited by the users sequentially. For example, if the device having MAC address #1, starts its movement from c1, then it moves to c4 and c2 and lastly it goes to c4, the entry corresponding to MAC address #1 will be represented as c1 → c4 →c2 → ... →c4.
In data filtering step, the transition traces are filtered based on number of transitions available for each user. For next location prediction of mobile users in WLAN, n=1 and n=2 models were built.
For n=1, at least one transition trace of the mobile user must be known. From the transition trace table shown in table 1, it is clear that no transition trace is known for MAC address #4. So, the next location of MAC Address #4 cannot be predicted using either n=1 model or n=2 model. For n=2 model, at least two transition traces must be known. From the transition trace table, it is clear that only one transition trace is known for MAC address #2. So, the next location of MAC address #2 cannot be predicted using n=2 model.
In the fifth step transition table is formed. For n=1 model, a k X k transition table is formed where k represents the number of clusters. Since, in the example 5 clusters are formed; a 5 X 5 transition table is created. Table 2 shows the transition table formed for n=1 model. The rows of the transition table represent the current location and the columns represent the next location of the mobile user.
Table 2 Transition table for n=1 model
| c1 | c2 | c3 | c4 | c5 | |
| c1 | 0 | 0 | 1/3 | 2/3 | 0 |
| c2 | 1/4 | 0 | 0 | 2/4 | 1/4 |
| c3 | 0 | 1/3 | 0 | 0 | 2/3 |
| c4 | 2/4 | 0 | 1/4 | 0 | 1/4 |
| c5 | 0 | 2/4 | 1/4 | 1/4 | 0 |
The corresponding elements of the table represent the probability of transition from current location to the corresponding next location.
The probability of transition was computed as follows:
Cumulative Frequency [c1-> any other location] equals to:
Therefore, probability of movement from c1 to c4 equals to: P(c4/c1) = 2/3.
For n=2 model, a k2 X k transition table is formed where k represents the number of clusters. Since, 5 clusters are considered; a 25 X 5 transition table is formed. Table 3 shows the transition table formed for n=2 model. The rows of the transition table represent the previous location and current location of the mobile user and the columns represent the next location of the mobile user. The corresponding elements of the table represent the probability of transition from previous location and current location to the corresponding next location.
Table 3 Transition table for n=3 model
| c1 | c2 | c3 | c4 | c5 | |
| c1->c1 | 0 | 1/4 | 0 | 1/4 | 2/4 |
| c2->c2 | 2/4 | 0 | 1/4 | 0 | 1/4 |
| ... | |||||
| ... | |||||
| c5->c4 | 2/3 | 0 | 1/3 | 0 | 0 |
| c5->c5 | 0 | 1/4 | 2/4 | 1/4 | 0 |
For n=1 model, the next location of the mobile user is predicted by finding the next location with highest probability of transition from the given current location. For n=2 model, the next location of the mobile user is predicted by finding the next location with highest probability of transition for given current location and previous location.
4 Implementation and Performance Analysis
The enhanced K-Medoids based next location prediction scheme is implemented using MATLAB. The proposed approach has been tested on the Geolife Trajectories 1.3 [14, 15, 16, 17] database for predicting next location of users. The number of correct predictions is determined by matching the predicted next locations with the actual next locations traversed by the users.
The accuracy of prediction is determined by finding the percentage of correct predictions made using the proposed scheme. Accuracy of the enhanced model is compared to that of the existing model to determine the efficiency of the algorithm.
In the physical design of the proposed scheme, clustering of locations traversed by the users and construction of the transition traces chain table, filtered transition traces table as well as the transition tables will be performed by the Network Operations Centre (NOC). The constructed tables will be stored in the centralized wireless Access Point Controller (APC) which is capable of computations to make the prediction.
The APC manages all the wireless access points in the WLAN. The APC is responsible for the allocation of resources, which are being used by the clients of the WLAN, to the respective Wireless APs. The NOC controls and manages the Wireless LAN Controllers. The NOC will perform the task of clustering the POIs, constructing the required tables for next location prediction, and then storing the tables in the APC. The APC will make the mobility predictions in order to allocate the network resources in an efficient way.
For implementation in MATLAB, at first, the user databases are loaded and the locations traversed by each user are clustered using the K-Medoids clustering algorithm [10].
In the next step, the transition traces chain table is created. In the transition traces chain table, all the transitions of the users are recorded consecutively.
Table 4 shows the transition traces chain table of 10 users from the Geolife Trajectories 1.3 dataset. The consecutive transitions of each user from one cluster to another cluster have been recorded. In the next step, the transition traces chain table is filtered. In this step, the transitions of the identical clusters that are recorded in the transition traces chain table are eliminated and thus the table is filtered.
Table 4 Transition traces chain table
| 1 | 2 | 3 | 4 | 5 | 6 | 7 | 8 | 9 | 10 | |
| 1 | ‘U 1’ | 1 | 1 | 1 | 3 | 3 | 4 | 8 | 5 | 5 |
| 2 | ‘U 2’ | 2 | 2 | 2 | 2 | 110 | 5 | 5 | 5 | 6 |
| 3 | ‘U 3’ | 1 | 1 | 1 | 34 | 35 | 35 | 36 | 36 | 36 |
| 4 | ‘U 4’ | 1 | 41 | 41 | 42 | 63 | 39 | 60 | 60 | 39 |
| 5 | ‘U 5’ | 1 | 3 | 2 | 3 | 3 | 4 | 4 | 4 | 5 |
| 6 | ‘U 6’ | 1 | 3 | 3 | 3 | 3 | 4 | 4 | 4 | 5 |
| 7 | ‘U 7’ | 1 | 10 | 9 | 10 | 4 | 4 | 4 | 3 | 5 |
| 8 | ‘U 8’ | 1 | 4 | 2 | 3 | 3 | 4 | 4 | 4 | 2 |
| 9 | ‘U 9’ | 1 | 1 | 11 | 11 | 2 | 2 | 3 | 5 | 5 |
| 10 | ‘U 10’ 1 | 2 | 2 | 3 | 3 | 3 | 4 | 4 | 5 |
Table 5 shows the filtered transition traces chain table of 10 users from the Geolife Trajectories 1.3 dataset whose transition traces chain table is shown in table 4. Here, the transitions recorded in the transition traces chain table have been filtered and the repeated identical locations (clusters) where the next location is the same as the current location (cluster) of a user have been eliminated.
Table 5 Filtered transition traces chain table
| 1 | 2 | 3 | 4 | 5 | 6 | 7 | 8 | 9 | 10 | |
| 1 | ‘U 1’ | 1 | 3 | 4 | 8 | 5 | 6 | 7 | 5 | 9 |
| 2 | ‘U 2’ | 2 | 110 | 5 | 6 | 8 | 9 | 10 | 74 | 11 |
| 3 | ‘U 3’ | 1 | 34 | 35 | 36 | 5 | 38 | 29 | 6 | 39 |
| 4 | ‘U 4’ | 1 | 41 | 42 | 63 | 39 | 60 | 39 | 60 | 6 |
| 5 | ‘U 5’ | 1 | 3 | 2 | 3 | 4 | 5 | 6 | 7 | 27 |
| 6 | ‘U 6’ | 1 | 3 | 4 | 5 | 6 | 7 | 8 | 9 | 10 |
| 7 | ‘U 7’ | 1 | 10 | 9 | 10 | 4 | 3 | 5 | 3 | 6 |
| 8 | ‘U 8’ | 1 | 4 | 2 | 3 | 4 | 2 | 5 | 6 | NaN |
| 9 | ‘U 9’ | 1 | 11 | 2 | 3 | 5 | 6 | 7 | 8 | 9 |
| 10 | ‘U 10’ | 1 | 2 | 3 | 4 | 5 | 6 | 66 | 7 | 65 |
Table 6 shows the transition table built for the user from the Geolife Trajectories 1.3 dataset. The first column of the transition table represents the current location (cluster) of the mobile user and the first row represents the next location (cluster) of the mobile user. The corresponding elements of the table represent the probability of transition from current cluster of locations to the corresponding next cluster of locations. Next location of the user is determined by entering the current location of the user.
Table 6 Transition table showing probability of transition of each user
| 1 | 2 | 3 | 4 | 5 | 6 | 7 | |
| 1 | NaN | 1 | 4 | 2 | 3 | 5 | 6 |
| 2 | 1 | 0 | 1 | 0 | 0 | 0 | 0 |
| 3 | 4 | 0 | 0 | 1 | 0 | 0.5 | 0 |
| 4 | 2 | 0 | 0 | 0 | 0.5 | 0 | 0 |
| 5 | 3 | 0 | 1 | 0 | 0 | 0 | 0 |
| 6 | 5 | 0 | 0 | 0 | 0 | 0 | 1 |
| 7 | 6 | 0 | 0 | 0 | 0 | 0 | 0 |
Let current location of the user whose next location needs to be predicted has been entered as latitude 39.9813 and longitude 116.32785. Then, the proposed scheme determines the cluster number in which the user is currently located. Let current cluster number of the user is 2.
The K-Medoids based Next Location Prediction Model predicts the next cluster number of the mobile user.
For performance analysis, the accuracy of predicted next location of the users is determined using the formula:
Figure 2 shows the accuracy of prediction for 10 test cases. In the figure, the X-axis represents the test case number. The Y axis represents the accuracy of prediction for each test case. From this figure, it is evident that the accuracy of the enhanced scheme for next location prediction ranges from 67% to 97%.

Figure 3 shows the comparison of accuracy of the proposed scheme with that of existing indoor next location prediction model and mixed Markov chain model.

The figure indicates that the proposed enhanced K-Medoids based Next Location model achieves higher accuracy than that of both the existing schemes. In the Indoor Next Location Prediction Model, only one location is predicted as the next location of the user.
If the user has travelled to more than one location from a single location, the accuracy of prediction by the existing scheme reduces. Since the Point of Interests (locations) is clustered in the enhanced scheme, there is a possibility that multiple locations traversed by the user falls under the same cluster. Therefore, the accuracy of prediction of the enhanced scheme is higher.
Moreover, the mixed Markov chain model is based on the K-Means clustering algorithm, whereas the enhanced scheme is based on K-Medoids clustering algorithm.
The K-Medoids clustering technique is more robust to noise and outliers as compared to the K-means clustering technique. Thus, enhanced Scheme could achieve higher accuracy than the MMC Model.
Figure 4 shows a comparison of the proposed scheme with indoor next location prediction model and mixed Markov chain model considering the execution time. It can be observed from the figure that the enhanced K-Medoids clustering based next location prediction model requires less execution time compared to the existing schemes.

Thus, the enhanced K-Medoids clustering based next location prediction is more efficient than the existing models for next location prediction. Figure 5 shows the comparison of prediction accuracy of the proposed technique for different values of k, where k represents the number of cluster formed after clustering the locations traversed by the users using the K-Medoids clustering.

From the figure, it is evident that the accuracy of prediction increases when the number of clusters formed is increased. Since the accuracy of prediction is directly proportional to the number of transitions known, the accuracy of prediction is more when more number of clusters is formed.
Figure 6 shows the comparison of execution time of the proposed technique for different values of k, where k represents the number of cluster formed after clustering the locations traversed by the user using the K-Medoids clustering algorithm.
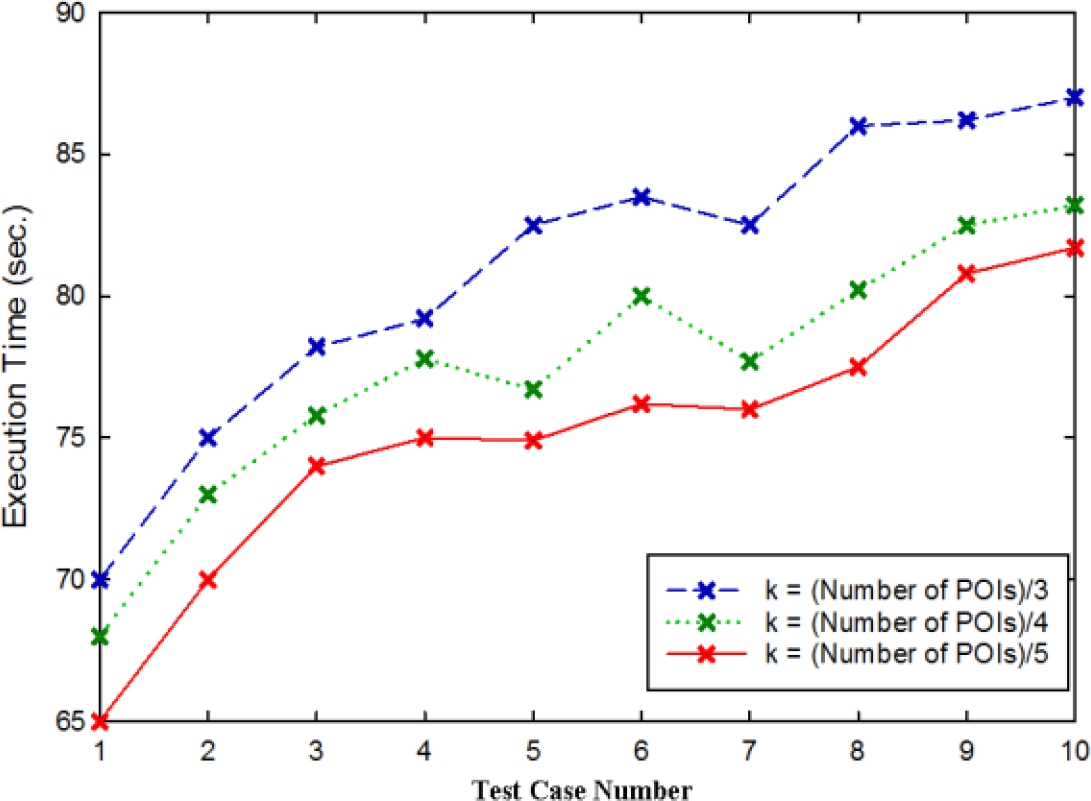
From the figure, it is evident that the time required for execution of the enhanced prediction algorithm increases when the number of clusters formed is increased.
Since the time required for loading the clustered instances is directly proportional to the number of clusters formed, when the number of clusters formed is more, the time required for loading the clusters increases while predicting the next location of the user.
Hence, the time required for executing the next location prediction algorithm increases. Similarly, when the number of clusters formed is less, the time required for loading the clusters decreases and thus, the time required for executing the next location prediction algorithm decreases.
5 Conclusions and Future Work
In this paper, a K-Medoids clustering based next location prediction technique has been proposed for WLAN. The proposed technique has been compared with indoor next location prediction model and mixed Markov chain model considering Geolife Trajectories 1.3 dataset. Implementation results show that the accuracy of the proposed scheme ranges from 67% to 97%, which is higher than the accuracy of the existing schemes. Moreover, the proposed technique requires less execution time. It can also be concluded from the results of performance analysis that the accuracy of prediction as well as the time required for execution by the proposed K-Medoids based Next Location Prediction model is directly proportional to the number of clusters formed. Thus, increasing the number of clusters will increase the accuracy and execution time of the proposed scheme.
In order to further improve and testify the performance of the enhanced K-Medoids based Location Prediction technique, the n>1 models for next location prediction can be built and implemented, where n represents the number of previously traversed locations known.
The n=2 model holds in memory two previously traversed locations which are named as the previous location and the current location based on which the next location of the user is predicted.
The n=3 model holds in memory three previously traversed locations in order to predict the next location of the users, and so on.

