


 nova página do texto(beta)
 Inglês (pdf)
 Artigo em XML
 Referências do artigo
 Enviar este artigo por email
 Citado por SciELO
  Similares em
SciELO
Similares em
SciELO 
 Permalink
1 Introduction
The excessive use of computers to produce and manage information around the world has caused an uncontrolled increase in textual information that abounds mainly on the Internet, causing an explosive growth of information overload and resulting very difficult to extract the most valuable information for a specific topic. In order to deal with this problem, there are some proposals such as information retrieval systems, which seek information in a collection of documents and retrieve the most relevant resources based on a specific search [8]. This requires techniques in the process of understanding natural language and is where the recognition of named entities and their effective identification play an important role in information retrieval tasks.
The present research work concerns the construction of a classifier in the task of Named Entity Recognition (NER) based on a data structure represented by a graph with enriched grammatical functions. These functions aim to improve the correct recognition of named entities in order to obtain a better representation of documents and in this way facilitating some tasks associated with the understanding of texts such as classification of texts and information retrieval. The technique of storage and enrichment of named entities proposed here is based on a graph structure, where we have nodes and weights in the links that connect to the nodes, and alternative nodes have been added to the original ones based on their synonyms.
The alternative routes are created from the synonyms of the parts that make up the entities, thus the classifier can recognize named entities where their components have some relationship with the original entities of the initial corpus. Our proposed NER classifier is compared with other NER classifiers, showing the best results in the Recall measurement but with very poor levels in terms of Precision. It demonstrates an inverse behavior compared to other classifiers, which stand out with a high Precision but a low Recall. Its performance in general through the F1 measure denotes just being below the results obtained by the CRF++ classifier [9]. The results obtained from the classifier are analyzed and discussed.
In summary, this research paper presents a proposal of representation of named entities through a graph structure, exploiting the use of semantic relationships such as synonyms.
The final result obtained is an enriched graph that represents the named entities of a set of documents used as Gold Standard. Thus expanding the correct recognition of named entities in texts.
The rest of this paper is organized as follows. Section 2 shows the state of the art. In section 3, the preliminaries and background related are presented. In section 4, the proposed structure is explained including its construction. Section 5 presents the case study of the classifier, defining the corpus employed, pre-processing of data, measures used to compare the performance as well as the results obtained in comparison with other NER classifiers and a discussion of them. Finally, section 6 ends by showing the contributions made with this research work as well as the mention of future steps.
2 State of the Art
Text Mining [13] is the process of Information Retrieval (IR), Named Entity Recognition and Information Extraction (IE). Text mining is "The discovery by computer of new, previously unknown information, by automatically extracting information from different written resources" [6].
Information retrieval is the task of extracting information from a collection of resources of an unstructured nature that satisfies an information need, generally textual data [7]. In the last years, the task of extracting meaningful data of text has gained the attention in researcher and industry fields [21].
Since information extraction is considered as a limited form of full natural language understanding, where the information we are looking for is known beforehand. It includes two fundamental tasks, Named Entity Recognition and Relation Extraction (RE) [1].
Named Entity Recognition seeks to identify and classify references to named entity mentions in unstructured text into predefined classes [15].
In the task of named entity classification, Mohamed and Oussalah [12] presented an approach by using the Wikipedia article info-boxes where it has significantly reduced the classifier’s processing time since the information inside the info-box is structured. The proposed approach achieved a classification accuracy of above 97% with 3600 named entities and CoNLL-2003 shared task NER dataset used to validate the classifier’s performance.
In the task of Named Entity Recognition in Tweets, Ritter et al [19] proposed a distantly supervised approach which applies Labeled LDA to leverage large amounts of unlabeled data in addition to large dictionaries of entities gathered from Freebase, and combining information about an entity’s context across its mentions. This because classifying named entities in tweets is a difficult task since tweets contain a plethora of distinctive named entity types (Companies, Products, Bands, Movies and more), and almost all these types are relatively infrequent. On the other hand, tweets often lack sufficient context to determine an entity’s type without the aid of background knowledge.
2.1 Graphs as a Text Representation Structure
A detailed study of different uses of graphs for natural language processing tasks is explained in [10], where it presents algorithmic formulations for:
— Synonyms detection,
— Measures of semantic distance on semantic networks,
— Textual entailment,
— Word-sense disambiguation,
— Sentiment classification.
In addition to the algorithms and applications covered in [11] several research works have used graphs for representing text data and solving many natural language processing problems.
In the task of document representation, Pinto et al. [18] and Gómez-Adorno et al. [5] proposed a reliable graph-based representation schema of textual documents that incorporates different levels of formal representation of natural language, and taking into consideration many linguistic levels, such as lexical, morphological, syntactical and semantics and by also extracting useful text patterns in the graph. They state the successful use of their schema in the broader framework of document understanding.
3 Preliminaries and Background
Graphs are a powerful representation of natural language because it is easy to map the syntactic relationships that exist between words or even concepts, thus clearly showing the way they connect with each other.
3.1 Graph Structure
A graph
Depending on the application for the graphics to be used, the nodes and edges can represent a variety of units and links. Nodes can represent text units as basic as words or as complex as documents.
The edges can represent the relationships between these text units, such as: co-occurrence, placement, syntactic structure and lexical similarity [17].
3.2 Named Entities
NER is an important task in the field of information extraction systems since it aims to locate and classify named entities in raw text into categories previously defined (e.g. Person, Location, Organization). In this way, texts can be represented by their named entities. It is emerged in the Sixth Message Understanding Conference in 1995 [12]. Although, sometimes many of the named entities can be ambiguous to be classified in more than one class, e. g. the automotive company created by Henry Ford in 1903, where “Ford“ can be referred to many entities (Name, Company, etc.).
On the other hand, NER systems require a large amount of highly accurate training data to perform well at the task named entities recognition [20]. In this way, excellent training data can be achieved by human feedback, since humans can easily differentiate from one context and another, assigning the correct tag to each named entity in the texts.
4 A Graph Schema for Representing Named Entities
In this section, the graph schema with enriched language functions is presented and explained. The objective of storing the named entities in a graph is to achieve an expansion in the recognition of named entities through enriched language functions, where synonyms are included as well as semantically similar expressions.
The formal definition of graph proposed to represent these named entities and their relationships, is as follows:
where
The way in which this structure is built and its operation are explained as follows.
4.1 Syntax and Structure
The graph is constructed from a finite set of named entities is stored in a .json file. Thanks to the simplicity of this format, it allows great ease of use for many programming languages and also due to its lightness in data storage. Since the JSON objects are a key-value data format it is convenient to use them to store the information of named entities.
The format used as well as each of the characteristics of the entities that have been employed are illustrated in Figure 1.
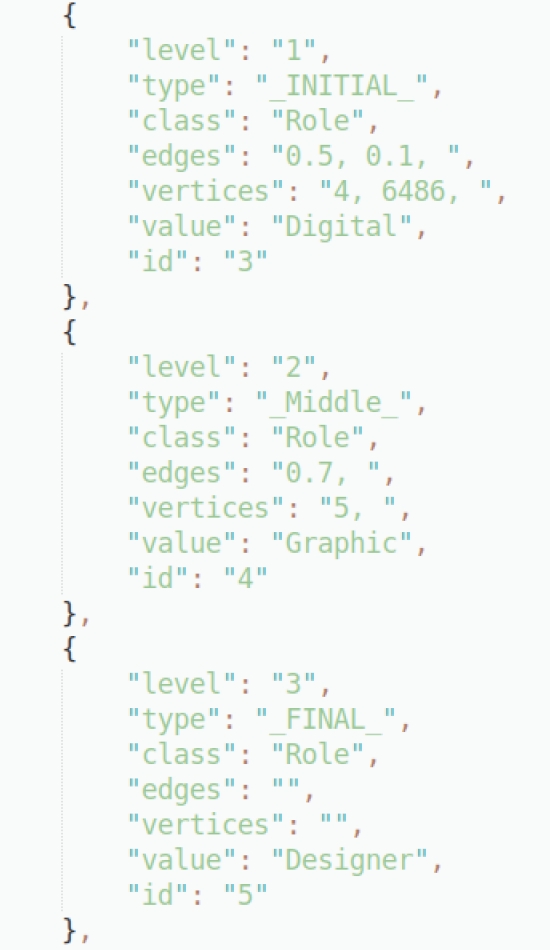
Each node is represented with two curly brackets that encapsulate its properties in key-value pairs populating the space between them. These properties are:
— Level: Represents the depth level of the node in the graph.
— Type: Each node in a sequence has a state, as shown in Figure 2. For example, in the sequence: Full Stack Developer, the initial node in the sequence is Full, after that the intermediate node is Stack, and Developer is a final node.
— Class: The class refers to the label assigned to that entity of which the node is a part.
— Edges: It contains a list of the weights corresponding to each edge that binds that node with others.
— Vertices: It contains a list of references to the id’s of the vertices with which that node is connected.
— Value: It is simply a word, or in other words it is a sub-string of the named entity of which it is a part.
— Id: The Id or key, is the characteristic through which the node is recognized and needs be unique.

4.2 The Process of Construction
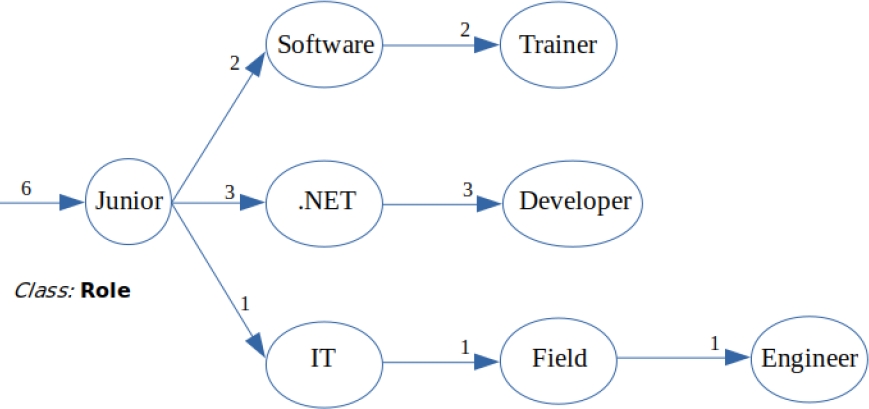
The set of named entities that are used as Gold Standard is stored in this graph structure, reading one entity at a time until all are completed. The graph begins with a single root node from which branches are added based on the different categories or classes existing for the set of named entities.
In the process of construction of the graph the following steps are taken into consideration:
— Named entities are tokenized.
— For each initial token of the named entity, it is verified if it already exists in the graph with that value and that class. If the entity with that value exists but its class is different then another branch is created from the single root node. If it exists as such, then the weighting of that edge is increased.
— For the intermediate tokens it is verified if that node already exists after the one preceding it. If the node already exists then the weighting of that edge is increased, if it does not exist, then another edge is created starting from that previous node.
— It may be the case where a named entity exists completely the same and then it only increases the weights, but if there is a variation in one or more tokens then it creates alternate branches. All mentioned before is shown in Figure 3.
5 Case Study: NER
In order to analyze the performance of the structure proposed in this research work, the recognition of named entities comparison is held with other Named Entity Classifiers such as: Stanford NER [4] and CRF++ [9]. The corpus used for the experiment as well as the evaluation measures and methods are explained below.
5.1 Used Corpus
The corpus was constructed by the collaborative web-based tagger tool for named entities developed in [14]. Since this tool is easy to use and intuitive, allowing to create the necessary classes as well as a fast labeling of documents in plain text. And finally getting the documents labeled in a structured double column format that contains the data prepared to be used in the training of a classifier model provided by Stanford NER [16]. The first column contains the words or tokens of the document and the second column represents the class to which it belongs if it belongs to one, in other cases the value of the second column is 0.
The corpus is made up of job offers in the field of IT, where these documents can be represented by the most relevant concepts it contains. These concepts are grouped into 6 predefined classes:
— Role: The position or purpose that someone or something has in a situation, organization, society or relationship.
— Knowledge: Understanding of, or information about a subject that someone get by experience or study.
— Skill: An ability to do an activity or job well, especially because you have practiced it.
— Character: The particular combination of qualities in a person or place that makes them different from others.
— Responsibility: Something that it is your job or duty to deal with.
— Talent: Someone who has a natural ability to be good at something, especially without being taught.
All definitions for classes were taken from the Cambridge Advanced Learner’s Dictionary & Thesaurus [3].
5.2 Data Pre-Processing
To carry out the pre-processing of the information, the same software used to label the documents [14] allows to export them to a structured double-column format, as well as to download the corpus in two data sets: one for training and one for testing (always in a random way, which is perfect for this task.).
It has been implemented considering the principles of V-fold cross-validation method. So, only 25% of the whole data set is taken as validation data for testing the model and the remaining 75% is used as training data (corpus). The cross-validation process is then repeated 10 times, each time with random sets of documents (for both the training data set and the test data set) [2].
5.3 Measures and Training
In order to measure the performance of the NER classifiers, three well known measures are taken into consideration: Precision, Recall and F1. To calculate those measures, first is important to define four main aspects (as shown in Figure 4):
— True Positive (TP): It means that the class predicted by the classifier is the same class that is actually assigned originally.
— False Negative (FN): It is when the word has a class assigned, but the classifier can not predict a class.
— False Positive (FP): It is when the word has not originally assigned a class, but the classifier predicts a class.
— True Negative (TN): It is when the word has not originally assigned a class, and the classifier also fails to assign a class.

Once knowing the essentials of the different metrics, it is possible to define the performance measures in the following way:
— Precision is estimated by
— Recall is calculated by
— F1 is calculated by
5.4 Experiments
For the training of the classifiers, 75% of the documents were randomly obtained with the collaborative web-based tagger tool and the remaining 25% was used to test the classifier, repeating the process 10 times and using exactly the same sets for the 3 classifiers.
The results obtained for the different classes were averaged by execution and classifier due to the large amount of data, and then contrasted according to the three measurements, these results are presented in detail in Table 1. From the results shown in the table it is possible to observe that the best scores for Precision are always achieved by the CRF++ classifier, leaving far below the graph proposed in each execution. This means that the number of false positives produced by the CRF++ classifier is very low, or in other words when the model predicts a class for a named entity, it is correct on average 75% of the time.
Table 1 Classifier results with V-fold Cross Validation method for Precision, Recall and F1
| Execution | Measure | Proposed Graph | Stanford | CRF++ |
| 1 | Precision | 0.25618 | 0.67076 | 0.71849 |
| Recall | 0.66611 | 0.42474 | 0.22176 | |
| F1 | 0.37005 | 0.52012 | 0.33891 | |
| 2 | Precision | 0.24547 | 0.65652 | 0.77021 |
| Recall | 0.67437 | 0.48019 | 0.28681 | |
| F1 | 0.35993 | 0.55468 | 0.41798 | |
| 3 | Precision | 0.26301 | 0.71343 | 0.75432 |
| Recall | 0.62482 | 0.42897 | 0.22320 | |
| F1 | 0.37019 | 0.53579 | 0.34448 | |
| 4 | Precision | 0.23069 | 0.69565 | 0.82876 |
| Recall | 0.63487 | 0.44792 | 0.23922 | |
| F1 | 0.33841 | 0.54495 | 0.37127 | |
| 5 | Precision | 0.24676 | 0.70243 | 0.77997 |
| Recall | 0.67871 | 0.44562 | 0.23541 | |
| F1 | 0.36193 | 0.54530 | 0.36167 | |
| 6 | Precision | 0.25362 | 0.71091 | 0.80290 |
| Recall | 0.66431 | 0.47102 | 0.26412 | |
| F1 | 0.36709 | 0.56662 | 0.39748 | |
| 7 | Precision | 0.24154 | 0.66375 | 0.75612 |
| Recall | 0.64164 | 0.42109 | 0.22272 | |
| F1 | 0.35096 | 0.51528 | 0.34409 | |
| 8 | Precision | 0.20970 | 0.56629 | 0.71989 |
| Recall | 0.65850 | 0.47696 | 0.25311 | |
| F1 | 0.31810 | 0.51780 | 0.37454 | |
| 9 | Precision | 0.23048 | 0.68721 | 0.75550 |
| Recall | 0.65269 | 0.47739 | 0.25781 | |
| F1 | 0.34067 | 0.56340 | 0.38443 | |
| 10 | Precision | 0.24207 | 0.66593 | 0.75528 |
| Recall | 0.61821 | 0.44444 | 0.24035 | |
| F1 | 0.34792 | 0.53309 | 0.36466 |
On the other hand, as regards the Recall measure, the highest scores are always reached by the proposed graph, showing a great difference in contrast with the CRF++ classifier.
This means that the number of false negatives produced by the proposed graph is low, or what in other words happens is that the proposed graph correctly recognizes on average 64% of the named entities.
However, the best results obtained in the F1 measure are always achieved by the Stanford classifier, which means that this classifier has a better balance between Precision and Recall, making it the best performing classifier of the three. For a better understanding of these results, the averages have been captured in charts (from Figures 5 to 7) where it is easy to appreciate the variations and levels reached by each classifier.
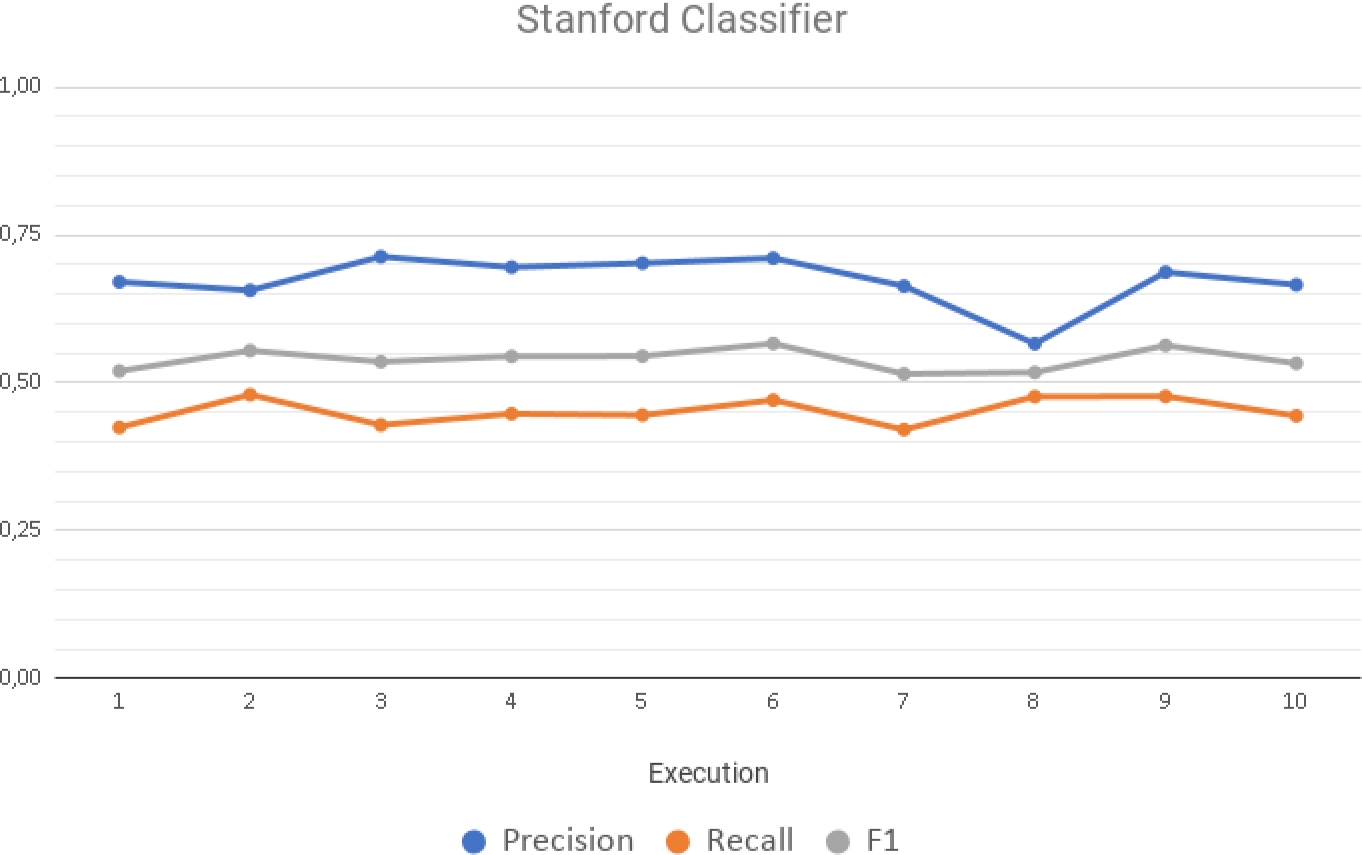


The Precision, Recall and F1 measures for the Stanford classifier can be seen in Figure 5, where Precision values are maintained between 65% and 71% in all iterations, with the exception of execution 8, where it drops surprisingly to 56%. This happens because not all documents have the same number of examples for each class. So, in this execution part of the documents that were used for the training provided very few examples of each class in comparison with the other executions.
Regarding the measure of Recall, the values are kept constant in an interval ranging from 42% to 48% throughout the experiment. Finally, the F1 measure remains with small variations between 51% and 56% throughout the experiment, showing good performance for the Stanford Classifier.
The second classifier to be compared is CRF++ classfier, and its results for Precision, Recall and F1 measures are showed in Figure 6. Here can be observed that the performance of the Precision measure is very high compared to the Stanford classifier, being the minimum value reached in iteration 1 with 71% and the maximum value reached in execution 4 with a value of 82%, and the other obtained values oscillate between these two ranges without presenting as major variations. In contrast, the Recall measure is shown too low with a minimum value of 22% in execution 1 and a maximum value achieved in execution 2 with 28%. Presenting even more slight variations in the rest of the executions throughout the experiment. This means that a large number of false negatives is produced by the classifier, or in other words, few truly relevant results were returned. With measures so distant from each other, the F1 measure is maintained in a range that goes from 33% to 41%.
Finally, the results of the graph-based structure proposed are shown in Figure 7. The results are opposite to those of the other classifiers with respect to Precision and Recall since the values appear to be inverted, with a very low Precision but a very high Recall. For the Precision it can be observed that the values remain very similar with a range that goes from 20% to 26%, meaning that, when the classifier predicts a class for a given named entity, it is correct on average 23% of the time. This happens because the proposed model produces a huge number of false positives, so, this model could be improved if a balance of the used classes were achieved.
In the same way for Recall the values remain little variant between 61% and 67%, which shows a more uniform behavior throughout the experiment in comparison with the Stanford and CRF++ classifiers, this means that the proposed model produces a few false negatives. This occurs thanks to the weights assigned in the graph when more than one named entity is similar in the words that make it up and belong to the same class, so the model clusters the named entities similar and by class and manages to correctly recognize a large proportion entities named in each class. Thus, the harmonic average of these measures represented by F1, can be observed without large drops or sudden peaks throughout the entire experiment, and oscillating between 31% and 37%.
In general, it can be observed that the Stanford classifier performs better in the task of recognizing named entities, maintaining a great balance in Precision and Recall. In second place of performance is the CRF++ classifier with a notorious difference below the performance achieved by Stanford.
Finally, the graph structure proposed here is in the last place, but with results not so far from those achieved by the CRF++ classifier. Notwithstanding the above, it is possible to point out that the disk space consumed by the graph proposed here is much smaller than that occupied by the other classifiers, in addition to the training time that is prolonged for the other classifiers. So the proposed graph considerably lighter and faster than the other classifiers.
6 Conclusions
In the present research work an enriched graph structure has been proposed to detect named entities. This structure is enriched by using functions and semantic information coming from synonyms. This structure was formally defined taking into account the theory of graphs. In this way, named entities are stored and levels of options or variations are added through synonyms, also using a weighting based on the number of similar entities in the original corpus.
On the other hand, the complexity of the graph was reduced by coupling these entities that share common words by category. In addition, the advantage of storing the entities in the graph structure is that it makes it lighter and faster when looking for information. Similarly, this structure allows the possibility of storing more features associated with the semantic relationships between named entities, and that could improve performance in the correct recognition of named entities. Enabling that in a future work the improvement of the results in the metrics used.
Although in developing the experiments and comparing the results obtained from the proposed structure against the Stanford and CRF++ classifiers, it could be observed that the proposed structure has a low performance in terms of Precision but a good performance for the Recall. Meaning that only a small number of positive identifications was actually correct, but that a large proportion of positive positives was correctly identified.
The proposed structure allows great flexibility to store very specific information related to the different named entities, besides using very little disk space as well as less execution time than the other classifiers and is part of what will be presented in future work. It is important to emphasize that the structure is in its simple version and that in the next future work it will be enriched language functions by adding more features associated with the semantic relationships between entities as well as the use of a corpus with balanced classes.

