


 nueva página del texto (beta)
 Inglés (pdf)
 Artículo en XML
 Referencias del artículo
 Enviar artículo por email
 Citado por SciELO
  Similares en
SciELO
Similares en
SciELO 
 Permalink
1 Introduction
Data Mining is useful in the analysis of data structures provided in massive quantities by sophisticated new processing technologies. Bioinformatics focuses on the research and development of new computational methodologies based on computer techniques for organization and analysis of information associated with the "omics" sciences [14]. The organization and analysis of biological data at the level of DNA sequence and RNA generate information related to cellular mechanisms and processes [15]. One of the main aims is the analysis of gene expression [10].
Hybridization-based techniques or microarrays in gene expression analysis has achieved high performance in quantifying the level of gene expression. However, such analysis is performed using hypothesis tests, w hich require a relatively small number of conditions and only genes that have been selected can be parsed.
Clustering describes patterns classifying the information by unsupervised methods. Biclustering techniques allow the clustering of genes with a similar genetic profile in experimental conditions, thus overcoming the traditional clustering techniques by the simultaneous clustering of genes, diseases and overlap.
In this paper we focus on BIMAX, described by Prelic et al. [21], based on Divide-and-Conquer strategies to determine optimal biclusters in reasonable time.
In general, biclustering techniques face the same problem as the clustering techniques proposed in the literature, due to the type of information being analyzed, which is characterized by high-dimensional databases. Consequently, robust noise algorithms must be proposed minimizing runtime and showing high-quality solutions. A high-performance computing system is essential to improve the performance of any computational algorithm. We describe the implementation of the parallel BIMAX algorithm.
Section 2 describes the background, and Section 3 presents BIMAX algorithm. Finally, Section 4 describes the analysis of the sequential algorithm and Section 5 presents strategies for parallelizing BIMAX.
2 Background
The main application of Bioinformatics within the biological context is the use of Data Mining techniques for the analysis of information obtained in the study of molecules relevant for life [18]. However, before the application of computational algorithms, it is necessary to adapt and elaborate new models and methodologies that fit the demand of the problem under study [20,22].
Techniques of clustering and biclustering allow to perform transcriptome analysis for the detection of genes differentially expressed in a set of experimental conditions. The patterns can be identified from datasets through microarray experiments, aiming to infer the biological mechanisms modeling the genotype-phenotype relationship and support decision-making. The information from microarray analysis is organized in a Gene Expression Matrix:
The i-th row contains data of a specific gene gi while the j-th column represents a experimental condition cj. Let G={g1,g2,…,gn} and C={c1,c2,…,cm} be the collections of genes and conditions, respectively. For each i, j, the value wij represents the expression level of gene i at condition j.
The gene expression matrix may contain noise, null values and systemic variations produced during the execution of the experiments. Usually, there are much more genes than conditions. Pre-processing of data is essential before applying any bioinformatic analysis technique, to form hypotheses about the potential pathways of information flow between the involved genes.
2.1 Clustering Techniques
Clustering techniques aim to group data containing common characteristics, they identify densely populated regions called clusters, namely, a partition U={U1,U2 ,…,Uk} of an universe U is built.
Gene-based-clustering obtains functional relations between genes based on their expression levels in comparison with experimental conditions. Such relations consider genes as the data to be grouped and the states as attributes.
Instead, sample-based-clustering [8] matches each group of experiments with a phenotype.
A good clustering solution must consider the maximization of homogeneity and separation metrics, which act oppositely. There are many proposals to solve grouping problems, and most of them are NP-hard. Thus heuristics and approximations are used. Five clustering algorithms and their characteristics are summarized in Table 1.
Table 1 Clustering algorithms
| Algorithm | Description | Ref. |
|---|---|---|
| K-means | Method of vector quantization whose objective
is to classify n observations into k clusters. The time complexity is O(lkn) where l is the number of iterations, and k is the number of clusters. |
[12] |
| Self Organizing Maps | Algorithm based on competitive learning without
supervision to classify a set of nearby observations through a graph. In some cases, it may fail because interesting patterns can be classified in several ways [26] |
[28] |
| CAST | Algorithm based on the notion of
corrupted clique graph data model. The input data set is assumed to come from the underlying cluster structure with “contamination” due to random errors caused by the complex process of gene expression measurement. |
[2] |
| CLICK | Algorithm to identify highly connected
components in the proximity graph as clusters using probabilistic assumptions so that two criteria are satisfied: homogeneity, due to mates: highly similar to each other; and separation due to non-mates: little similarity to each other. |
[4] |
| Hierarchical Clustering |
This algorithm generates a hierarchical series
of nested clusters which can be graphically represented by a tree named dendrogram. |
[7] |
Advantages and lacks appear at clustering algorithms when identifying highly correlated gene sets in gene expression. K-means, SOM, and hierarchical clustering have shown high-performance [31] but their purpose is general and they may fail to address particular challenges of gene expression analysis. On the other hand, CLICK and CAST may solve this problem [24].
2.2 Biclustering Techniques
A gene expression matrix Wmn as in eq. (1) can be
seen as indexed by the set G × C where
G={g1,g2,…,gn}
and
C={c1,c2,…,cm}
are the sets of considered genes and conditions, respectively. The
ij-th value wij represents the
expression level of gene i at condition j.
Accordingly, we will write from now on WGC instead
of the previously introduced notation Wm,n. For any
subsets
A bicluster may satisfy a homogeneity property, e.g., it may have constant entries, or constant entries by rows or columns, or have additive or multiplicative coherent values or coherent evolutions, etc.
The Biclustering Problem (BP) receives as input a gene
expression matrix WGC and a collection
The BP can be hardened by requiring that the cover solution is indeed a partition. Namely, its sets are pairwise disjoint.
BP, in general, is NP-complete [19], hence the vast majority of algorithms prioritize the reduction of computing costs, opting for the use of heuristic, stochastic search, divide and conquer and pre-processing techniques to make the patterns of interest more evident.
Most biclustering techniques are used for the analysis of transcriptomic data. The choice of an algorithm will implicitly favor getting a particular type of grouping. Five biclustering algorithms have been selected. Table 2 gives a brief description of them.
Table 2 Biclustering algorithms
| Algorithm | Description | Ref. |
|---|---|---|
| Cheng & Church |
This algorithm is the first application of
biclustering for analysis of expression profile, and the aim is to find more delicate signals than the clustering algorithm using the Mean Residue Score. |
[3] |
| SAMBA | SAMBA emerged as a method of biclustering that
produced statistically significant results, and that will also involve a normalization of the expression matrix that represents the essential characteristics of the data. |
[5] |
| CTWC | The idea of this algorithm is to identify
subsets of genes and conditions so that some of these subsets are used to define new groups that define stable and significant partitions. It should note that the number of submatrices grows exponentially with the size of the problem. |
[30] |
| Plaid Models | This algorithm considers a matrix of genes and
conditions as a layer superposition, each of them being a subset of rows and columns, which are rearranged to obtain a matrix formed by blocks, where each block is a bicluster |
[16] |
| BIMAX | This algorithm is based on the technique of
“divide and conquer”.
Specifically, the algorithm begins with a division of the matrix Wm×n into sets of columns based on one of the rows as the reference. Next, the rows or genes rearranged, as they correspond to the different sets of conditions previously obtained. |
[23] |
2.3 Related Work
Improving the computational efficiency of Data Mining algorithms by introducing some method of Parallel Computation proves to be significant as the dimension of the datasets to be analyzed increases. In this sense, several robust parallel methodologies have been proposed that model a biological model under study and also support decision making efficiently.
Metaheuristics are techniques that help in the solution of combinatorial optimization problems. In [9] Gomez-Pulido et al. propose the parallelization based on a fine granularity scheme of a biclustering algorithm based on EAs. The methodology indicates the selection of the section that takes the longest computation time, then copies of the implementation will be processed in different processing units. The results showed high efficiency in computing time and power consumption when using reconfigurable hardware instead of multiprocessor architectures.
Lin et al. proposed the parallelization of the biclustering algorithm: Large Average Submatrices (LAS) based on the MapReduce technique. Intuitively, the algorithm is organized in two phases: 1) search k rows with the largest sum over the columns, this phase consists of a function map and two functions reduce; and 2) based on adaptive row search to sum over the columns indicated for each row, then sort all the row sums in sequential order, this phase contains only a map function [13]. This algorithm proved to have a better performance in the quantitative characteristics of each cluster compared to other algorithms such as BIMAX.
On the other hand, Ardaneswari et al. propose a method of grouping in two phases to be able to determine a bicluster [1]. During the first step, the parallel algorithm k-means is used to classify a matrix Wm×n. In the second phase, the algorithm proposed by Cheng & Church is used. Also, the benefits and limitations related to the design of a parallel biclustering algorithm in GPUs are presented in [17]. This paper proposes the minimization of latency using a coarse grain to maximize energy efficiency and performance through the use of parallel patterns.
Sarazin et al. in [25] propose an implementation of the algorithm self-organizing maps using MapReduce with the Spark platform. This application is focused on fault correction, information management and distribution in a distributed architecture. The main idea is based on the initiation of two functions of map-reduce type, which manage the iterations between the rows and the columns.
A parallel algorithm of biclustering must be robust, that is, it must show relevant results in a reasonable amount of time, and that must also be scalable to the target architecture. In the following section, we describe the BIMAX: Binary Inclusion-MAXimal algorithm sequential, which assumes two possible levels of expression: level change, and no difference, concerning a control experiment.
3 BIMAX: Binary Inclusion-MAXimal
Heuristics are used to solve problems that have proved to be NP-complete. The advantages of one algorithm over another may be due to a more suitable optimization method for a specific dataset. In this sense, for the choice of BIMAX, the number of references within the scientific community and the facility to reconstruct the code based on the original publication were considered.
BIMAX algorithm uses a search strategy based on "divide and conquer" to determine all optimum maximal biclusters within a reasonable time of a matrix of binary gene expression. Each gene in a condition assumes two possible values: 1 if the gene responds differentially to a condition and 0 if it does not concern a control condition [21].
Let G={g1,g2,…,gn} and C={c1,c2,…,cm} be the sets of genes and conditions.
Find a gene gi ∈ G, such that the following two condition subsets Bi0, Bi1 are non-empty, where for each k ∈ {0,1} Bik consists of the conditions cj ∈ C such that wij = k.
Let
Let us partition the gene (row) index set into three subsets:
Gi0 = {gi’∈
G| the restriction of the the i'-th row of
Gi1 = {gi’ ∈
G| the restriction of the the i'-th row of
Gi2 = G - (Gi0 ∪ Gi1),
and let Fi1 = G\Gi1 be its complement in the gene index set. Form the submatrices:
Repeat the procedure to each of these biclus-terings, W0 and W1, till the above activation non-emptyness condition fails.
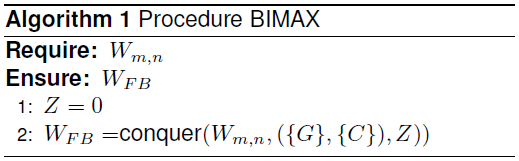
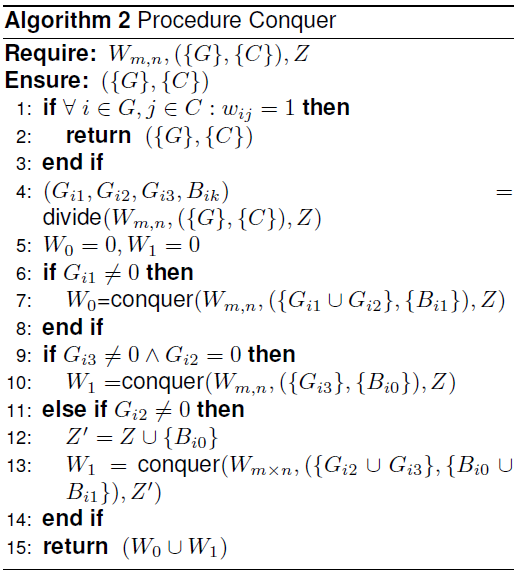
3.1 Algorithm (Reference Method)
Algorithm The following algorithm realizes the divide-and-conquer strategy. Note that individual operations are required for processing the WFB submatrices. The algorithm needs to guarantee that only optimal, i.e., inclusion-maximal biclusters are generated [21].
4 Analysis of Sequential BIMAX
During the parallelization process of an algorithm it is necessary to make an analysis of the performance of the algorithm. This analysis is helpful to find information about the segments of code that can be potentially parallelized. In this section, we present an analysis of the sequential BIMAX algorithm.


The implementation of the sequential BIMAX algorithm was designed and codified based in the algorithm presented in [21] in C language. For the experiments, we use an Intel Xeon E3 v5 processor. For the performance analysis of the sequential BIMAX, we used the three in silico1 datasets, Group A, Group B and Group C. Group A was used to evaluate the effectivines of the algorithm, which is measure by calculating the number of correct biclusters presented in the output of the program. Group B was built to measure the effectiveness of the algorihtm in the presence of noise, which was simulated by applying a random order of the rows in the matrix. Finally, Group C was used to determine the maximum amount of sections in the algorithm potentially parallelized.
-
— Group A is characterized by five binary matrices constructed in the absence of noise, to which a definite number of biclusters has been implanted according to the size of the matrix. These datasets represent the best case scenario due to the elements belonging to a bicluster are contiguous, and there are no overlaps between them. The table 3 describes the characteristics of each of these matrices, the processing time expressed in milliseconds and the percentage of effectiveness represented by the comparison between the features of the biclusters implanted against of the obtained biclusters.
We have represented the percentage of effectiveness through the convention: α0 - α1(%), where α0 and α1 represent the number of biclusters implanted and detected respectively, while (%) represents the percentage of effectiveness for each case study. The percentage of effectiveness was obtained by comparing the characteristics of the implanted and obtained biclusters. The above has shown that the algorithm has a good correctness and efficiency, being able to determine the 100% of the biclusters implanted in datasets proposed.
-
— Group B is characterized by five binary matrices belonging to group A, which have been added noise simulated by random ordering of the rows. Table 4 describes the processing time expressed in milliseconds and the percentage of effectiveness of each matrix. One more column has been added to represent the percentage of the growth rate of the execution time needed to find biclusters in the presence and absence of noise. The percentage of the growth has been measured using the equation
The results show that although the biclusters are not well defined, the algorithm does not lose precision or quality. One more experiment was added by randomly swapping the order of the columns of each test matrix in this dataset.
These experiments (see table 4, 5) shown that the growth rate concerning the execution time varies between 20 % and 30 % in the presence of noise. A matrix M50×50 was constructed to compare the impact that the presence of noise has on the performance of the algorithm. To each element of M was added a noise value simulated by a Gaussian distribution as well as the order of the rows and columns was randomly exchanged.
The execution time obtained by processing the matrix 5 of the experiments shown in the tables 3, 4 and 5 was compared. The results show that the more noise contains the gene expression matrix and the less obvious the biclusters are, the algorithm will take more time to present a result to the user (see table 6).
-
— Group C characterized by eleven binary matrices that have been constructed by the implantation of a defined number of biclusters with superposition. Next, a simulated noise value has been added to each element of the matrix using a Gaussian distribution. Finally, the order of the rows followed by the order of the columns has been randomly exchanged. This dataset represents the worst case scenario.
The table 7 shows the dimension of each of the arrays built in silico, as well as the execution time expressed in milliseconds. It is necessary to highlight that the algorithm depends on two parameters that the user needs to define at the beginning of the computation: the minimum number of genes for a bicluster that contains more than one condition, or the minimum number of conditions for a bicluster that contains more than one gene. We have defined these parameters with a value of 1, so that our analysis shows the greatest possible number of results.
An analysis of the time it takes for the algorithm to read the gene expression matrix, to process it and to write the results has been made. Table 8 shows the percentage of time for each case study. It is appreciated that in the first four cases the percentage corresponding to the writing and reading time is higher than the percentage of the processing time. However, as the size of the matrix increases, the rate of processing time begins to converge to 68 %, which represents the processing time limit of the algorithm that can be potentially parallelizable.
Table 3 Effectiveness of the BIMAX sequential biclustering algorithm without noise
| Matrix | Size | Time (ms) | Effectiveness |
|---|---|---|---|
| 1 | 10 × 10 | 0.4802 | 3-3(100%) |
| 2 | 20 × 20 | 0.6608 | 4-4(100%) |
| 3 | 30 × 30 | 0.7990 | 5-5(100%) |
| 4 | 40 × 40 | 0.9938 | 6-6(100%) |
| 5 | 50 × 50 | 1.1459 | 7-7(100%) |
Table 4 Effectiveness of the BIMAX sequential biclustering algorithm in presence of noise
| Matrix | Time (ms) | Effectiveness | Rate |
|---|---|---|---|
| 1 | 0.5952 | 3-3(100%) | 23.94% |
| 2 | 0.8210 | 4-4(100%) | 24.24% |
| 3 | 0.9819 | 5-5(100%) | 22.89% |
| 4 | 1.2376 | 6-6(100%) | 24.53% |
| 5 | 1.4688 | 7-7(100%) | 28.18% |
Table 5 Effectiveness of the BIMAX sequential biclustering algorithm in presence of noise
| Matrix | Time (ms) | Effectiveness | Rate |
|---|---|---|---|
| 1 | 0.6198 | 3-3(100%) | 29.07% |
| 2 | 0.8659 | 4-4(100%) | 31.03% |
| 3 | 1.0578 | 5-5(100%) | 32.39% |
| 4 | 1.2919 | 6-6(100%) | 29.99% |
| 5 | 1.4770 | 7-7(100%) | 28.89% |
Table 6 Analysis of the impact that the presence of noise has on the performance of the BIMAX algorithm
| Matrix | Size | Time(ms) | Effectiviness |
|---|---|---|---|
| 1 | 50 × 50 | 1.1459 | 7-7(100%) |
| 2 | 50 × 50 | 1.4688 | 7-7(100%) |
| 3 | 50 × 50 | 1.4770 | 7-7(100%) |
| 4 | 50 × 50 | 47.6542 | 7-4(57.1%) |
Table 7 Total execution time in minutes (mins) to evaluate the performance of the BIMAX sequential biclustering algorithm
| Matrix | Size | Time (mins) |
|---|---|---|
| 1 | 10 × 10 | 0.0048 |
| 2 | 50 × 50 | 0.0535 |
| 3 | 100 × 100 | 1.9749 |
| 4 | 150 × 150 | 23.2889 |
| 5 | 200 × 200 | 185.9743 |
| 6 | 250 × 250 | 762.6570 |
| 7 | 300 × 300 | 3191.0777 |
| 8 | 350 × 350 | 10906.2004 |
| 9 | 400 × 400 | 39018.2120 |
| 10 | 450 × 450 | 84378.7566 |
| 11 | 500 × 500 | 131627.8000 |
Table 8 Percentages of the execution time of the three phases of the BIMAX sequential biclustering algorithm: reading, writing and processing
| Matrix | Reading (%) | Writing (%) | Processing (%) |
|---|---|---|---|
| 1 | 2.8014 | 94.0423 | 3.1563 |
| 2 | 1.8938 | 67.1074 | 22.2813 |
| 3 | 0.5095 | 59.1921 | 40.2983 |
| 4 | 0.0679 | 57.3385 | 42.5936 |
| 5 | 0.0103 | 44.3639 | 55.6258 |
| 6 | 0.0030 | 38.0696 | 61.9274 |
| 7 | 0.0008 | 35.0811 | 64.9181 |
| 8 | 0.0003 | 33.0724 | 66.9273 |
| 9 | 0.0001 | 32.0714 | 67.9285 |
| 10 | 0.0001 | 32.0153 | 67.9846 |
| 11 | 0.0000 | 32.0076 | 67.9924 |
We analyze the maximum performance that the parallel system of the BIMAX algorithm
can provide. Given the sequential program of the BIMAX algorithm whose 68 % of its
code is perfectly parallelizable, the performance and efficiency of the sequential
algorithm is calculated on {1,2,4,8,16} processors, assuming that it has a run time
of 100 units of time (seconds). The system's performance improvement factor
(speed-up) is defined as
The estimation of the performance of the algorithm while increasing the number of processors is shown in table 9. A system is scalable for a specific range of processors, if E(p) of the system remains constant and above a factor of 0.5 [6], although it is appreciated that moving to 8 processors reduces the efficiency considerable.
Table 9 Estimation of the performance and efficiency of the BIMAX algorithm with different number of processors
| Processors | 1 | 2 | 4 | 8 | 16 |
|---|---|---|---|---|---|
| S(p) | 1 | 1.5151 | 2.0408 | 2.4691 | 2.7586 |
| E(p) | 1 | 0.7575 | 0.5102 | 0.3086 | 0.0946 |
Consequently, the performance of the BIMAX algorithm is defined when p → ∞ as:
where ϕ is defined as 68 % of the potentially parallelizable code. The above represents an approximation to the maximum acceleration that can be obtained from the parallelization of the sequential code of the algorithm.
5 Strategies for Parallelizing BIMAX
In the figure 1 it is observed that the processing time characterized by ϕ begins to decrease as p increases. In contrast, the sequential time represented by (1-ϕ)=r(p)+w(p) where r(p) and w(p) represent the time of reading and writing partial results by each processing unit remains constant in all the study cases and particularly when p≥4, (1-ϕ)> ϕ.

Based on the results obtained in the table 8, it can be said that:
Therefore, it is proposed to use a parallel file system in a message passing environment, in order to optimize the access time to the data and consequently improve the overall performance of the algorithm.
Due to the complexity of BIMAX, which is defined as O(mnβ min{m,n}), where β is the number of inclusion-maximum biclusters of Wm,n [21], the divide and conquer scheme that is used, and the hard disk space required to process and store, the algorithm turns out to be a suitable candidate for the application of some parallelization technique.
The parallelization of biclustering algorithms has been difficult due to its inherent characteristics, which requires to repetitively read the same data or to distribute it between different devices. These data intensive characteristics can limit current parallel architectures.
Nevertheless, some biclustering algorithms have been parallelized including novel algorithms using parallel genetic algorithms, parallel evolutionary learning and the parallel large average submatrices based on MapReduce [27], [11] [13], running on multicore systems or clusters. Others algorithms have been parallelized for using the popular graphics processing units (GPUs), requiring more specialized parallel programming as [17].
Despite the BIMAX algorithm has been taken as a baseline for comparison with other biclustering algorithms, the only parallel version, to the best of our knowledge, is the one presented by Voggenreiter et al. [29]. This parallelisation consists of a straightforward strategy using a job pool of threads. [29] states that using a single pool, leads to contention between threads and it increases as the number of threads gets higher. Thus, the more number of threads running the BIMAX, the slower performance the program have. To alleviate this contention, it is proposed a parallelization of BIMAX without a job pool. However, this implementation was found not to be effective for larger datasets.
In this work, we aim to go further in the BIMAX parallelization by partitioning the input matrix up to a certain level. This level is limited by the number of processors in the architecture system. After reaching the last level, then the BIMAX is executed independently by each process with a submatrix. The program ends when all the processes have been finished.
Figure 2 illustrates the proposed parallelization of the BIMAX algorithm. It basically consists of the division of the input matrix into the total number of available processors in the system. This division is made at the beginning by the parallel BIMAX program. Since the BIMAX is implemented in divide and conquer approach, it generates a tree of processes as it can be seen in Figure 2. The number of levels in that tree depends on the total number of processors. For instance, having available six processors, the tree can only have two levels of the BIMAX recursion. Once the last level of tree is achieved, in this case the second level, each processor start the execution of the BIMAX algorithm with its respective input matrix.

6 Conclusion
Biclustering is a powerful unsupervised technique to uncover patterns in gene expression data. Three main phases of the BIMAX algorithm are described: data reading, processing and writing results. Our results suggest that the algorithm is potentially parallelizable in the processing and the writing phases, due to the reading phase tends to zero when the number of processors increases.
The parallelization of the BIMAX algorithm is proposed in a message passing environment, as well as a parallel file system. The above is associated with a lower computation cost when obtaining partial results for each processing unit during the analysis of a section of the gene expression matrix.
Certainly, there are differences in the specific criteria used to parallelize the algorithm, having as a consequence differences in speed between the present study and those proposed in the literature. In this sense, a previous analysis of the performance of the BIMAX algorithm has been carried out to identify the potentially parallelizable sections, and thus, be able to propose a good design of the parallel algorithm in distributed memory platforms.
In this study, we used only gene expression matrices designed in silico, of which the characteristics of implanted biclusters were known to minimize the confounding variables. Future research should include gene expression matrices that result from biological experiments, and that also allow verifying the results in vitro.
It must be taken into account that the parallelization of the algorithm will show an improvement in its performance that will depend on the algorithm itself, its sequential component, the overhead of communication and synchronization between the processes. However, the objective will always be to increase the speed of the processing without altering the effectiveness of the algorithm, independently of the error coming from the different noise sources of the experiment.

