


 text new page (beta)
 English (pdf)
 Article in xml format
 Article references
 Send this article by e-mail
 Cited by SciELO
  Similars in
SciELO
Similars in
SciELO 
 Permalink
1 Introduction
These last few years, much research has been conducted to detect the driver fatigue. Some approaches are intrusive like using the Electroencephalography signal analysis [5,7] and others analyses the driver videos [3,1,26,23,13,22,25]. We are interested in our work to examine the measures related to the speed of eye closure from a sequence of images to determine the driver state. Two categories of approaches can be suggested:
The first category called mono-variables that calculates the time of eye closure. Indeed, the size of the iris change their area and depends on the eye state (opened, semi-opened or closed). This fact can be used to determine the state of the eye (open or close) [26,21,13,22]. Other studies calculate the distance between the upper and lower eyelids to locate eyes blinking. This distance decreases if the eyes are closed and increase when they are opened [13,12,27,25]. All of, these approaches can alert the driver state fatigue in case of prolonged eye closure.
Tansakul et al. [22] implement a driver drowsiness detection system based on eye blinking analysis. The system monitored the eyes blinking rate and the blinking duration after locating the eye region with Viola and Jones method. Tansakul et al. convert the color space of eye ROI image from RGB to HSV and calculate a lightness value. Fatigue drivers having a value higher than normal levels (3 calculated experimentally) is considering as fatigue. The duration of eyes closure is used as an indication of driver drowsiness. Its varies from one work to another. Singh et al. [21] consider that a person is asleep if the eyes remain closed for a period (5 to 6 seconds). Wang et al. [25] use a traditional AdaBoost method to detect eye circle contour in order to recognize whether the eyes are open or closed. After locating human faces and ocular regions, the pixels of the pupil region are removed by a developed grid method. They use the least squares method to adjust the contour of the upper eyelid and extract a characteristic vector.
Finally, the state of the eyes is recognized according to a defined threshold. Wang et al. prove, experimentally, that the vertical coordinate of the circle outline is the best feature for classifying the eyes state. Wang et al. conclude that driver fatigue is detected if the eyes closure remains between 3 and 10 seconds. This case represents the deep sleep. On the other side, the micro-sleep is detected if the driver goes through a state of sleep for a short time (2-3 seconds). For Wen et al. [26], the driver is considered in a state of fatigue if he/she closes his eyes for 5 consecutive seconds. Hongbiao et al. [12] consider that the state of drowsiness is determined when the distance between the eyelids is less than 60% for a period of 6.66 seconds. Yong et al. [27] divide the eyes opening state into three categories: opened, half opened, closed.
This division allows to conclude the driver drowsiness state if the eyes are kept closed more than 4 consecutive images or eyes move from a state of half opened to a closed state for 8 successive images (each image is taken in each second). The percentages of fatigue detection vary in literature from a work to another. Yong et al. [27] reached 91.16% of correct average rate of driver drowsiness state. Wen et al. [26] explain that the average accuracy rate for fatigue detection can reach 88.9%. All these works compute their results with subjects that their numbers varies from 2 to 10 people.
The second type of approach is called multi-variable. In this context, the maximum speed reached by the eyelid when the eye is closed is called velocity and the amplitude of blinking calculated from the beginning of blink until the maximum blinking present two important indications that have been studied by Murray et al. [15]. They show that the amplitude and velocity ratio (A/PCV) is used to prevent the driver one minute in advance for their state of hypovigilance. Omi et al. [17], use an infra-red camera and suggests five levels of vigilance namely non-drowsy, slightly drowsy, sleepy, rather sleepy, very sleepy and asleep. Omi et al. proposes several criteria:
The percentage of eye opening, the number of blinking, the duration of eye closure, the blinking interval and the surface of eye opening. This work has been tested using a base of 10 subjects. A correlation rate that is greater than 90% is achieved. Picot presents a synthesis of different sizes as the duration to 50%, the PERCLOS 80%, the frequency of blinking and the velocity amplitude ratio. Picot et al. [19] show that these criteria are more relevant to detect the drowsiness. These variables are calculated every second on a sliding window of 20 seconds. They are fused by fuzzy logic to improve the reliability of the decision.
This study shows a percentage of 80% of good detections and 22% of false alarms. Generally, video-based approaches, rest on the iris segmentation to extract features for the subsequent steps. In this context, we adopt the method of Circular Hough Transform for iris. This method shows sturdiness in the face of the desired shape, an ability to detect circle with poor or noisy quality and an identification of all directions thanks to the use of a polar description.
Following the analysis of the literature, it seems that single-variables approaches, present a very high rate of successes detection but the detection of the drowsiness state is very late. In this paper, we focus our study on the characteristics allowing to predict the driver state before sleeping, and analyzing the speed of closing eyes. Thereby we propose and compare, in this paper, our two methods for drowsiness detection.
2 Proposed Approach
In this section, we describe successively our first and second methods to detect the driver fatigue. Our main idea is to use the signal extracted from geometric features that characterize eyes blinking. Both proposed methods are preceded by a step of pretreatment and signal extraction.
2.1 Pretreatment and Signal Extraction
Our approach for driver drowsiness detection is based on studying the behavior of eyes conductor in real time by an RGB camera. Both proposed methods require critical steps presumed through the automatic face detection and the localization of the eye boxes like shown in the figure 1. These steps are described in the following section.

2.1.1 Tracking both Face and Eyes after their Localization
In order to locate face and eyes, our approach exploits the Viola and Jones method based on a learning technique of Haar features [24]. This method uses three concepts: the rapid extraction of features using an integral image, a classifier based on Adaboost and the implementation of a cascade structure. The face and the eyes located by the Haar features are then used to initialize the tracking module. This module is based on the CAMSHIFT algorithm [4]. The choice of this algorithm is argued by its robustness for real-time systems, its invariance to scale and rotation, treatment of occlusions and finally by its insensitivity to object distortions.
2.1.2 Iris and Eyelids Detection
We note that human eyes are characterized by horizontal contours representing the eyelids and the wrinkles or vertical contours as the ones of the iris. The application of 2D Haar Wavelet [9] allows extracting the vertical, horizontal and diagonal contours. The vertical contours are used in the localization of the iris with the Circular Hough Transform [6]. The use of the wavelet allows us to highlight the contours that we want to spot. In our case, the scale of the second level improves the contours of the iris and the eyelids for detecting.
Edge Extraction based on 2D Haar Wavelet The Haar Wavelet allows splitting the image to find the vertical and horizontal details for both iris and eyelids detection. The wavelet transform is characterized by its multi-resolution analysis. It is a very effective tool for noise reduction in a digital image. With Haar Wavelet, we can also ignore some edges and keep only the most representative ones. This type of analysis is allowed by the multi-resolution.
Iris and Eyelids Detection based on Circular Hough Transform The Circular Hough Transform has two spaces, the space XY and the parameter space which varies according to the detected object. The parameter space of the circle is represented by equation 1:
Were A and B are the coordinates of the circle center and R is the radius. For simplification purposes, we can consider that the radius varies between two values. This will reduce the complexity of the algorithm. The equation of the circle can be written in the polar system as follow:
The process to find circles by Circular Hough Transform follows several stages. In order to detect the desired edges, we apply the 2D Haar Wavelet decomposition of the second level. Our approach allows the detection of the iris by applying the Circular Hough transform on the vertical details of the eye. Both eyelids are located using the Circular Hough Transform on the image result of the horizontal details of the 2D Haar Wavelet decomposition.
2.1.3 Geometric Features Extraction
After the detection of the iris and the eyelids, we proceed by extracting geometric features, those able to characterize the driver drowsiness state.
We propose two geometric features Dih and Dib (figure 2) to extract the nonstationary and nonlinear signal. These features represent the distance between the point J and the point Ph and Pb respectively as written , respectively, in the equations 3 and 4:
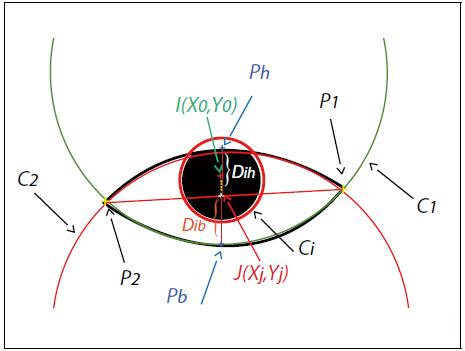
We note that Ph and Pb are calculated from the intersection between the straight line which passes through J and perpendicular to the line (P1P2 ) and the two circles C1 and C2, where the equation of one of the two circles C1 or C2 is represented as follows:
and the perpendicular to line (P1P2) is calculated by applying the equation:
By replacing y2 into the equation 5 we obtain the equation:
The straight line (P1P2) is determined after the detection of two points P1 and P2 (Figure 2) which represent the intersection of two circles C1 and C2 such as the squared equation of circle C1 is:
and the squared equation of circle C2 is:
The difference between equation 8 and equation 9 allows calculating the two points P1 and P2 as follows:
such us:
and:
while
2.1.4 Signal Extraction
In order to produce realistic data, a human subject is placed in front of an RGB camera to record different possible movements of the head, the eyelids and the positions of the iris, probably related to different states of fatigue. This experimentation consists of studying the temporal variation of both features Dih and Dib , in addition, to normalize the initial state of the eye using the equation 14. The signal f(xt ) is calculated as follows:
The initial value Vi is calculated at the beginning of the algorithm when the eyes are open to 75%.
2.2 First Method (CBS): Driver Fatigue Detection based on Analysis of Cumulative Blink Signal
In our case, the signal f(xt ) has peaks (see figure 3). In theory, a peak is a curve extending to infinity on both sides.

Fig. 3 Eye closure speed, (a) normal eyes take 0.16 s, (b) abnormal eyes close for an average of 1 s
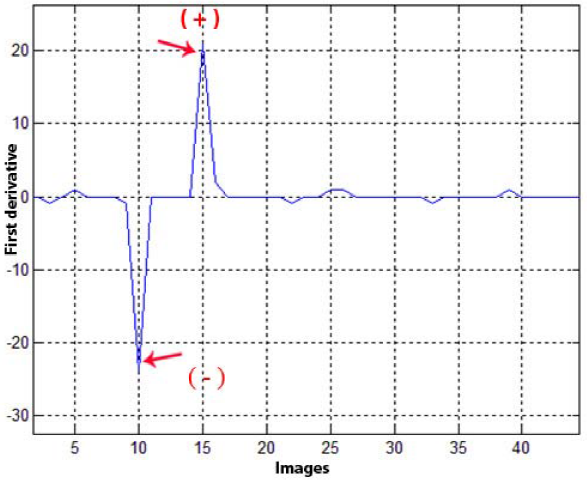
A vertex relating to a peak in the signal f(xt ) represents relevant information for detecting blinks. Generally, in case of blinking, the top of the peak takes the highest value. However, the maximum point of the signal does not necessarily have the peak following a significant oscillation of the signal (noise case). To resolve this problem, the first derivative of the signal f(xt ) seems to be a fair solution. Indeed, the objective of the blink analysis at this level is to detect the positions of state change, the beginning of eyes closing or the beginning of eyes opening. The first derivative of the function f(xt ) makes it possible to find these variations (figure 4) which are characterized by a brutal negative change for the beginning of eyes closing and by an abrupt positive change for the beginning of eyes opening. The identification of these sudden variations can help us to locate the normal and slow driver blinks, possibly in a state of drowsiness.
A second interesting idea is to to analyze the difference between eyes closure speed of a person in normal state and another in a state of drowsiness. The figure 3 shows the average of eyes closing time of a normal person (see figure 3 (a)) and sleepy (see figure 3 (b)). Thus, in order to capture this important information, we propose in this step to analyze the cumulative variation (equation 15) of the signal f(xt) in order to calculate the duration of eye closure (figure 5):

Fig. 5 The duration of eye closure, (a) the eyes are closed for 0.07 s for a normal blink, (b) the eyes in a state of drowsiness (more than 2 s)
We, therefore, use cumulative variation (equation 15) to detect the number of observations that are above (or below) a particular value in a dataset. In our case, we are mainly interested in the values of slow eyes closure time. Drowsiness states are characterized by a continuous signal because the evolution of f(xt) is too low. According to our study (figure 5), this duration is near to 0.07 seconds and does not exceed 0.2 seconds [16] for a fast blink and it is greater than 2 seconds [8,20] for a blinking of a person in a drowsiness state.
Thus, in our proposal, a state of drowsiness is, firstly, identified following the location of the blink, secondly, the blinking speed will be studied and finally eyes closing time will be calculated. The driver is considered to be a state of drowsiness if the eyes closing speed exceeds 1 second (see figure 3) and/or the eyes closing time is greater than 2 seconds (see figure 5)
2.3 Second Method (IFD): Drowsiness Detection by Intinsic Functions Decomposition of the Nonstationary and Nonlinear Signal
The obtained signal refered as nonstationary and nonlinear signal like shown in the figure 6.

The Fourier Transform or Wavelets made the time-frequency analysis of signals possible. These latter methods do not properly analyze the nonstationary and nonlinear signals.This supports our argument to apply a method called Empirical Mode Decomposition [10] (EMD). THe EMD method does not depend on a core of basic function (such as Wavelets) and depends on the original signal. EMD method decomposes the f(xt) signal into a local average a(xt), which is the average of the upper and lower envelopes f(xt) and another element oscillating intensely IMF(xt). With iteration we can repeat the above procedure until a non-oscillating residue r(xt) (Equation 16):
The decomposition of the signal (Figure 5) shows a strong oscillation in the first IMF1(xt) when the driver is drowsy. This observation supports the choice of the first IMF(xt) to extract the most relevant information of the signal by combining the EMD and BP algorithm on a sliding window of a 1 second since a normal blink lasts no more than 0.2 seconds [16].
The BP method [18] applies a bandpass filter passing only a frequency interval, which is the band between the high and low frequency. This interval, is averaged after it is squared.
In fact, The features extracted are validated by the results of classification with the SVM algorithm [11], in order to detect the driver drowsiness states. Figure 7 shows the states of drowsiness presented by the value 1 and vigilance by 0 value.

Fig. 7 Result of driver fatigue detected by SVM classification. The image in the top presents the original f(xt) signal, in the medium IMFi (xt) and in the bottom the classification result by the SVM algorithm
We note that false alarms can appear in the result of the classification. These false alerts (from image 2196 to image 2220) are mainly related to the video source quality that influenced the geometric features extracted.
3 Experimental Study
Our experimental study is based on two databases. The first one is a database made by our laboratory called MIRACLHB [2], composed of 12 persons for different sexes and in different lighting conditions. The second database used is the DEAPT database [14], and contains videos of 22 participants for frontal views with different facial expressions.
Indeed, the stage of the iris and eyelids localized is essential to calculate the signal f(xt). The size of the rectangle locating the eye allows us to estimate the size of the circles rays to detect the eyelids and the iris by the Hough Circular Transform. On this way, we ensure that the method used is not affected by any scaling conditions. The choice of the Hough Circular Transform is argued for its robustness, speed and noise resistance. The results of the iris and eyelids localization (tables 1 and 2) are calculated from the average of the correct (TDC) and false (TFD) rates locations by the Hough Circular Transform according to the equation 17 and 18:
Table 1 Correct and False rates of Circular Hough Transformation for the DEAP database
| Subjects | TFD | TDC |
|---|---|---|
| S 1 | 0,3 | 94,2 |
| S 2 | 0,1 | 96,01 |
| S 3 | 0,98 | 91,2 |
| S 4 | 1,3 | 90,5 |
| S 5 | 0,6 | 94,05 |
| S 6 | 2,56 | 94 |
| S 7 | 1,2 | 91,8 |
| S 8 | 1,87 | 95,06 |
| S 9 | 0,4 | 94,5 |
| S 10 | 0,6 | 93,52 |
| S 11 | 1,5 | 91,85 |
| S 12 | 0,6 | 93,74 |
| S 13 | 0,76 | 92,3 |
| S 14 | 0,54 | 95,32 |
| S 15 | 1,21 | 94,2 |
| S 16 | 0,45 | 95,84 |
| S 17 | 0,76 | 93,36 |
| S 18 | 0,6 | 96,45 |
| S 19 | 0,78 | 95,25 |
| S 20 | 0,34 | 90,1 |
| S 21 | 0,56 | 90,3 |
| S 22 | 0,42 | 91,36 |
| Average | 0,8377 | 93,38 |
Table 2 Correct and False rates of Circular Hough Transformation for the MiraclHB database
| Subjects | TFD | TDC |
|---|---|---|
| S 1 | 0,3 | 96,82 |
| S 2 | 0,1 | 95,72 |
| S 3 | 0,6 | 96,17 |
| S 4 | 1,5 | 95,43 |
| S 5 | 1,8 | 95,88 |
| S 6 | 0,3 | 96,97 |
| S 7 | 0,2 | 97,35 |
| S 8 | 0,4 | 97,27 |
| S 9 | 1 | 96,58 |
| S 10 | 0,2 | 96,83 |
| S 11 | 0,4 | 97,23 |
| S 12 | 0,3 | 98,02 |
| Average | 0,5917 | 96,68 |
The iris and eyelids localization results show satisfactory rates using the MiraclHB database than the DEAP database. This satisfaction is demonstrated by the percentage average of the correct detection rates (96.68 % for the database MiraclHB and 93.38 % for the database DEAP) and the rates of false detections (0.59 % for the database MiraclHB and 0.83 % for the database DEAP). However, the errors of iris localization and eyelids are due mainly to occlusions or to the bad orientations of the face compared to the camera.
These errors affect the descriptors values Dih and Dib , which directly influences the interpretation results of the signal f(xt) whether by the cumulative signal analysis method or by intrinsic function decomposition method.
The figures 8, 9, 10 and 11 show the results of fatigue detection on both MiraclHB and DEAP databases by both drowsiness detection methods.


An expert's advice in this step is essential to determine the real driver somnolence
represented by the index
The precision is calculated by a ratio between the correct alarms
The extraction of the characteristics as well as the detection of somnolence states with both methods show good results. Our two proposed methods carried out validate the relevance of the two geometric descriptors Dih and Dib.
This is confirmed by the good average rates of Recall and Precision. However, a slightly better average recall rate is found in favor of the IFD method which reaches 92% vs. 86.5% for the CBS method. Similarly, the average accuracy rate is 82.5% for the CBS method, compared to 89% for the IFD method. These values argue for the adoption of the intrinsic decomposition method to ensure better results.
Our non-invasive IFD method by intrinsic decomposition function, compared to the work done in the literature, shows also satisfactory results. This satisfaction is demonstrated by a comparison given in table 3. Indeed, the value of the recall in the fatigue detection system is a very important information to know the performance of the system in relation to the opinion of an expert. Our system calculates this metric and shows an important performance up to 92%. In fact, this value is not calculated for the two methods compared in the literature (table 3). On the other hand, Tansakul et al and Wang et a/ show satisfactory values of accuracy, but this is not sufficient information to know the performance of their methods in the case where the recall is weak. The use of two databases in our experimental study represents another major advantage for our work. In fact, among these databases, we created our own database MIRACLHB [2] with free access. The works compared to our method use some test videos in their experimentation which influence, thereafter, on the calculated rates and gives a question to their relevance.
4 Conclusion and Future Work
In this paper, we presented a general overview of the different methods of drowsiness detection approaches in the literature.
Experimental results show that our methods achieve good performance with a satisfactory classification rate (essentially IFD method). However, some shortcomings limit our results by the fact that there are errors of detections of the eyelids and the iris due to occultations cases. These reflections open up new perspectives for our work that we try to address such as the analysis of the yawning, the estimation of the 3D head pose or use a fusion system to improve overall results.

