


 nueva página del texto (beta)
 Inglés (pdf)
 Artículo en XML
 Referencias del artículo
 Enviar artículo por email
 Citado por SciELO
  Similares en
SciELO
Similares en
SciELO 
 Permalink
1 Introduction
Microbubbles generation has been studied since the end of the 20th century by multiple researchers [7], however, it is until 1996, that G. Paltauf, M. Frenz, H. Schmidt-Kloiber conducted a research to analyze the formation of microbubbles at the tip of an optical fiber using a pulsed laser at approximately 6ns [1]. It is primarily in optics where the generation of microbubbles with optical fibers has taken relevance [7], but also on many other diverse fields of science, like in medicine, where this technique has been proposed as a new way to realize non-invasive surgeries.
Despite the importance of new applications of these microbubbles, nowadays, studies about the dynamic of these bubbles is still done primarily by hand or in a few cases with the help of very simple software tools, for example, the segmentation of bubbles initialized by an operator; case in which it is required to select bubbles position for every frame of a sequence. Due to high potential use in diverse applications, it is necessary to track position and speed of them in an automatic way, this information would be useful to faster studies and consequently the development of new applications.
In order to generate microbubbles, optical fibers are covered with a solution of absorbing nanoparticles, which are suspended in a liquid; in this way, by the stimulation of light emerging from the optical fiber are obtained a micro-heater capable of generating heat in an very localized area, producing a phase change from liquid to vapor, in the liquid suspension that surrounds it, generating micron-size bubbles. In Figure 1, it is showed the experimental arrangement for the generation of microbubbles.

This works presents the implementation of a computational tool for measuring the pose and size of microbubbles, generated by optic fibers. The software was developed using a sequence of filters and algorithms, some of them provided from the OpenCV library [4]. Proposed tool is capable of directly measuring the growth of microbubbles generated by this method. Moreover, the tool is multi-platform, providing then, an efficient and easy to use in diverse environments or operating systems.
The following section explains some related works, both in the areas of physics and image processing. In section 3, it is made a description of the experimental work carried out and in section 4 is described the development and implementation of the proposed tool. Section 5, presents a summary of the results obtained and their validation. Finally in the section 6 the conclusions are given, as well as the future work.
2 Related Work
In the following, it is presented a description of some relevant related works for the generation of microbubbles, beginning with some works in the area of optics and ending with works in the area of computer vision and image processing.
The mechanism of bubble formation has been studied since the end of the 20th century by multiple researchers [1]. It is in 1996 that G. Paltauf, M. Frenz, H. Schmidt-Kloiber [5], carried out a research to analyze the formation of microbubbles at the tip of an optical fiber using a pulsed laser.
In 2003, J. Neumann and R. Brinkmann propose to study the formation of microbubbles and their dynamics, as an application to perform selective tissue damage at the cellular level [3].
In 2004, R.S. Taylor and C. Hnatovsky [11], studied the formation of microbubbles at the tip of a fiber, probing and observing that the microbubbles were formed due to a highly localized superheating and the spontaneous boiling of the liquid produced at the tip of the fiber. The main objective of this work was to study the microbubbles as controllable actuators to manipulate bioparticles.
In 2010, Hema Ramachandran et al. [8] created microbubbles with optical fiber for application in biomedical environments. Their goal was to use them for the scanning, transport and dispersion of potentially toxic carbon nanotubes in biologically relevant environments.
In 2012, R. Pimentel-Dominguez et al. [7] showed that the fiber optic tips covered with carbon nanoparticles and metal powders can be used as microbubble generators in liquid media.
The possibility of generating microbubbles with light arouses interest primarily in the field of basic science, but, in addition there are several technological applications; especially in the area of medicine that can be used to improve the life's quality of cancer patients, as mentioned in the work of V. P. Zharov and et al. [14].
In Table 1, some applications of the microbubbles by different generation methods are listed.
Table1. Microbubble applications by different generation methods [6]
| Discipline | Application |
|---|---|
| Medicine | Visualization of blood flow Removal of fine metal particles Exploration of bodily organs Ultrasound therapy Drug administration |
| Engineering | Device of friction reduction Water treatment Processes of mass transfer and extraction |
| Environment | Separation of oil Decomposition and (or) sludge separation Water purification Elimination of residual pesticides in vegetables |
| Chemistry | Ozonation of water and phenol Degradation of methyl orange |
From the computer vision or image processing side, the following studies were carried out for tracking and detection, but above all, for the segmentation of microbubbles.
In 2003, Cheng and et al. [2], developed a system which can track bubbles in image sequences based on a manually selected initial contour of a bubble. They assume that the contours of the bubbles have circular shapes, in order to characterize the position of each bubble in subsequent images. This method reveals to be rather robust and produces good results, despite of difficult illumination conditions.
The system can also deal with the overlapping problem and identify the bubbles correctly.
In the same year, Zhu and et al. [15], proposed an analogous computational work to detect individual particles in images acquired using a cryo-electron microscopy, this was done by the detection of edges and the Hough transform.
In 2004, another technique employing particle image velocimetry (PIV) and shadowgraphy was used to study vertical slug flow in non-Newtonian fluids [10].
The characterization of bubbles using manual methods is a time-consuming process; for this reason, new semi-automatic methodologies have been proposed for the measurement of bubbles from the segmentation of images and using the Hough algorithm [10]. The method was able to reduce the total processing time for the measurements of bubbles and drops in different systems by 50% and the manual intervention time for the segmentation procedure by 100%.
Zabulis and et al. [13] propose a bubble measurement system with a method based on the detection of templates. The motivation of his work was the low performance of conventional methods of detection of bubbles and particles in dense dispersions.
Wenyin and et al. [12], they also propose a method for the analysis and recognition of bubbles, using image segmentation but based on the Canny operator.
They use a smooth Gaussian filter to maintain the edges and eliminate noise and with a lag-threshold process they get the edges of the bubbles.
The work of Strokina and et al. [9], proposes a method for the detection of bubble-like transparent objects in a liquid. Considering that, the detection problem is non-trivial since bubble appearance varies considerably due to different lighting conditions causing contrast reversal and multiple inter-reflections. They formulate the problem as the detection of concentric circular arrangements (CCA), they also use the Hough transform.
Motivated by the importance of the applications that are being developed with the use of microbubbles, both in the industry and in the medical area. There should be several options to track the grow of microbubbles, using whatever comercial or free software, however most of the software do not work in an autonomously way, consuming valuable time before obtaining the results. It is mainly, for that reason that in this paper, we propose an automatic tool for detection and tracking microbubbles generated with optical fibers, and in this way to accelerate their studies.
3 Optical Experimental Arrangement
To begin the experimental work of the generation of microbubbles with thin fiber optic tips, firstly, it is necessary to consider the type of absorbent solution to be used as well as its concentration. For this work, the absorbent substance used is a solution of carbon nanotubes dissolved in ethanol with a fixed density (ρ = 0.04mg/l0ml).
The experimental work of the generation process can be summarized in three important parts:
3.1 Selection of Fibers
Two kinds of optical fibers to generate microbubbles can be selected: normal fibers or modified fibers (Figure 2). A normal fiber optic tip measures approximately 125μm in diameter (Figure 2a). Modified fibers are normal fibers altered at the tips, in general there are two methods for that: a) thinning and b) a chemical wear.
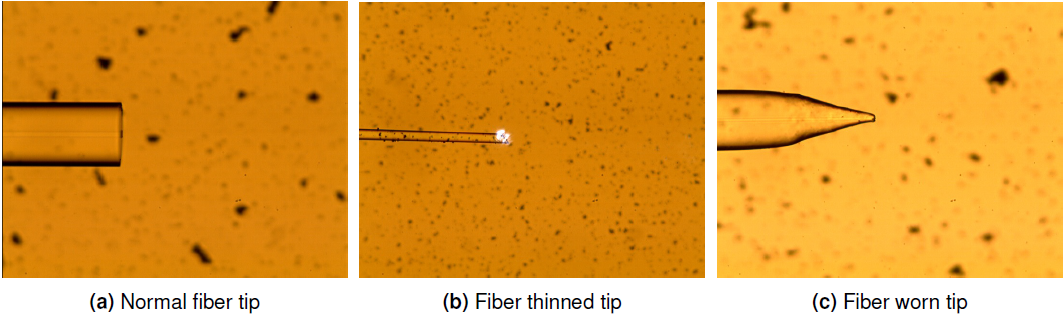
The thinned fibers are manufactured in a DOWSON machine, model OC-2010. The thinning process of the optical fiber is based on the heating and stretching method. The size of its diameters is in a range of 10,15,20,30 & 80μm in diameter (Figure 2b).
While fibers by chemical wear are manufactured by exposing the tips in hydrofluoric acid in an aqueous solution at 40%. By means of this method tips can be obtained conically (Figure 2c).
For diverse applications, to understand and characterize the differences in the generation of microbubbles with these kind of fibers is a very important topic.
3.2 Deposition of Absorbent Substance
The deposit of the absorbent substance in the fibers consists of the integration of the nanostructures in the thinned fiber optic tip. This deposition is based on the photothermal effect, which is generated when the nanostructures deposited in the fiber interact with the laser light that leaves it. As already mentioned before, for this work, the absorbent substance used is a solution of carbon nanotubes dissolved in ethanol with a fixed density.
The deposition process starts when the fiber tip is immersed in the absorbent substance, then the laser is turned on at a fixed power (P = 18.17 ± 0.05mW) for a fixed time of one minute. This step is where you get a micro-heater capable of generating heat in a very localized area.
3.3 Generation of Microbubbles
The process of generating the microbubbles consists of placing the tip (already deposited) in an ethanol solution. Following this experimental technique, is only possible to generate one bubble at a time.
To validate the methodology with different microbubbles, many tests were performed for different power values of an infrared laser of 1550nm wavelength in fixed times of 30s and visualized with a digital microscope. The image acquisition process was done with a CMOS sensor of 5MP (2592 × 1944 pixels) at 30fps. All the information obtained from each test was saved in the form videos containing completely each frame of the sequence in order to carry out (at this moment offline) the processing using the software designed. In the Figure 3, it is show the sequence of growth of a microbubble.

4 Development and Implementation of the Tool
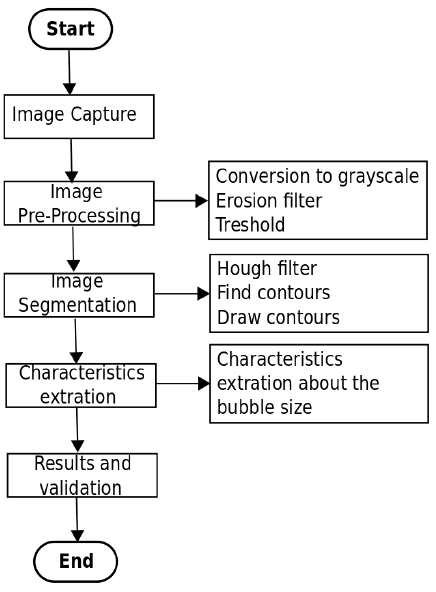
The image processing system was constituted according to the following flow diagram shown in Figure 4. Processing time required for each image was inferior to 33ms, making it possible to use it for online processing with standard camera acquisitions (25 to 30fps).
4.1 Image Capture
The first step of our software is image capture, it is important to note that at this stage of the research, this is done by extracting the first frame in the video, but in the future, as it will discussed in conclusions and future work section, this software can be easily incorporated to process directly images from the microscope. In Figure 5 it is showed an example of an image coming from the microscope. As it can be cleared viewed the image present some noise, which has been produced primarily by defocusing of the particles in the liquid. At the left of this figure it is showed the optical fiber in the form of a cylinder, and besides the microbubble generated.

4.2 Image Pre-Processing
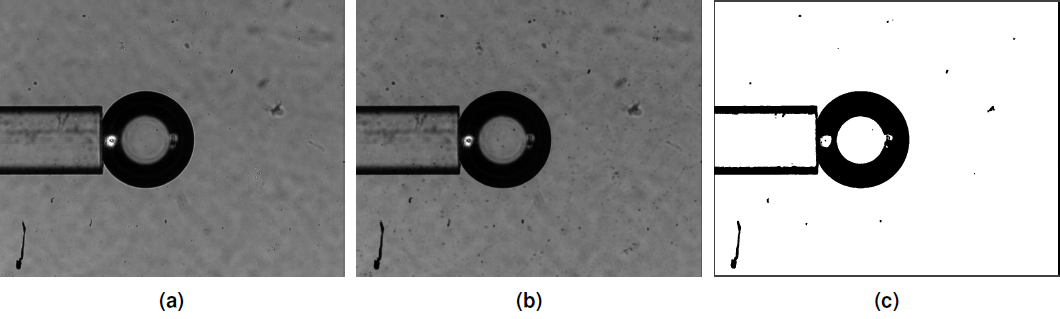
In order to effectively detect and compute the parameters of the microbubble, some pre-processing steps should be done to the image (Figure 6).
- Conversion to grayscale. As many filters and our method doesn't require color, pre-processing starts with converting the image to gray scale, this is made primarily to have an image reflecting only the changes in intensity of illumination (Figure 6a).
- Erosion filter. Following from the gray-scale conversion, a morphological erosion filter is applied in order to reduce or eliminate the unwanted bright details in the image (Figure 6b).
- Threshold. The last step in the preprocessing level is to apply a thresholding (binarization), this is done primarily with the objective of converting the image in gray scale to a binary image, so it will be easier to separate the objects from the background (Figure 6c).
4.3 Image Segmentation
Next step in Figure 4 is properly the segmentation of objects in image (Figure 7).
- Hough filter. We begin by applying a Hough filtering to finds circles. This filter is thresholding in order to select circles from the desired size and position in image (Figure 7a).
- Find contours. In order to validate results from Hough transform, simultaneously a function to look for contours over grayscale image is done. With this results it is evaluated the uncertainty of each circle generated by Hough (Figure 7b). The more contour points lie in the circle founded by Hough transform, the more is the probability of found a good result.
- Binarize contours. And finally, Next step is to generate, again a binary image to show and draw the results there (Figure 7c). This function fill the inside of selected contour; this step serve primarily to users in order to show them the final results.

4.4 Characteristics Extraction
From the information obtained from the processing step, related to the area of the circles that were drawn, now it is required to perform some simple algebraic calculations to relate this measurement with the radius of the microbubbles.
4.5 Results and Visualization
At this stage of the research, the results are exported into a file, organized in two columns in which the first column is the area of the microbubble and the second is the time. With this file it is possible to make graphs in order to get information from the experiment; as: the growth rate, the maximum radius and the growing time of the microbubbles. Simultaneously, the position of the center is obtained, which will serve for tracking their position along time for the period of time when the microbubble detaches from fiber.
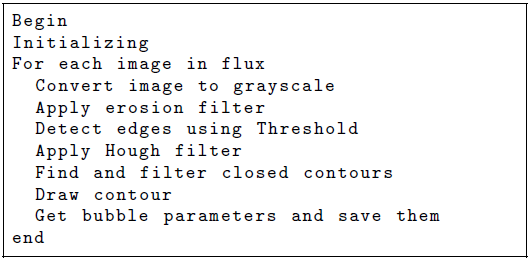
Summarizing processing steps, in the following is presented the pseudo-code of the tool.
At this stage of the research a manual threshold is used, it depends of the illumination on the image, but in general a value grater than 50 is enough. The parameters used for Hough filter were: the inverse ratio of the accumulator resolution to the image resolution dp = 2, the minimum distance between the centers of the detected circles was 80 pixels and the minimum circle radius was of 50 pixels. As we have used OpenCV library, all other functions used the default parameters.
5 Results and Validation
In Figure 9, it is observed the visualization of the processing performed with the proposed tool. On the left side you can see the original video (Figure 9a) and on the right side the processed image (Figure 9b).
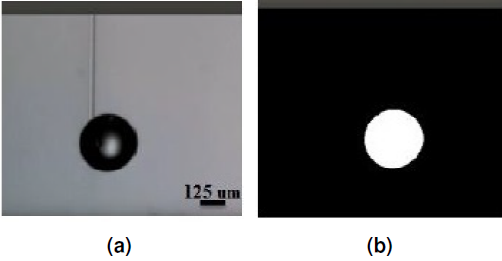
Fig. 9 Example of the processing done. In a) original image from input video, in b) thresholding processing
The analysis of the videos captured by the software designed was carried out to study the estimation values obtained through the text files exported from the software.
Thanks to a previous calibration, using the intrinsic parameters of the camera, it can be perform the required calculations to obtain the information in metric units.
Considering the growing time, which is the time that the bubble remains at the tip of the optical fiber; which corresponds to the study area of this work, is in Figure 8. The graph in Figure 10, shows the growth rate of a test analyzed by the designed software.


6 Conclusion and Future Work
In this work, we have presented the development of a software tool to estimate the position and growth of microbubbles generated at the tip of optical fibers. Microbubble characterization it is required and serves to faster studies of them, as they become of relevance in different areas of research, but particularly in medicine. The tool can be applied to microbubbles generated with different types and sizes of tips: normal, thinned or chemical wear. It can also resolve when the fiber is submerged in solutions with dissolved nanoparticles or without them. Proposed tool can deal with noise, primarily given by defocusing of microscope lens, but also with the noise present due to differents effects of the light over liquid, as reflexion and refraction Morfological filters help to maintain form of the microbubble while erasing remaining noise.
Finally our software can obtain the size and position of the bubble over time. Our software can run on diverse operating systems including operating systems for embebed computing. At this stage of the research, the tool has been adapted to detect only one microbubble, as for the experimental arrangement presented, only one microbubble can be generated at a time.
For future work, it is proposed to study the microbbubles in the next stage, in other words, while they are detached from the tip of the optical fiber. In this phase two cases can occur: that the microbubbles maintain a constant radius until they collapse. Or that by pressure difference with the liquid that surrounds it, its radius decreases until it collapses. So, it is important not only analyzes the growth but also their motion and variations over time when detached.

