


 nova página do texto(beta)
 Inglês (pdf)
 Artigo em XML
 Referências do artigo
 Enviar este artigo por email
 Citado por SciELO
  Similares em
SciELO
Similares em
SciELO 
 Permalink
1 Introduction
On May 11, 2011, a group of earthquakes occurred near to the Lorca city of Spain. The main three earthquakes that happened that day were of magnitude Mw equal to 4.5, 5.1 and 3.9 (Table 1). These earthquakes were relevant because their depth was only between 2 and 4 km and they occurred near to the Lorca city (between 4.6 and 6 km from the epicenter). The features of the earthquakes and their nearness to the Lorca city are fundamental factors that contribute to explaining the significant damages that were generated in numerous buildings in that city [32]. Particularly, one building collapsed totally and 1164 buildings suffered significant damage [32,23].
Table 1 Basic data of the main three earthquakes that occurred on May 11, 2011, near to the city of Lorca (IGN, 2017).*Foreshock, **Mainshock, ***Aftershock
| No. EQ. |
Time | Epicenter Lat. Long. |
Depth (km) |
Mag. |
|---|---|---|---|---|
| 1* | 15:05:13 | 37.7196 | 2 | 4.5 |
| -1.7076 | ||||
| 2** | 16:47:26 | 37.7175 | 4 | 5.1 |
| -1.7114 | ||||
| 3*** | 20:37:45 | 37.7308 | 4 | 3.9 |
| -1.7012 |
Unfortunately, nine persons died [33,23] during the earthquake of magnitude 5.1 mainly because of the collapse of non-structural elements as parapets of buildings [33,12,23,32]. Additionally, near 250 persons were injured due to the same earthquake of magnitude 5.1 [33]. Furthermore, the total losses assessed by the Municipality of Lorca were about 1200 million euros [28].
The study of the ground motion data of the 2011 Lorca earthquakes that we described in the present document complements some aspects of the different analysis that were performed by other researchers [37,8]. Moreover, we analyzed and underlined important features of the seismic actions that generated significant damage both in the structures and in the non-structural elements of the buildings [33,12].
The main damage to the non-structural elements occurred in the parapets of some buildings. This damage was critical because the collapse of some of those parapets was the main reason for the deaths that occurred in Lorca City during the earthquake No. 2 (Table 1) [33,12]. At the same time, the present document has the purpose of call attention to some of the pending tasks that were recommended since the occurrence of the earthquakes of Lorca in 2011. This last condition can be exemplified with the fact that nowadays there is not a new addition or modification to the seismic codes for Spain related to the experiences of the Lorca earthquakes.
In the present document, we described the most important results that we obtained from an analysis of seismic records that we performed applying the software Seismograms Analyzer-e. Specifically, we processed seismic records due to the main three earthquakes that occurred in Lorca on May 11, 2011 (Table 1).
As a part of the processing procedure, we obtained parameters and graphs to facilitate the analysis and comparison of the ground motions triggered by the Lorca earthquakes. For instance, we computed PGA (Peak Ground Acceleration), PGV (Peak Ground Velocity), PGD (Peak Ground Displacement), Fourier spectrum of amplitudes, Ia (Arias Intensity), CAV (Cumulative Absolute Velocity), CAVSTD . (Standardized Cumulative Absolute Velocity) and DSR (Significant Duration).
Furthermore, we computed parameters and graphs to analyze the seismic actions in buildings, e.g. we computed response spectra. Moreover, we assessed seismic forces that could be used to design the parapets of buildings in Lorca and, we assessed examples of the seismic forces that could have acted during the Lorca earthquakes.
Figure 1 shows the following elements: i) the epicenter of each one of the three earthquakes that we analyzed in the present study and; ii) the location of the nearest station to these epicenters (LOR station). Additionally, Figure 2 shows the location of the nearest five stations (Table 2) to the Lorca earthquakes.
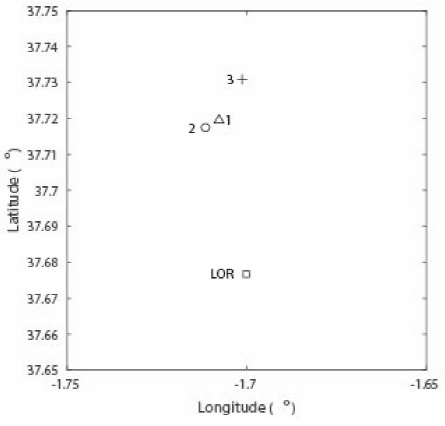
Fig. 1 Location of the epicenters of the main three earthquakes that occurred on May 11, 2011, in Lorca (Triangle-Foreshock; Circle-Mainshock; Plus symbol-Aftershock)

Table 2 Basic data about the nearest 5 stations to the earthquakes of Table 1
| Station name |
Station Location |
Station coordinates Lat. Long. |
Type of soil |
|---|---|---|---|
| LOR | Lorca | 37.67673 | Rock |
| (Murcia) | -1.70023 | (R) | |
| ZAR | Zarcilla | 37.84462 | Firm soil |
| de Ramos | -1.87790 | (H) | |
| (Murcia) | |||
| AM2 | Alhama de | 37.84153 | Soft soil |
| Murcia | -1.43440 | (S) | |
| (Murcia) | |||
| VLR | Vélez-Rubio | 37.64825 | Firm soil |
| (Almería) | -2.07450 | (H) | |
| MUL | Mula | 38.03960 | Firm soil |
| (Murcia) | -1.49412 | (H) |
2 Obtaining and Analyzing Ground Motion Data
2.1 Obtaining the Data
The procedure for obtaining the data is, in general, a basic step in numerous research projects. In the case of the study of the earthquakes the seismic stations are essential to obtain records of the features of the ground motions1
Nowadays, the researchers analyze seismic records that are obtained by diverse national and international institutions. This last condition also means that the possibility that the researchers can access the data depends on different factors including the particular rules of each public or private institution that manage a network of seismic stations. At the same time, it is convenient to highlight that there are important advances in the creation of new tools that allow obtaining without any cost, seismic records that have been recorded by different networks around the world. However, nowadays, there are significant quantities of seismic records that are not public.
For these reasons, it is convenient to continue with the activities and the assignations of economic resources that increase the number of public seismic records available. The free access to any seismic record will contribute to increasing our knowledge about earthquakes. In the case of the Lorca earthquakes, the nearest seismic stations available during the occurrence of the earthquakes were stations of the IGN. For this reason, we did a request to the IGN to obtain the seismic records of Lorca. Fortunately, the criteria of the IGN is to share the seismic data, and this condition allowed us to do the present study.
2.2 General Data of the Seismic Records
In the present study, we analyzed the accelerograms of the seismic records listed in Table 3 to Table 8 due to the three main earthquakes of Lorca (Table 1). As we mentioned previously, the nearest station to the epicenters of the earthquakes (Table 1) is the LOR station, which is located among 4.6 and 6 km from the epicenters (Table 3 and Table 4). The distance from other stations to the epicenters of the three earthquakes range among 20 and 40.6 km (Table 3 and Table 4).
Table 3 List of records of ground acceleration related to the earthquake No. 1 (Table 1)
| Record Id |
Station name |
Start Time | Distance to the epicenter (km) |
|---|---|---|---|
| 1-1 | LOR | 15:05:03.955 | 4.8 |
| 1-2 | ZAR | 15:05:09.365 | 20.4 |
| 1-3 | AM2 | 15:05:08.000 | 27.6 |
| 1-4 | VLR | 15:05:14.485 | 33.3 |
| 1-5 | MUL | 15:05:00.875 | 40.2 |
Table 4 List of records of ground acceleration related to the earthquake No. 2 (Table 1)
| Record Id |
Station name |
Start Time | Distance to the epicenter (km) |
|---|---|---|---|
| 2-1 | LOR | 16:47:16.645 | 4.6 |
| 2-2 | ZAR | 16:47:20.765 | 20.3 |
| 2-3 | AM2 | 16:47:19.000 | 28 |
| 2-4 | VLR | 16:47:23.695 | 32.9 |
| 2-5 | MUL | 16:47:13.355 | 40.6 |
Table 5 Parameters of PGA, PGV, PGD, Arias Intensity, DSR, CAV, and CAVSTD related to the ground motion data recorded at 5 seismic stations during the earthquake 2 of magnitude 5.1 (Table 1).*Component.**Distance to the epicenter
| Station | c* | d** [km] |
PGA [g] | PGV[m/s] | PGD [m] | Ia [cm/s] | DSR [s] | Tini[s] | Tfin[s] | CAV [cm/s] |
CAVSTD [cm/s] |
|---|---|---|---|---|---|---|---|---|---|---|---|
| 2.1LOR | N30W | 4.6 | 3.65E-01 | 3.56E-01 | 3.45E-02 | 5.277E+01 | 0.95 | 11.23 | 12.18 | 2.72E+02 | 2.11E+02 |
| E30N | 4.6 | 1.54E-01 | 1.42E-01 | 1.46E-02 | 1.105E+01 | 3.40 | 11.14 | 14.54 | 1.66E+02 | 1.13E+02 | |
| V | 4.6 | 1.18E-01 | 8.01E-02 | 1.69E-02 | 4.681E+00 | 3.20 | 10.80 | 14.00 | 1.08E+02 | 6.15E+01 | |
| 2.2ZAR | NS | 20.3 | 2.57E-02 | 2.13E-02 | 3.60E-03 | 1.145E+00 | 11.75 | 13.36 | 25.11 | 9.27E+01 | 9.16E+00 |
| EW | 20.3 | 3.16E-02 | 2.06E-02 | 3.17E-03 | 1.472E+00 | 11.84 | 13.57 | 25.41 | 1.05E+02 | 2.67E+01 | |
| V | 20.3 | 2.52E-02 | 1.29E-02 | 2.78E-03 | 8.105E-01 | 11.29 | 11.80 | 23.09 | 7.59E+01 | 6.49E+00 | |
| 2.3AM2 | NS | 28 | 4.18E-02 | 1.31E-02 | 2.03E-03 | 1.539E+00 | 10.34 | 15.82 | 26.16 | 1.04E+02 | 4.73E+01 |
| EW | 28 | 4.46E-02 | 2.07E-02 | 1.44E-03 | 1.589E+00 | 9.54 | 15.93 | 25.47 | 1.03E+02 | 3.58E+01 | |
| V | 28 | 2.37E-02 | 7.40E-03 | 1.09E-03 | 6.216E-01 | 11.15 | 13.05 | 24.20 | 6.74E+01 | 0 | |
| 2.4VLR | NS | 32.9 | 1.08E-02 | 4.67E-03 | 1.00E-03 | 1.166E-01 | 18.17 | 12.49 | 30.66 | 3.28E+01 | 0 |
| EW | 32.9 | 9.48E-03 | 5.88E-03 | 1.20E-03 | 1.397E-01 | 14.80 | 12.99 | 27.79 | 3.51E+01 | 0 | |
| V | 32.9 | 6.02E-03 | 3.64E-03 | 7.38E-04 | 5.361E-02 | 16.54 | 10.77 | 27.31 | 2.25E+01 | 0 | |
| 2.5MUL | NS | 40.6 | 3.60E-02 | 1.53E-02 | 1.49E-03 | 1.431E+00 | 13.31 | 24.07 | 37.38 | 1.13E+02 | 3.37E+01 |
| EW | 40.6 | 4.13E-02 | 1.35E-02 | 1.59E-03 | 1.610E+00 | 9.97 | 26.03 | 36.00 | 1.09E+02 | 3.55E+01 | |
| V | 40.6 | 2.06E-02 | 9.20E-03 | 1.17E-03 | 6.200E-01 | 15.23 | 20.96 | 36.19 | 7.21E+01 | 0 |
Table 6 Parameters of PGA, PGV, PGD, Arias Intensity, DSR, and CAV related to the ground motion data recorded at 5 stations during the earthquake 2 of magnitude 5.1 (Table 1).*Component.**Distance to the epicenter
| Station | c* | d** [km] |
PGA [g] | PGV[m/s] | PGD [m] | Ia [cm/s] | DSR [s] | Tini[s] | Tfin[s] | CAV [cm/s] |
CAVSTD
[cm/s] |
|---|---|---|---|---|---|---|---|---|---|---|---|
| 1.1LOR | N30W | 4.8 | 2.76E-01 | 1.28E-01 | 1.03E-02 | 1.417E+01 | 0.54 | 11.09 | 11.63 | 1.07E+02 | 8.45E+01 |
| E30N | 4.8 | 1.30E-01 | 3.99E-02 | 3.17E-03 | 2.650E+00 | 1.91 | 10.88 | 12.79 | 6.66E+01 | 4.06E+01 | |
| V | 4.8 | 7.63E-02 | 2.30E-02 | 2.87E-03 | 1.815E+00 | 1.72 | 10.39 | 12.11 | 5.45E+01 | 3.47E+01 | |
| 1.2ZAR | NS | 20.4 | 6.41E-03 | 3.40E-03 | 4.45E-04 | 6.089E-02 | 12.16 | 11.43 | 23.59 | 2.12E+01 | 0 |
| EW | 20.4 | 9.98E-03 | 4.51E-03 | 4.40E-04 | 8.211E-02 | 12.5 | 11.66 | 24.16 | 2.49E+01 | 0 | |
| V | 20.4 | 8.16E-03 | 1.85E-03 | 2.88E-04 | 5.930E-02 | 11.88 | 9.62 | 21.5 | 2.02E+01 | 0 | |
| 1.3AM2 | NS | 27.6 | 1.05E-02 | 2.17E-03 | 2.37E-04 | 8.895E-02 | 9.39 | 13.75 | 23.14 | 2.29E+01 | 0 |
| EW | 27.6 | 1.19E-02 | 2.93E-03 | 2.19E-04 | 8.501E-02 | 9.42 | 13.40 | 22.82 | 2.21E+01 | 0 | |
| V | 27.6 | 7.37E-03 | 1.28E-03 | 1.42E-04 | 5.416E-02 | 9.86 | 11.03 | 20.89 | 1.80E+01 | 0 | |
| 1.4VLR | NS | 33.3 | 3.30E-03 | 8.68E-04 | 1.66E-04 | 8.455E-03 | 10.46 | 7.25 | 17.71 | 6.91E+00 | 0 |
| EW | 33.3 | 2.58E-03 | 1.19E-03 | 1.49E-04 | 8.866E-03 | 11.23 | 7.45 | 18.68 | 7.12E+00 | 0 | |
| V | 33.3 | 2.02E-03 | 7.87E-04 | 1.91E-04 | 4.917E-03 | 11.92 | 5.93 | 17.85 | 5.52E+00 | 0 | |
| 1.5MUL | NS | 40.2 | 6.45E-03 | 2.83E-03 | 2.23E-04 | 8.678E-02 | 42.98 | 5.87 | 48.85 | 4.31E+00 | 0 |
| EW | 40.2 | 8.04E-03 | 1.87E-03 | 1.41E-04 | 6.965E-02 | 14.93 | 22.01 | 36.94 | 2.65E+01 | 0 | |
| V | 40.2 | 5.67E-03 | 1.52E-03 | 1.48E-04 | 3.936E-02 | 17.90 | 20.03 | 37.93 | 2.20E+01 | 0 |
Table 7 Parameters of PGA, PGV, PGD, Arias Intensity, DSR, and CAV related to the ground motion data recorded at 5 stations during the earthquake 2 of magnitude 5.1 (Table 1). *Component.**Distance to the epicenter
| Station | c* | d** [km] |
PGA [g] | PGV[m/s] | PGD [m] | Ia [cm/s] | DSR [s] | Tini[s] | Tfin[s] | CAV [cm/s] |
CAVSTD
[cm/s] |
|---|---|---|---|---|---|---|---|---|---|---|---|
| 3.1LOR | N30W | 4.8 | 6.40E-02 | 1.78E-02 | 1.34E-03 | 4.673E-01 | 1.15 | 11.11 | 12.26 | 2.36E+01 | 1.05E+01 |
| E30N | 4.8 | 2.64E-02 | 7.93E-03 | 4.21E-04 | 2.147E-01 | 2.79 | 10.32 | 13.11 | 2.37E+01 | 8.27E+00 | |
| V | 4.8 | 1.99E-02 | 5.43E-03 | 4.19E-04 | 1.356E-01 | 2.27 | 10.07 | 12.34 | 1.69E+01 | 0 | |
| 3.2ZAR | NS | 20.4 | 3.60E-03 | 1.12E-03 | 9.25E-05 | 1.686E-02 | 9.60 | 9.96 | 19.56 | 9.98E+00 | 0 |
| EW | 20.4 | 4.31E-03 | 1.58E-03 | 1.45E-04 | 2.105E-02 | 9.90 | 10.13 | 20.03 | 1.09E+01 | 0 | |
| V | 20.4 | 3.99E-03 | 1.10E-03 | 7.64E-05 | 1.911E-02 | 9.47 | 8.06 | 17.53 | 1.06E+01 | 0 | |
| 3.3AM2 | NS | 27.6 | 5.80E-03 | 1.17E-03 | 6.32E-05 | 3.116E-02 | 10.09 | 13.27 | 23.36 | 1.37E+01 | 0 |
| EW | 27.6 | 5.99E-03 | 1.59E-03 | 6.66E-05 | 2.478E-02 | 9.46 | 13.4 | 22.86 | 1.24E+01 | 0 | |
| VV | 27.6 | 3.36E-03 | 8.18E-04 | 5.26E-05 | 1.401E-02 | 10.59 | 11.65 | 22.24 | 9.61E+00 | 0 | |
| 3.5MUL | NS | 40.2 | 5.03E-03 | 1.64E-03 | 1.52E-04 | 4.043E-02 | 32.32 | 7.84 | 40.16 | 2.56E+01 | 0 |
| EW | 40.2 | 5.95E-03 | 1.57E-03 | 7.95E-05 | 3.212E-02 | 12.66 | 17.02 | 29.68 | 1.68E+01 | 0 | |
| VV | 40.2 | 2.65E-03 | 1.17E-03 | 7.35E-05 | 2.571E-02 | 38.45 | 3.95 | 42.40 | 2.34E+01 | 0 |
Table 8 List of records of ground acceleration related to the earthquake No. 3 (Table 1)
| Record Id |
Station name |
Start Time | Distance to the epicenter (km) |
|---|---|---|---|
| 3-1 | LOR | 20:37:36.045 | 6 |
| 3-2 | ZAR | 20:37:42.645 | 20 |
| 3-3 | AM2 | 20:37:39.000 | 26.5 |
| 3-5 | MUL | 20:37:38.395 | 38.9 |
Therefore, we analyzed the records of all the stations (Table 2) but with the emphasis in the seismic records of the LOR station, due to its nearness with the epicenters. As a part of the analysis, we corrected the acceleration data of the seismic records listed in Tables 3 to 8 applying the following two steps: a) baseline correction [1], which is done through the process where a constant value is subtracted to the complete record.
This value is the average of the accelerations of the complete record; b) application of a high-pass Butterworth filtering of third order. We did the correction of the seismic records applying the software Seismograms Analyzer-e V2.0 [4]. This is a freeware software written in Matlab language [1,4]. Seismograms Analyzer-e (SAe) is a standalone software that can be installed on any computer with operative system Windows 7 or higher [4].
2.3.1 Key features of the seismic records obtained during the earthquake No.2 in the five stations (Table 2), with the emphasis in the records of the LOR station
The mainshock (earthquake No. 2) occurred at 16:47:26 [one hour and forty-two minutes after the foreshock (earthquake No.1)]. According to [21,25] the rupture area of this last earthquake was approximately delimited by a rectangle of 4 by 2 km and the fault is a reverse strike-slip type.
Moreover, as a part of an analysis of the fault rupture [27] of the earthquake No.2, it was identified that the sensor oriented in the direction N30W is almost perpendicular to the direction of the fault rupture [27,6]. This last condition is represented in the simplified diagram of Figure 4.
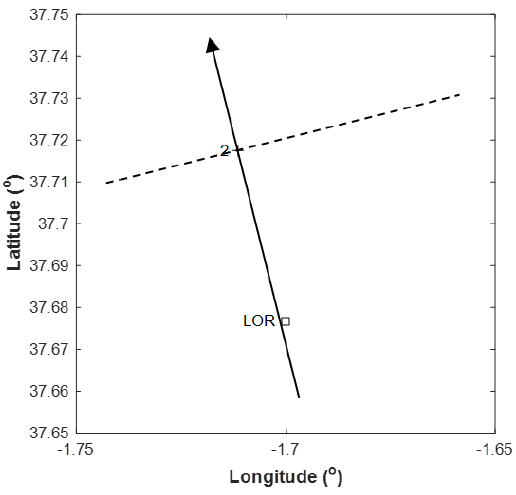
Fig. 4 A simplified representation of the direction of the N30W component (arrow) of the LOR station with respect to the main plane of the fault (dashed line) of the earthquake No. 2 [27]
The maximum value of PGA at the LOR station due to the earthquake No. 2 was of 0.365 g (N30W component-Table 5), which is 2.4 times greater than the value of PGA in the E30N component (Figure 3). The significant differences among these two values of PGA are mainly attributable to directivity effects [37,25]. The value of PGA equal to 0.365 g corresponds to the highest value of PGA ever recorded in Spain [24]. Moreover, at the LOR station, the maximum value of PGV and PGD due to the earthquake No. 2 were of 0.36 m/s (N30W component), and 0.03 m (N30W component), respectively.
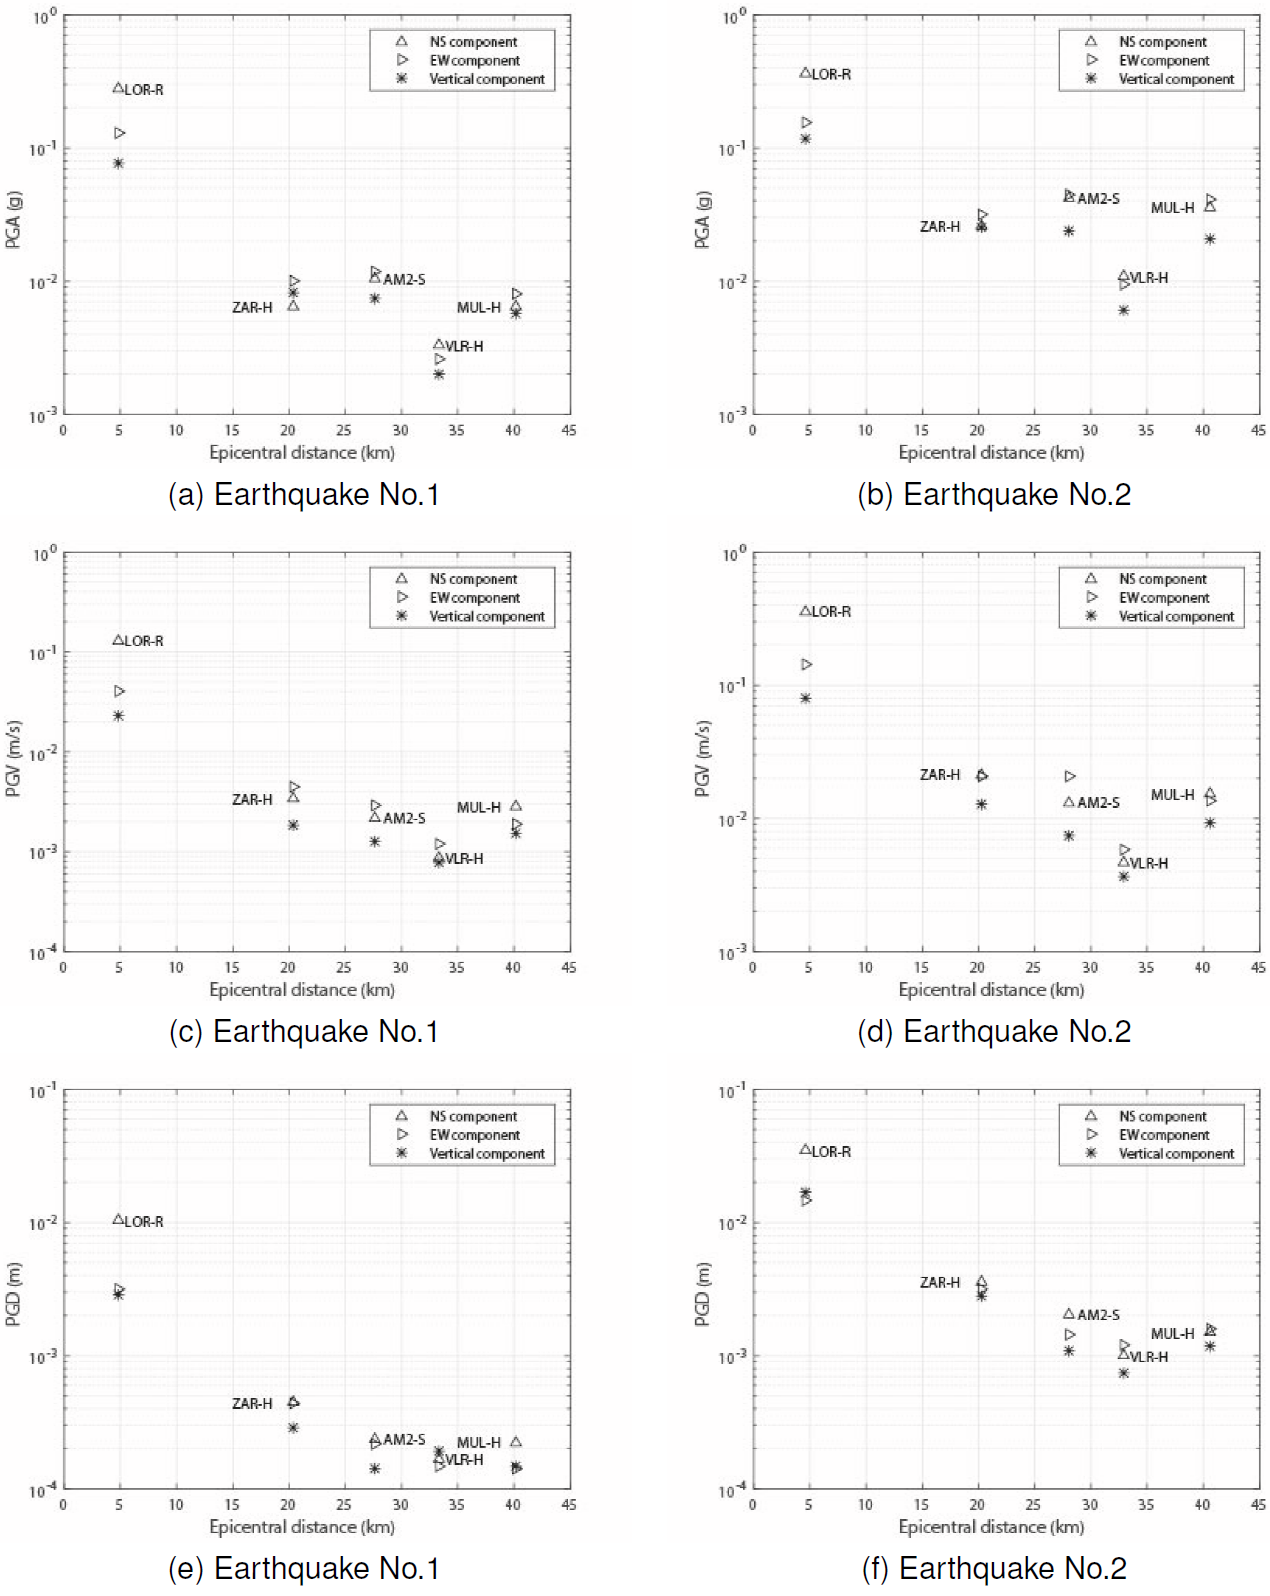
Fig. 3 Values of PGA, PGV, and PGD, for the three components in every station (Table 3) versus the distance to the epicenter of the earthquakes No. 1 and 2 (mainshock). Note: At the LOR station the values of PGA correspond to the component N30W and E30N
We also used the seismic records to compute the following parameters: Ia and DSR . Ia is a parameter that gives us information about the accumulation of energy in earthquakes records [16,35]. DSR is a parameter oriented to obtain information about the potential of damage of an earthquake.
Particularly, DSR can be defined as a time interval over which a segment of the energy of the seismic record is accumulated [16]. In the present study, we considered values of DSR limited among the 5% of Ia and the 95% of Ia because it is a common interval [16,15].
However, it is important to have in mind that according to Reinoso and Ordaz [31], in some cases is more appropriate computing DSR considering the interval among 2.5 and 97.5% of Ia . Additionally, we also computed CAV and CAVSTD , which are parameters that can be used as a reference to assess the destructive capacity of a ground motion [9,10,11,19]. CAV and CAVSTD are defined according to Eq.1 and Eq. 2, respectively:
where
where N is the number of non-overlapping one-second time intervals, PGAi is the peak ground acceleration (g) in time interval i, and H(x) is the Heaviside Step Function defined as H(x)=0 for x < 0 and 1 otherwise [11,19].
At the LOR station, the maximum value of Ia and CAV were equal to 52.77 cm/s (N30W component) and 272 cm/s (N30W component), respectively. At the same time, it is possible to observe that the highest values of PGA (Figure 3b), PGV (Figure 3d), PGD (Figure 3f), Ia , and CAV related to the earthquake No.2 were determined in the N30W component, and that these values are significantly higher than the corresponding values for the other components. Similar behavior occurs with the values of DSR (Table 5). On the other hand, we observed that at the AM2-S station (Table 2) was recorded the second largest value of PGA during the earthquake No. 2 (Table 5). In this last station located in soft soil to 28 km from the epicenter, the highest value of PGA recorded was of 0.045 g (EW component). Additionally, the earthquake No. 2 was recorded at the stations ZAR, VLR, and MUL, located to a distance from the epicenter of 20.3 km, 32.9 km, and 40.6 km, respectively. The highest values of PGA for these last stations were equal to 0.032 g (EW component), 0.011 g (NS component), and 0.041 g (EW component), respectively.
According to Figure 3b at the MUL station were recorded during the earthquake No. 2, values of PGA significantly higher than at the VLR station, although the MUL station is separated from the epicenter at a distance greater (9 km) than the VLR station. Additionally, we identified in Figure 3b that at the stations AM2, VLR, and MUL during the earthquake No.2, the values of PGA of the vertical component were values significantly lower than the values of PGA of the horizontal components.
2.3.2 Key features of the seismic records obtained during the earthquake No.1 at the five stations (Table 2), with the emphasis in the records of the LOR station
The earthquake of magnitude 4.5 occurred at 15:05:13 and triggered at the LOR station (located to 4.8 km from the epicenter) maximum value of PGA equal to 0.276 g in the N30W component (Table 6). This acceleration is 2.1 times greater than the value of PGA recorded at the E30N component (Table 6), and 3.6 times greater than the value of PGA in the vertical component (Table 6). Similarly to the case of the mainshock, the significant differences among these values of PGA are also mainly attributable to directivity effects [37,25]. On the other hand, the maximum values of both PGV and PGD due to the seismic record 1-1 (Table 3) are equal to 0.128 m/s (N30W component) and 0.01 m (N30W component), respectively. According to the results, at the LOR station, the maximum value of Ia due to the earthquake No.1 is equal to 14.17 cm/s in the N30W component (Table 6 and Figure 5), which is 5.4 times greater than Ia in the E30N component. Moreover, the maximum value of CAV at the LOR station is equal to 107 cm/s in the N30W, which is 1.61 times greater than the CAV value in the E30N component. Therefore, it is possible to observe that during the earthquake No. 1 the highest values of PGA (Figure 3a), PGV (Figure 3c), PGD (Figure 3e), Ia , and CAV are associated to the N30W component of the LOR station. On the other hand, the DSR values for the E30N and the V components are more than three times greater than the DSR for N30W component (Table 6). Additionally, it is possible to observe that the seismic waves that arrived at LOR station liberated the largest part of their total energy in less than 2s.
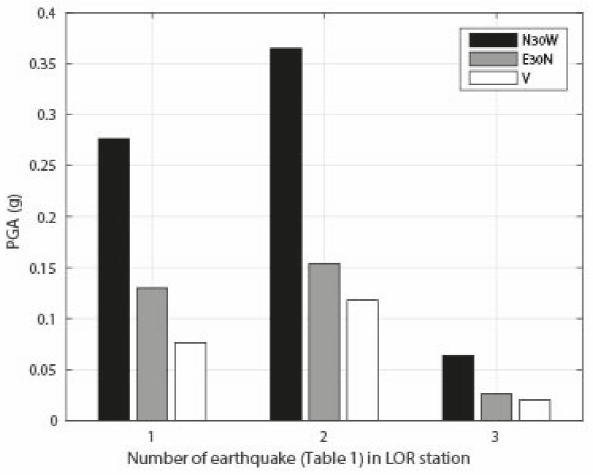
Fig. 5 Values of PGA recorded at the three components of the LOR station during the three earthquakes (Table 1)
On the other side, at the AM2-S station (located in soft soil to 27.6 km from the epicenter) was recorded a value of PGA equal to 0.012 g (EW component), which is the second largest value of PGA recorded during the earthquake No. 1. Additionally, the earthquake No. 1 was recorded at the stations ZAR, VLR, and MUL (Table 6).
Furthermore, when we compared in Figure 3a, the values of PGA that were recorded at the three stations that are on firm soil (ZAR-H, VLR-H, and MUL-H. H stands for firm soil-Table 2) during the earthquake No.1, we observed that the values of PGA for the three components recorded at the station MUL-H located about 40.2 km from the epicenter of the earthquake No.1 are higher than the values of PGA for the three components recorded at the station VLR-H located about 33.3 km from the same epicenter. Therefore, this last condition suggests the presence of path effects and local effects at the MUL station, especially because the MUL-H and VLR-H stations are in opposite directions from the epicenter (the distance among the MUL and VLR station is of 67.01 km). According to the study of Garcia-Jerez et al [22], the MUL station is located in a region with complex geology, therefore this complexity explains part of the differences among the values recorded at MUL and VLR stations. In the case of the values of PGA recorded at the station AM2, it is possible to infer that the high values of PGA in this station are due mainly to local effects because this station is located on soft soil.
2.3.3 Key features of the seismic records obtained during the earthquake No.3 at the five stations (Table 2), with the emphasis in the records of the LOR station
The aftershock (earthquake No. 3) occurred 3 hours and 50 minutes after the mainshock, and the maximum value of PGA recorded at the LOR station during this event was of 0.064 g (N30W component-Table 7). This value of PGA is 2.4 times greater than the value of PGA in the E30N component (0.026 g). Furthermore, it is possible to observe that the maximum value of Ia at the LOR station due to the earthquake No. 3 is equal to 0.47 cm/s in the N30W component (Table 7), which is 2.2 times greater than Ia in the E30N component. Additionally, the maximum value of CAV is equal to 23.6 cm/s and it was determined in the N30W component. On the other hand, the DSR value in the N30W component is equal to 1.15 s, but equal to 2.79 s and 2.27 s, for the E30N and vertical components, respectively. Only in the components N30W and E30N of the LOR station, the value of CAVSTD was different from zero.
2.4 Comparative Analysis of the Seismic Records Due to the three Earthquakes
According to the data of Tables 5 to 7 and Figures 5 and 6, it is possible to observe that in the three earthquakes (No. 1, 2 and 3) the highest values of PGA recorded at the LOR station occurred in the N30W component. Moreover, the values of PGA in the N30W component were at least two times greater than the values of PGA in the other components (EW30 and vertical). Additionally, in the three cases, the DSR of the component N30W was significantly lower than the DSR of the other two components (E30N and V).
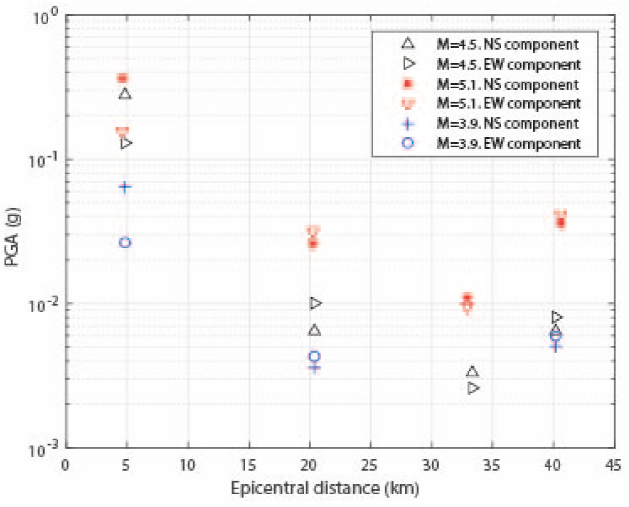
Fig. 6 Values of PGA for the horizontal components in four stations (Table 3) versus the distance to the epicenter of the three earthquakes (Table 1). Note: at the LOR station the values of PGA of the horizontal components correspond to the components N30W and E30N
On the other hand, it is possible to observe that the PGA generated by the earthquake No. 2 in the component EW30 at the LOR station was just 18% greater than the PGA generated in the same component and in the same station, but by the earthquake No.1. Therefore, the ground shaking generated by the earthquake No. 1 in the component E30W at the LOR station was almost so powerful as the ground shaking generated by the earthquake No. 2 (mainshock) at the same station and in the same component. Both earthquakes No. 1 and No. 2 were located along the same Alhama de Murcia Fault zone and both earthquakes had a similar focal mechanism [6]. Additionally, it is possible to observe in Figure 2 that the epicenters of both earthquakes No.1 and No.2 are located to a short distance among them. Particularly, the separation among these two epicenters is of 0.41 km. However, the distance among the hypocenters of both earthquakes is about 2 km.
In Figure 8, we can identify similarities and differences among the features of the accelerograms and the velocigrams of the component N30W of the LOR station due to earthquakes No.1, 2, and 3. For instance, the significant values of accelerations in the three earthquakes occur in a lapse of about 1 s. However, to do a more detailed comparison among earthquakes No.1 and No.2, it is possible to observe Figure 10. Then, according to this last figure, we can observe differences among the shape of the seismic records at the LOR station due to earthquakes No.1 and 2. Besides, to observe more differences among the three earthquakes, we can analyze the same seismic records in the frequency domain. For instance, we can compare the Fourier spectra of amplitude (Figures 7a, 7c, and 7e) related to the accelerograms of Figure 8. According to the Fourier spectra of Figures 7a, 7c, and 7e, the maximum energy of the movement at the LOR station is approximately in the band of frequencies among 0.7 and 18 Hz, among 0.4 and 10 Hz, and among 1 and 18 Hz, for the earthquakes No.1, 2, and 3, respectively. Similarly, according to the same Fourier spectra, the maximum amplitude is approximately in the range of 2 to 4 Hz, of 1.5 to 4 Hz, and of 1 to 5 Hz, for the earthquakes No.1, 2, and 3, respectively. Moreover, it is possible to highlight that the amplitudes in the earthquake No. 2 are significantly greater than in the earthquakes No.1 and No. 3; and that the Fourier spectrum due to earthquake No.2 has a higher content of frequencies than the Fourier spectrum due to earthquake No. 1.
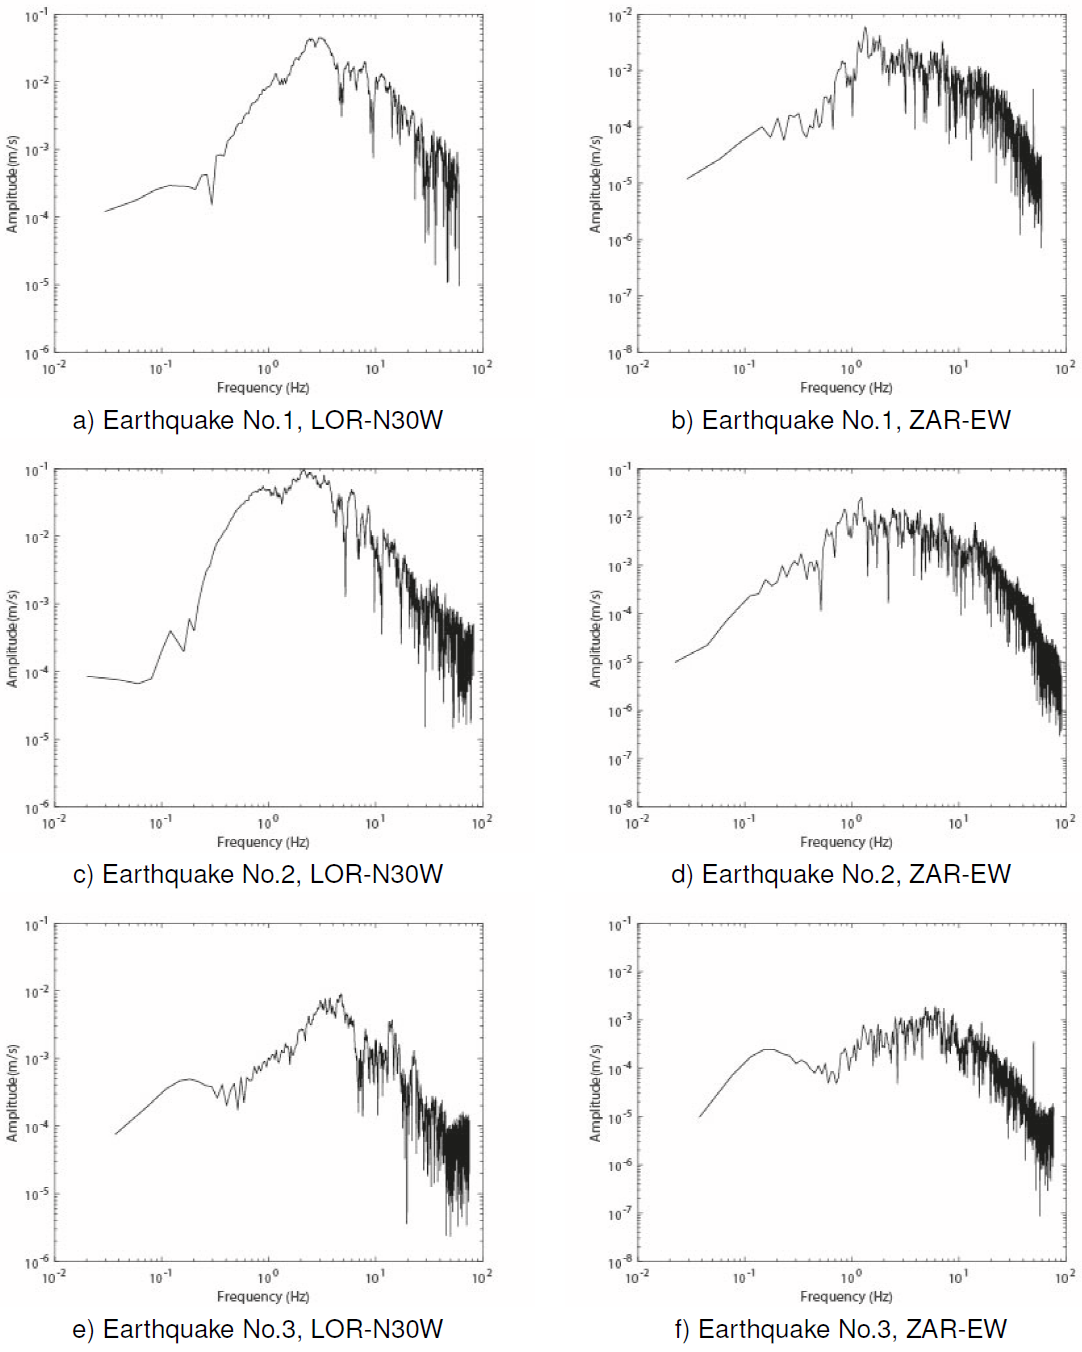
Fig. 7 Fourier spectra generated from the corrected acceleration recorded during the earthquakes No. 1, 2, and 3
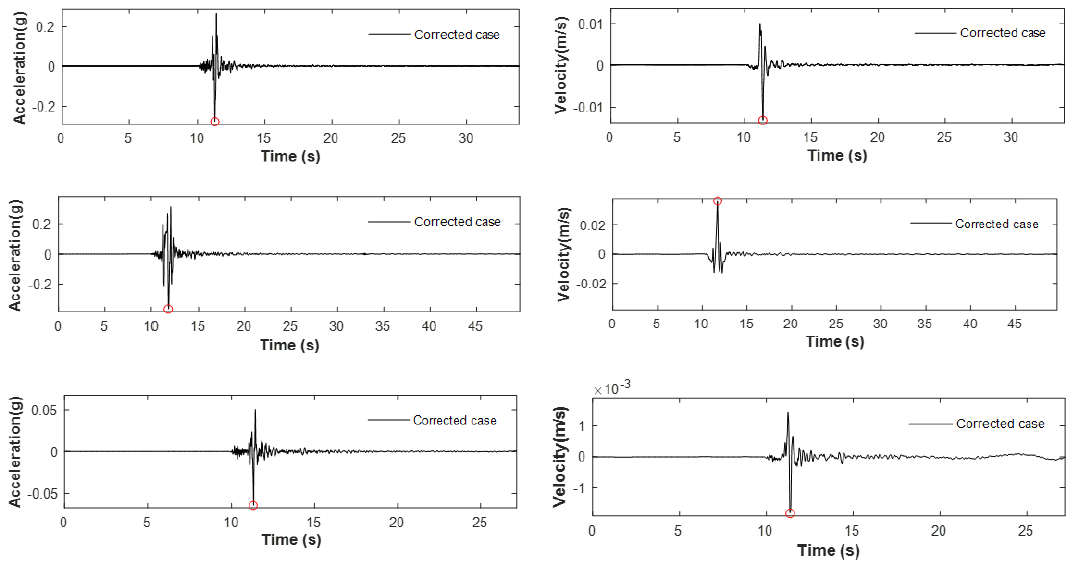
Fig. 8 Corrected accelerations and velocities of the seismic records of the component N30W that were recorded at the LOR station (Table 2) due to the three earthquakes (No.1 - top, No. 2 - middle, No 3 - bottom)
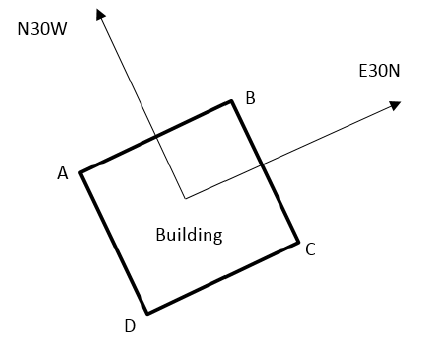
Fig. 9 Plan view of a hypothetical building that has the characteristic that two of their facades coincide with the axis N30W and the another two coincide with the axis E30N
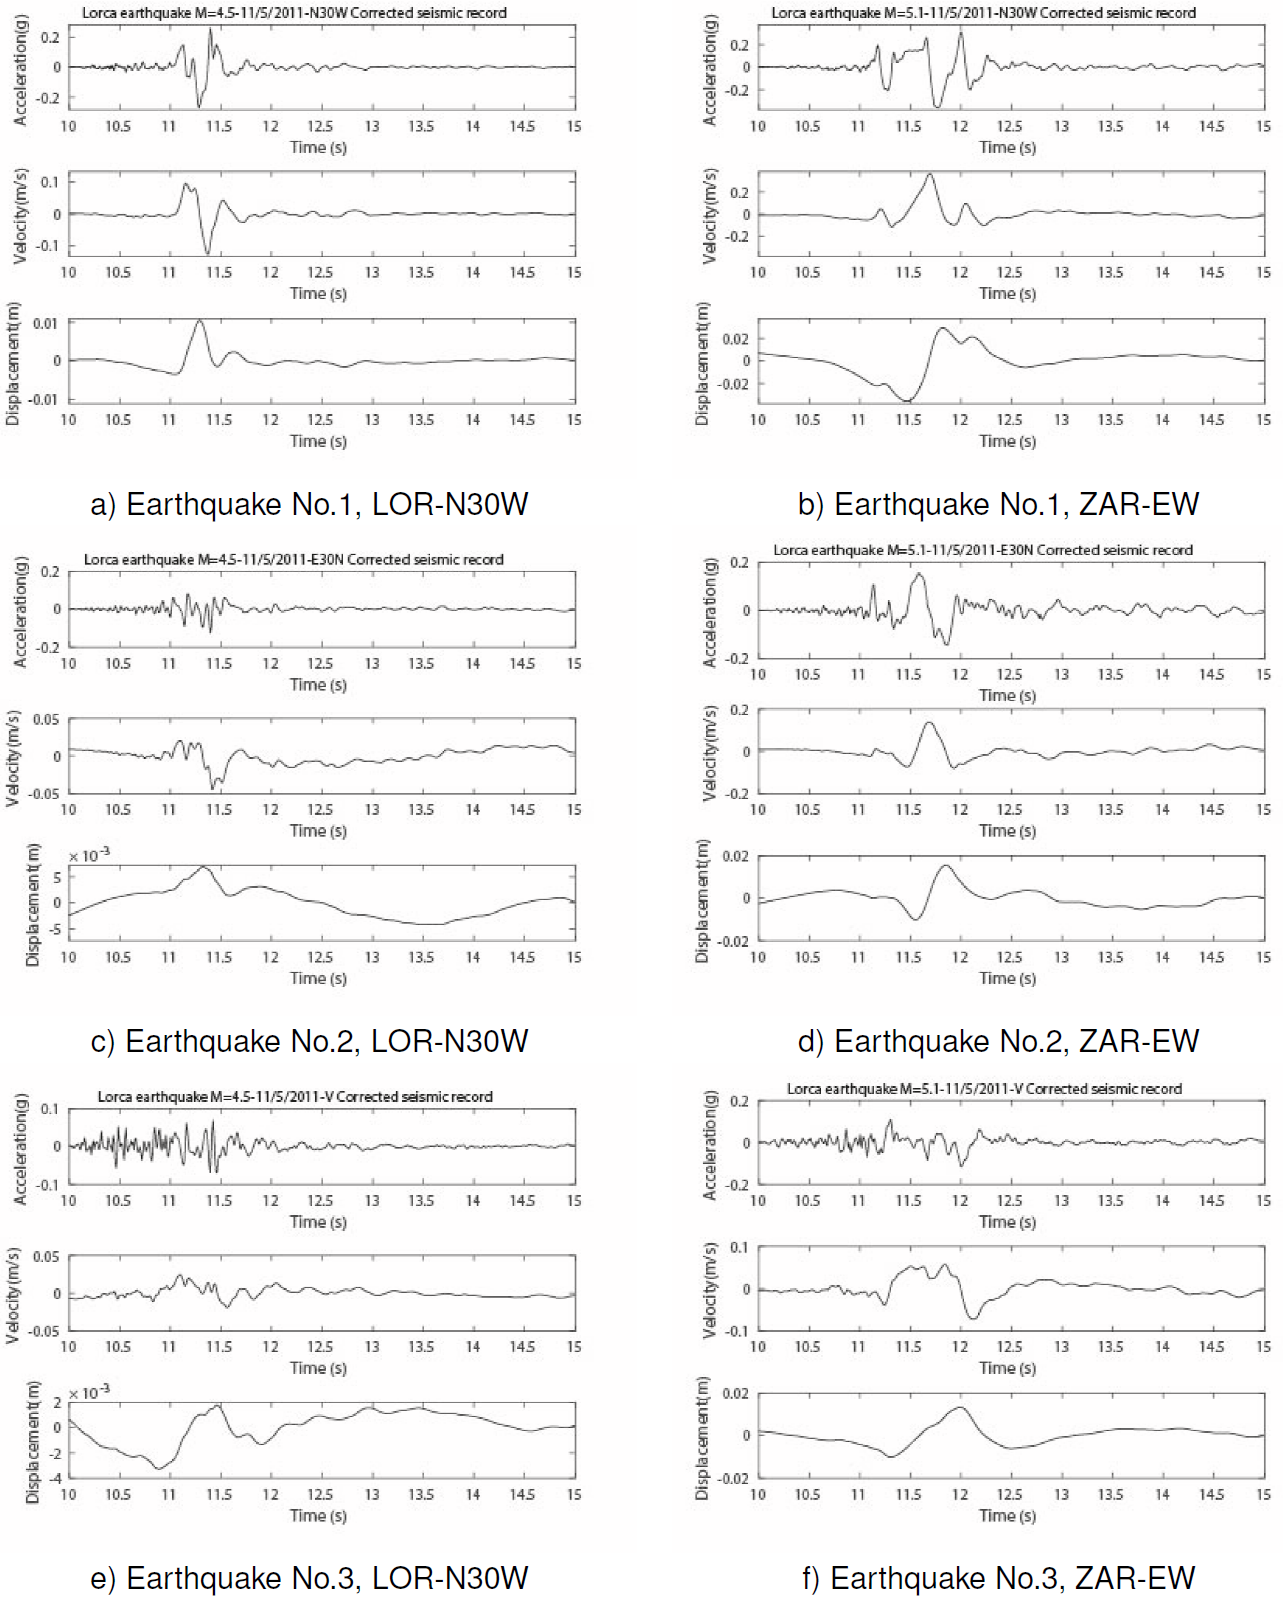
Fig. 10 Seismic records of acceleration, velocity and displacement (3 components) at the LOR station for the earthquakes No.1 (a, c, and e) and No. 2 (b, d, and f)
On the other hand, in Figure 8 and Figure 10, we can identify the presence of one of the most significant of the near-source effects, which is known as forward rupture directivity [14]. According to [14], this effect 'can be identified by a large full-cycle pulse at the beginning of velocity record containing most of its energy'. Figure 8 shows this last type of large full-cycle pulse in the seismic record of velocities, however, this condition can be due to the near-source effects but also due to the limited size and duration of the earthquakes. On the other hand, according to the graphs in Figure 10, the maximum displacement in the three earthquakes occurred just an instant before of the maximum velocity. This last behavior occurred in all the cases except case (d) component E30W, earthquake No. 1.
In the graphs of Figure 11, it is possible to identify some of the features of the seismic records obtained during the three earthquakes in Lorca (Table 1). These graphs show the features (accelerations, velocities, and displacements) of the particle motion. It is possible to observe in these graphs that the predominant direction of the movement of the particle at the LOR station was practically the N30W direction (Figure 11) during the three earthquakes. This last feature is due to the presence of the directivity effects (previously mentioned) at the LOR station during the three earthquakes. However, we not observed a clear preferential direction at the rest of the stations (Table 2) during the same earthquakes. For instance, (Figure 12) shows the features of the particle motion at the ZAR station (Table 2), which is the closest station to the LOR station (24.34 km among them).
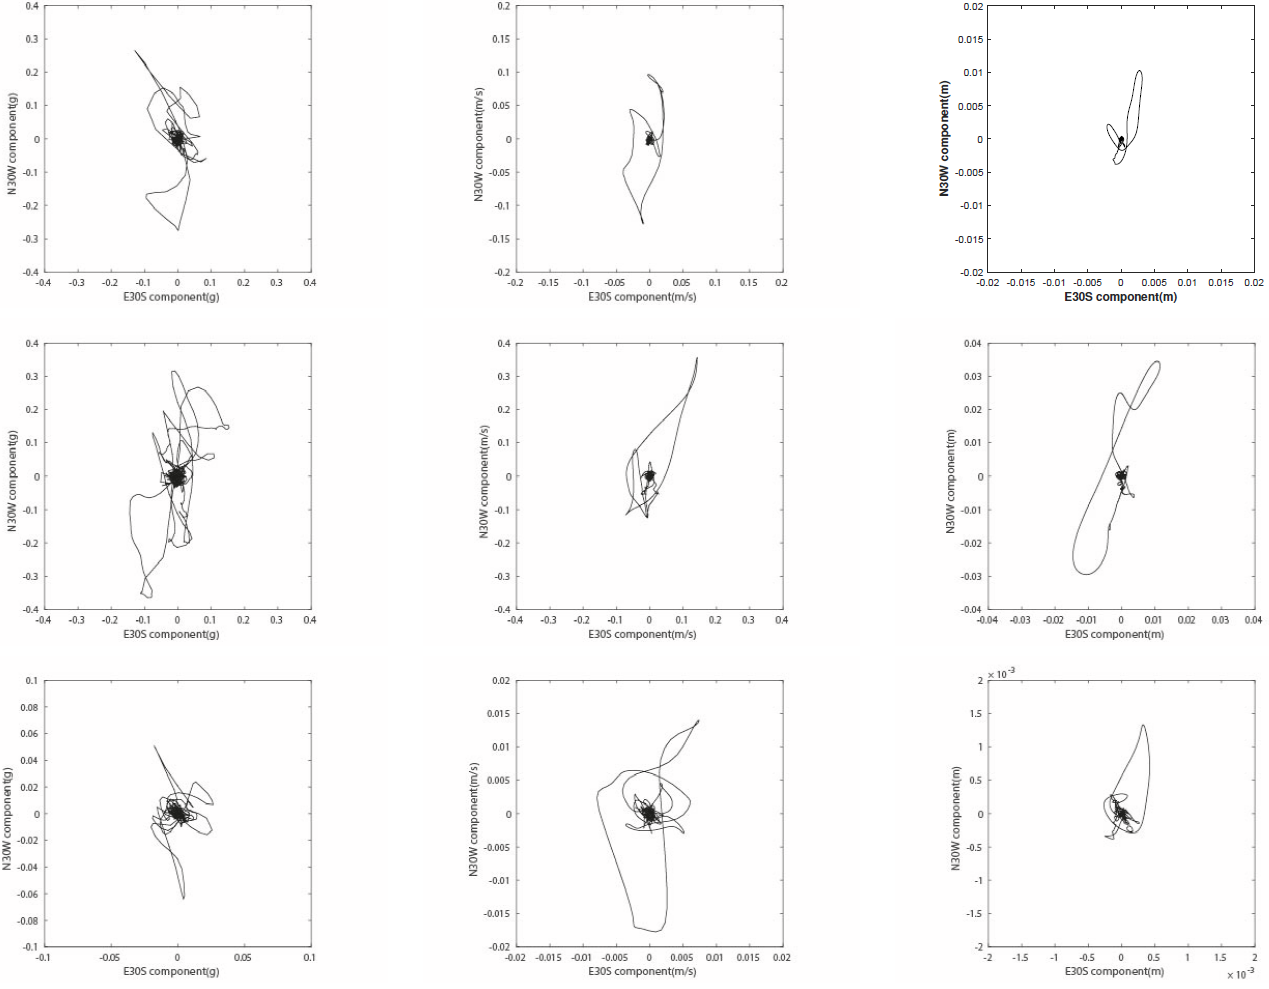
Fig. 11 Features of the particle motion (accelerations, velocities, and displacements) related to the seismic records obtained at the LOR station during the earthquakes No. 1 (upper row), No. 2 (middle row), and No. 3 (lower row)
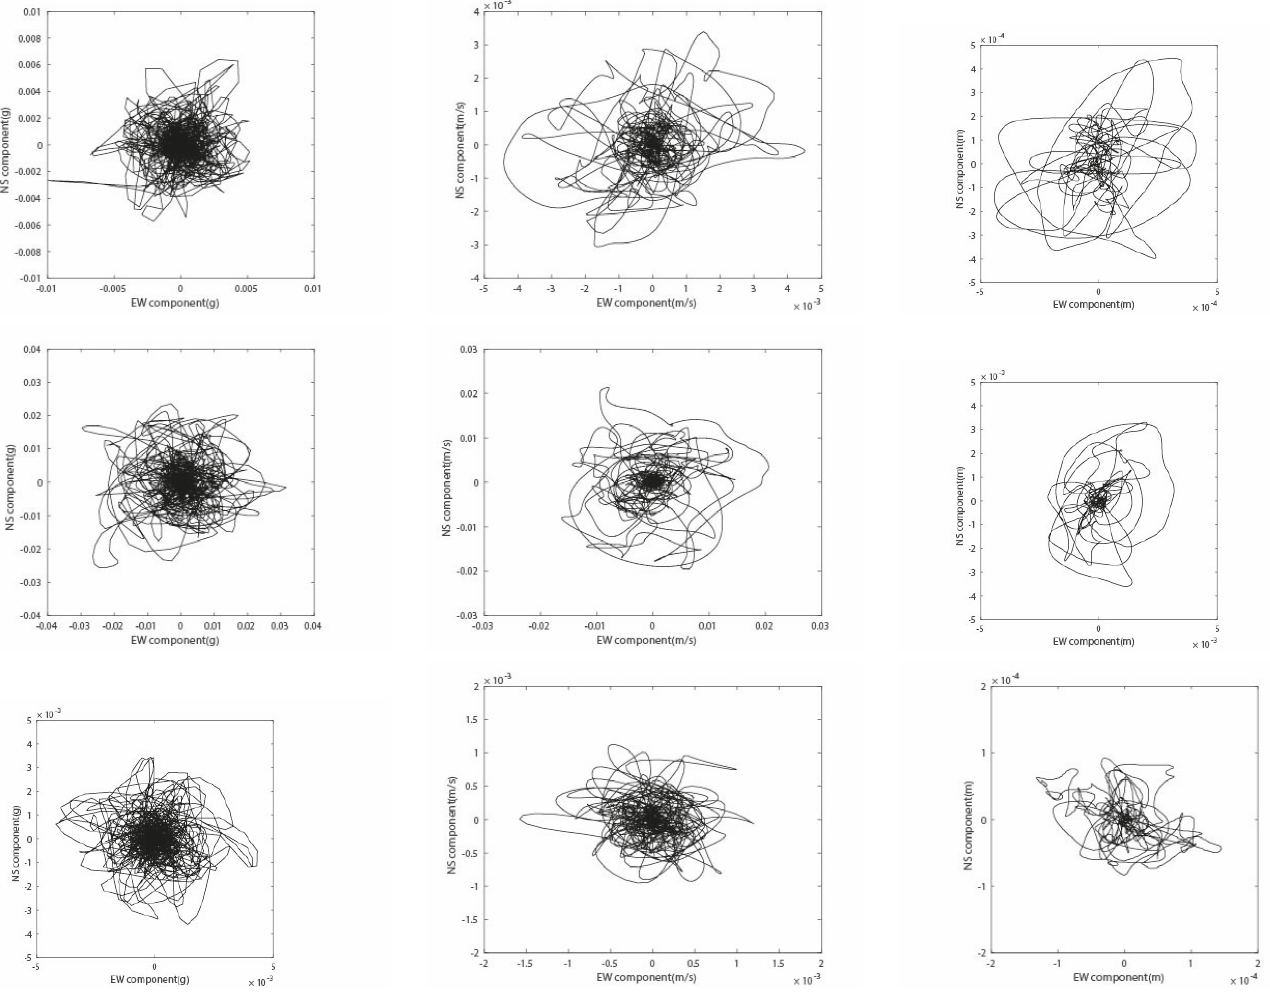
Fig. 12 Features of the particle motion (accelerations, velocities, and displacements) related to the seismic records obtained at the ZAR station during the earthquakes No.1 (upper row), No.2 (middle row), and No.3 (lower row)
On the other hand, as at the LOR station case, the analysis of the Fourier spectrum of the seismic records at the ZAR station Figures 7b, 7d, and 7f highlight the similitudes and the differences among the seismic records generated by the three different earthquakes (Table 1). For instance, according to the Fourier spectra at the ZAR station the maximum energy of the movement is approximately in the band of frequencies among 0.8 and 8 Hz, among 0.5 and 9 Hz, and among 0.8 and 20 Hz, due to the earthquakes No.1, 2, and 3, respectively. Similarly, according to the same Fourier spectra, the maximum amplitudes are approximately in the range of 1 to 2 Hz, of 0.7 to 7 Hz, and of 1.5 to 10 Hz, due to the earthquakes No.1, 2, and 3, respectively. Additionally, it is possible to highlight that the maximum amplitude of the Fourier spectrum due to the earthquake No.2 is significantly higher than the respective amplitude of the Fourier spectra due to the earthquakes No.1 and No.3.
On the other hand, it is possible to notice that at the MUL station located to 40.2, 40.6 and 38.9 km from the epicenter of earthquakes No. 1, No. 2, and No. 3, respectively, the largest values of PGA were recorded at the EW component, just as occurred in the respective seismic records that were obtained at the ZAR station (Table 5, Table 6, Table 7). According to these data, it is possible to highlight that from a distance near to 40 km of the epicenter, the largest values of PGA recorded at the MUL station are equal to 0.008 g, 0.04 g, and 0.006 g, for the earthquakes No.1, 2, and 3, respectively.
Otherwise, if we consider the initial time (Tini ) in all the records of the three earthquakes considered in the present study, then we can identify the following feature: in most of the cases the Tini of the vertical component is lower than the Tini of the other two components (Table 5 to Table 7); the exception occurs only in the case 1-5 (Table 3) that correspond to the seismic record of the earthquake No.1 at the station MUL-H. If we consider the general behavior of the Tini of the vertical component and that the potentially damaging ground motion occurs into the DSR , then we can summarize that for the earthquakes of the present study (Table 1), the vertical component is the component where the significant duration starts before the significant duration of the other components.
On the other hand, according to Figures 13a, 13b, and 13c, at the LOR station located about 5 km from the epicenter, the DSR of the N30W component is significantly lower than the DSR of the other two components. In the same figures, we can observe that the values of the DSR for the three components due to the earthquakes No.1 and 2 are similar at the respective values for the ZAR, AM2, and VLR stations. However, at the MUL station, the DSR of the NS component differs in an important manner of the other two components during earthquakes No.1 and No.3.
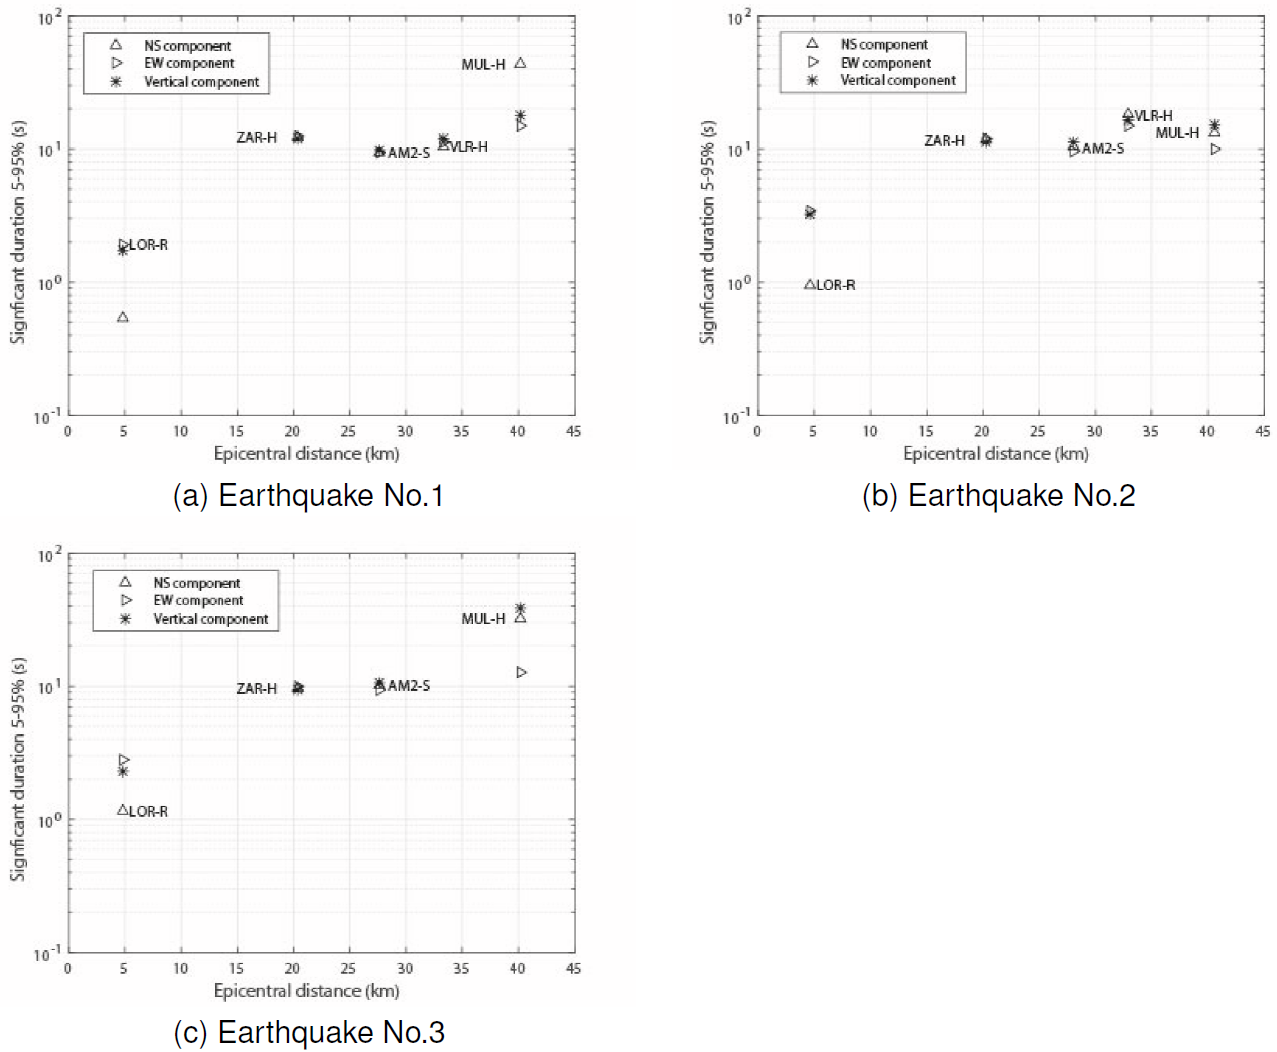
Fig. 13 Values of DSR 5-95% for the three components in every station (Table 3) versus the distance to the epicenter of the earthquakes No.1, 2 and 3. Note: at the LOR station the values of PGA of the horizontal components correspond to the components N30W and E30N
2.5 Seismic Actions in Buildings
The focus in the previous sections was the features of the ground motions that were generated by the three main earthquakes that occurred in Lorca on May 11, 2011. However, in this section, we described the main results of the analysis that we did about some aspects of the effects of those ground motions in buildings. As a part of this analysis, we assessed the potential of seismic damage related to the earthquakes. For this purpose, we used the values of CAV determined previously, to have a reference about the destructive potential of the earthquakes. In this work, we used the threshold value of CAVSTD equal to 0.16 g.s (156.96 cm/s) [19,36], which is considered by EPRI [19] as a conservative value. According to EPRI [19], it is possible to expect some seismic damage during ground motions that exceed the CAVSTD of 156.96 cm/s. Then, considering this last value, we identified that from the total seismic records analyzed in the present study only the horizontal component N30W of the seismic record obtained at the LOR station during the mainshock exceeded the mentioned threshold. Particularly, the standardized CAV value was equal to 211 cm/s for the N30W component. However, it is important to have in mind that the LOR station is in a rock site, therefore, it is necessary to consider the local effects that could have increased the ground motions in other sites of the city of Lorca. For instance, according to Alguacil et al [5], in a region of the city of Lorca with alluvium soils, the earthquake No.2 could have triggered values of Sa about 1.5 g for structures with a period among 0.3 s and 0.6 s. This last condition means an increment of about 1.5 times with respect to the values of Sa determined in a rock site of Lorca for the same range of periods. Therefore, it is possible to infer that in soil sites of Lorca, the value of CAV could have been higher than the values of CAV for the rock site. These last results agree with the extensive damage in buildings due to the mainshock of Lorca. Therefore, according to the damage in numerous buildings of Lorca, it is possible to infer that in that city there were numerous buildings with high values of seismic vulnerability. In this aspect, there are studies that confirm the high values of seismic vulnerability of numerous buildings of the Lorca city [26,34].
The city of Lorca is a small city of Spain, however, the magnitude of the damage that the Lorca earthquakes generated in the city confirm the importance of increasing the seismic resilience of the cities of Spain. In this aspect, it is necessary to underline that the assessment of the seismic risk is a fundamental step to increase the seismic resilience of the cities [2,3].
On the other hand, in the present study, we analyzed the seismic effects due to the Lorca earthquakes in particular buildings. For this purpose, we considered that according to Romao et al [33] it is valid to apply the Eq.3 to assess the structural period of reinforced concrete buildings in Lorca, because this equation was proposed by Enomoto et al [17] to evaluate the structural period of buildings in Almeria (a city near to Lorca). At the same time, Romaõ et al [33] mentioned that according to a technical visit to Lorca, most buildings have among 3 to 6 floors, and in few cases, the buildings exceed 10 floors:
As was cited previously, the death of persons during the Lorca earthquake of magnitude 5.1 was due to the collapse of the parapets of buildings. These parapets were essentially affected by the acceleration that occurred in the roof of the buildings. Therefore, to highlight the seismic actions that contributed to the collapse of an important number of parapets of buildings, we assessed the structural period of buildings with a different number of floors (Table 9).
Table 9 Examples of structural periods for reinforced concrete buildings in Lorca
| Building ID |
Number of floors |
Structural period (s) |
|---|---|---|
| B3F | 3 | 0.15 |
| B4F | 4 | 0.20 |
| B6F | 6 | 0.30 |
| B8F | 8 | 0.40 |
As was mentioned previously, the unique building that collapsed during the earthquake of magnitude 5.1, was significantly damaged by the foreshock [23]. Fortunately, for this reason, the building was without persons during the earthquake of magnitude 5.1 [6,23]. This specific case is a reference to infer that parapets in buildings suffered also some grade of damage during the earthquake of magnitude 4.5, but the earthquake of magnitude 5.1 was the event that generated the collapse of the parapets that caused the death of persons.
To identify the seismic action that acted on the parapets it is possible to do different types of analysis. For instance, a hypothetical building B3F (Table 9) with the orientation shown in (Figure 9) would have been affected by the history of accelerations shown in Figure 14a during the earthquake No. 1. In this case, the accelerations of Figure 14a would have acted on the parapets in the axis A-B, B-C, C-D, and D-A (Figure 9) and these accelerations would have reached a maximum value of about 0.65 g in the N30W direction 14a, and about 0.18 g in the E30N direction (Figure 14b). Particularly, in this case, the four parapets (A-B, B-C, C-D, and D-A) would have been subjected to the same inertial forces.
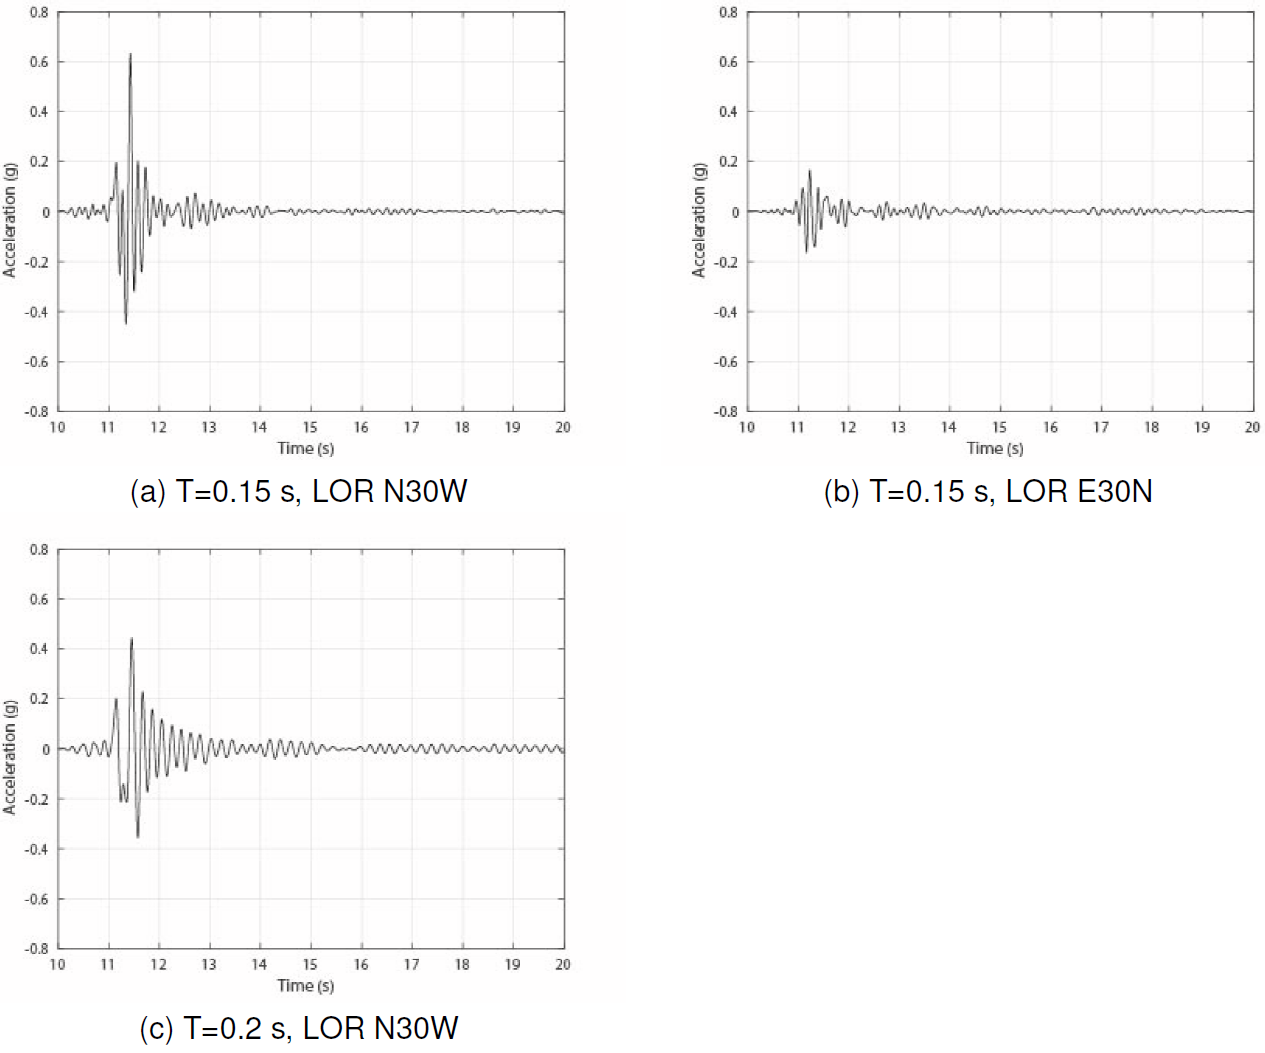
Fig. 14 Response of a single degree freedom with a structural period equal to 0.15 s, for the earthquake 4.5 in LOR N30W (a) and E30N (b), and for a structural period equal to 0.20 s (c) for the earthquake 4.5 according to the component N30W of the LOR station
However, if we considered only the accelerations in the N30W component, then in the parapets D-A and B-C the inertial forces due to these last accelerations would have acted in the plane of the parapet (Figure 9), meanwhile in the parapets A-B and C-D the inertial forces would have acted perpendicularly to the plane of the parapet. According to these conditions, the most vulnerable parapets of the building correspond to the parapets in the axis A-B and D-C, because the shear resistance in parapets (and walls) perpendicular to its plane is significantly lower than the shear resistance in its plane.
On the other hand, it is possible to observe in Figure 14, that the earthquake No. 1 was able to generate high values of acceleration on the roof of the buildings with 3 to 6 floors (Table 9). For instance, in buildings with 3, 4, and 6 floors, the maximum value of acceleration was of 0.65 g, 0.42 g, and 0.58 g, respectively. At the same time, it is possible to highlight that there are important differences among the values of Sa in the N30W direction with respect to the values of acceleration in the E30N direction. For instance, in the building with 3 floors, there is a difference about three times and a half among both the acceleration in the N30W direction (Figure 14a) and the acceleration in the E30N direction (Figure 14b).
On the other hand, Figure 15 shows the Sa values for the structural periods equal to 0.15 s, 0.20 s, 0.30 s, and 0.40 s, which were determined according to the seismic record of the component N30W at the LOR station during the earthquake No.2. In this last figure, we observed, for instance, that during the earthquake No.2 values of accelerations until of 0.88g were reached in the rooftop of the building B6F (Table 9) in the N30W direction (Figure 15c).
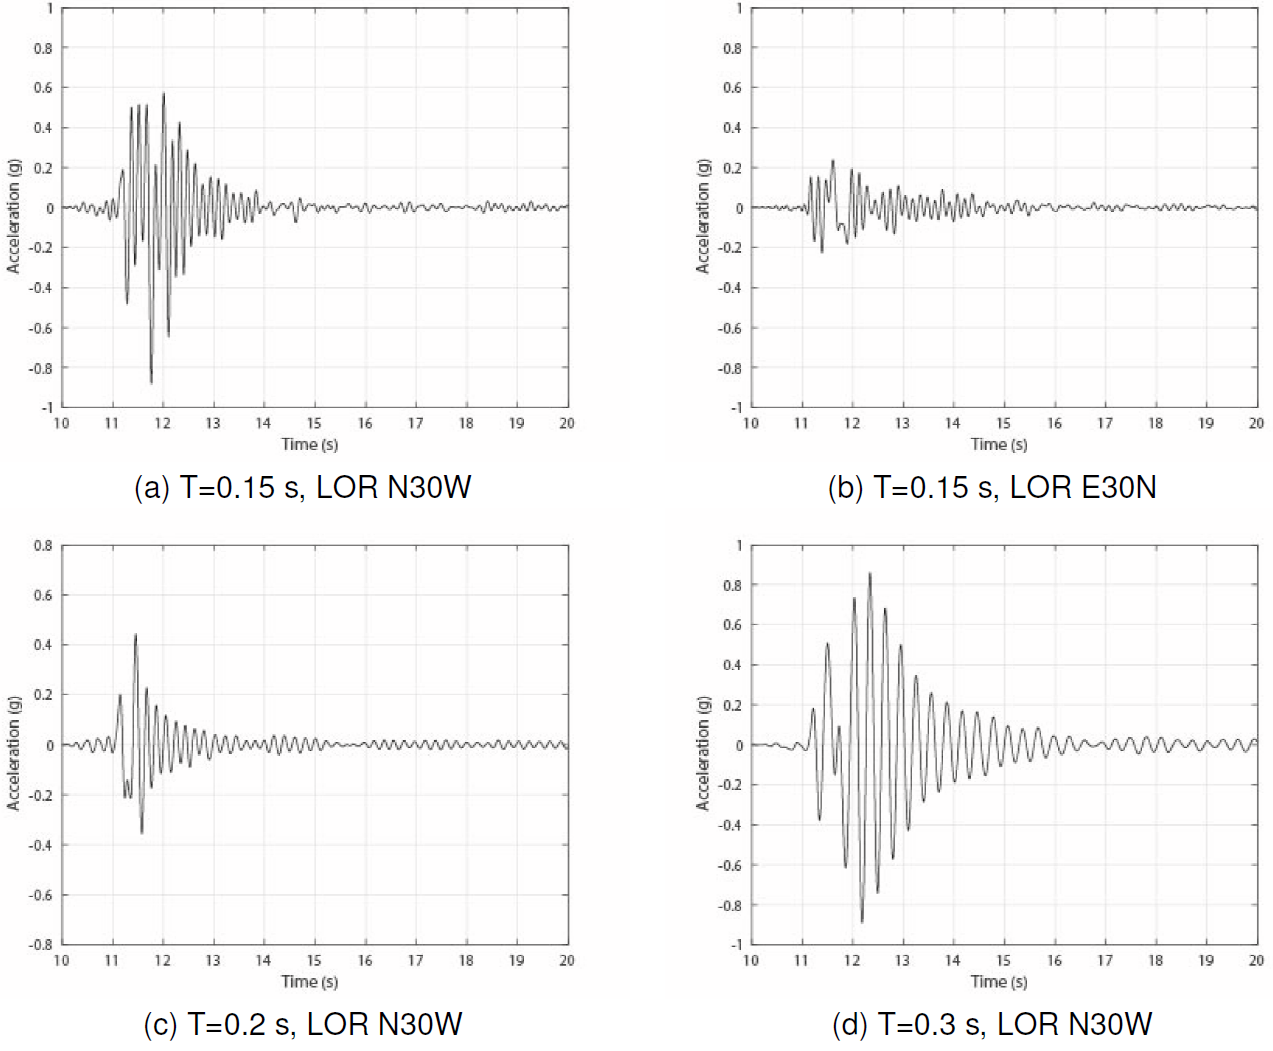
Fig. 15 Response of a single degree freedom with a structural period equal to 0.15 s, for the earthquake 5.1 in LOR N30W (a) and E30N (b), and for a structural period equal to 0.20 s (c) and 0.30 s (d) for the earthquake 5.1 according to the component N30W of the LOR station
Similarly, it is possible to observe that a B3F building type could have been affected in its roof by a maximum Sa equal to 0.65 g during the foreshock, and of 0.88 g during the main shock. At the same time, a building B6F type could have been affected in its roof for a maximum value of Sa equal to 0.58 g during the foreshock and of 0.9 g during the mainshock.
It is important to notice that the values of Sa determined for the four different structural periods were computed considering a seismic record obtained in a rock site. Therefore, it is necessary to consider that in other types of soils of the Lorca city, the values of Sa could have exceeded the values of Sa for the rock site [5].
2.5.1 Comparison of Response Spectra
Another valuable tool to represent the effects that a ground motion can trigger in buildings is the response spectra [7]. For this purpose, in the present study, we computed response spectra of acceleration (Sa), velocity (Sv), and displacement (Sd). These response spectra were computed considering a time increment of the signal equal to 0.01 s.
Particularly, we computed response spectra using the seismic records of the three earthquakes (Table 1) recorded at the LOR, ZAR, and MUL stations. Figure 16a shows the response spectra of Sa due to the seismic records of the LOR station recorded during the mainshock. According to these spectra, the highest values of Sa occurred mainly in structures with structural periods among 0.05 s and 0.8 s. In some cases, the values of Sa exceed slightly the value of 1 g. At the same time, it is possible to observe that in the four spectra due to the seismic records of the earthquakes No.1 and No.2 at the LOR station, there are values of Sa that exceed the values of Sa of the design spectrum for rock determined according to the NCSE-02 [30]. Moreover, in Figure 16a it is possible to identify that for a value of T lower than 0.4 s, the Sa spectrum due to the component N30W of the LOR station recorded during the earthquake of magnitude 4.5 was greater than the Sa spectrum due to the component E30N of the LOR station recorded during the earthquake of magnitude 5.1. This last condition gives us an idea of the severity of the earthquake of magnitude 4.5. According to the spectrum of the N30W component of the main earthquake (Figure 16a), values of Sa lower than 0.05 g occurred only for structures with periods greater than 2.4 s. Therefore, an important range of structures in Lorca was affected by significant values of Sa.
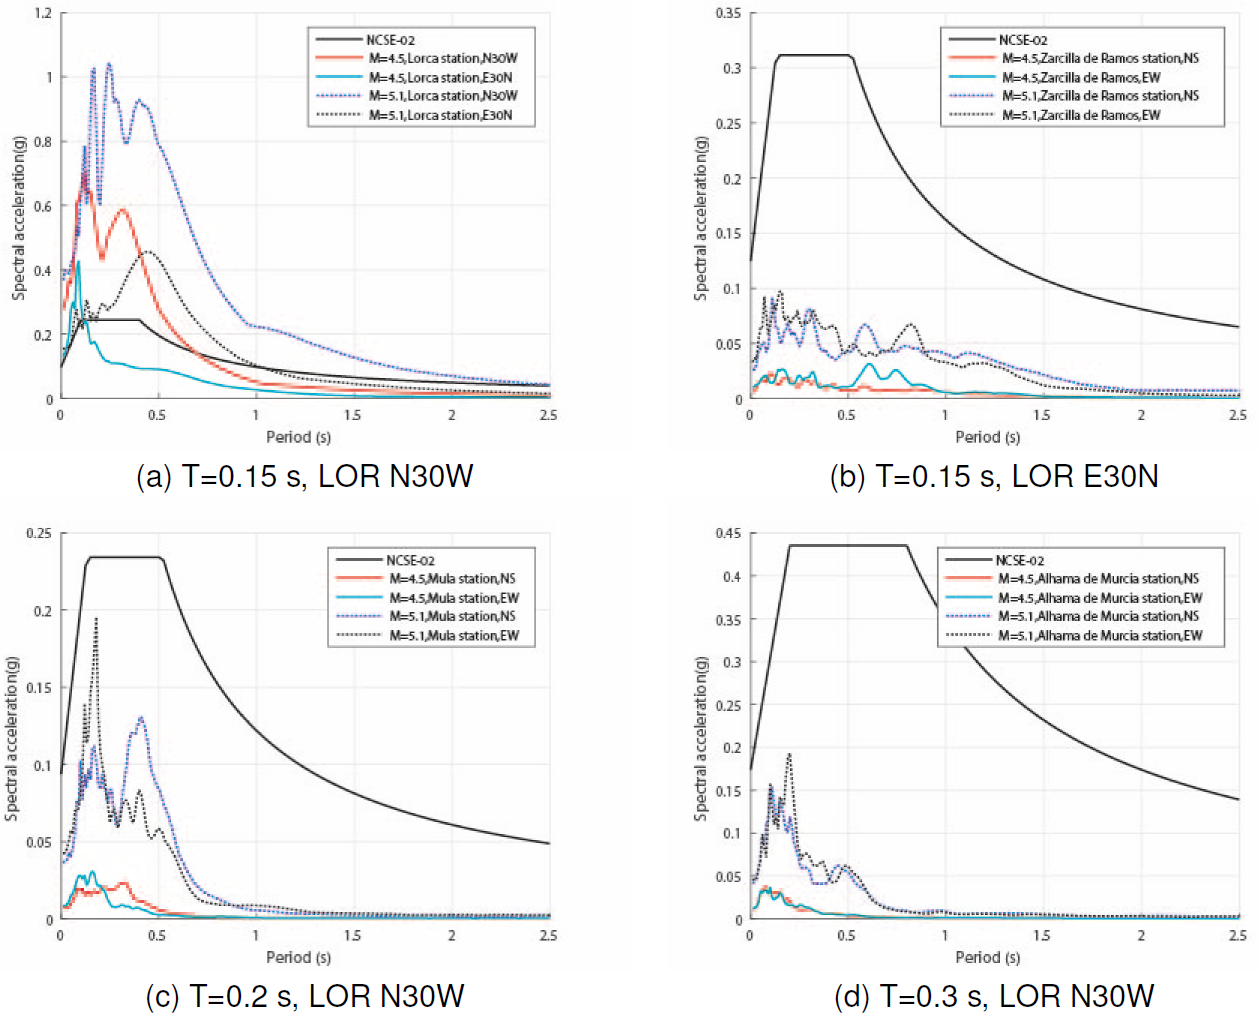
Fig. 16 Spectra response (5%) according to the seismic records obtained at the LOR station (a), ZAR station (b), MUL station (c), and AM2 station (d) during the three main earthquakes of Lorca on May 11, 2011. Note: at the LOR station the values of PGA of the horizontal components correspond to the components N30W and E30N
As was mentioned previously, the seismic records of the LOR station correspond to a rock site, therefore, it is necessary to consider possible local effects in different types of grounds of the Lorca city (for instance, alluvium deposits). For this purpose, Alguacil et al. [5] performed a research where they determined that during the mainshock (earthquake No. 2) the value of Sa on some points of alluvium deposits or on alluvium fans of the Lorca city could have reached values greater than 1.5 g (in periods among 0.3 and 0.6 s). This last value of Sa is approximately 1.5 times higher than the maximum values of Sa determined at the rock site of Lorca (Figure 20a). Therefore, these high values of Sa contribute to explain the significant damage in the town of Lorca [5].
In Figure 16b it is possible to observe that in the case of Zarcilla de Ramos (located in the municipality of Lorca), the foreshock and the mainshock have related a Sa response spectrum significantly lower than the design response spectrum in rock determined according to the NCSE-02 [30]. For instance, according to Figure 16b, the value of Sa for a period of 0.1 s due to the earthquake No. 2 is a value near to 0.09 g which is approximately a value 2.4 times lower than the value determined according to the design spectrum of the NCSE-02 [30].
According to Figure 16b, the maximum Sa due to the earthquake No. 2 in Zarcilla de Ramos is about 0.095 g and according to Figure 16c, the maximum Sa due to the same earthquake in Mula is about 0.195 g. However, it is important to highlight that there is approximately 40.03 km among the ZAR and MUL stations. Therefore, as was mentioned previously local conditions are part of the elements that explain the significant difference among the values of Sa related to the seismic records of the ZAR and MUL stations. At the same time, it is possible to observe that the value of 0.095 g in Figure 20c is approximately a value 20% lower than the corresponding value of Sa determined by the design spectrum of the NCSE-02 [30] for this site. This means, that at the Mula station the design spectrum was near to be exceeded by some points of the spectrum related to the earthquake No. 2. Therefore, this last condition confirms that the earthquake of magnitude 5.1 produced a significant ground motion in the Lorca city located to 4.6 km from the epicenter, but also at the Mula station located to 40.6 km from the epicenter.
Finally, according to Figure 16d, it is possible to observe that the response spectrum of the EW component due to the earthquake No. 2 recorded at the Alhama de Murcia station has a pronounced peak that almost reaches a value of 0.19 g for a structural period near to 0.18 s. The main peak in the response spectrum of the NS component for the same earthquake reaches a value of 0.15 g and it corresponds to a structural period near to 0.15 s. Therefore, in this site buildings with periods among 0.1 s and 0.2 s were affected by significant values of Sa due to the earthquakes No. 1 and No. 2. However, these values of Sa were about 2 times lower than the corresponding values of the design spectrum of the Alhama de Murcia according to the NCSE-02 [30].
2.5.2 Seismic Forces to Design Parapets of Buildings (Non-Structural Elements)
There are diverse practical recommendations with the purpose of reducing the seismic damage in non-structural elements of buildings [20]. Additionally, there are seismic codes that describe procedures to design non-structural elements. In the present study, we considered two procedures to determine the seismic forces to design the parapets of buildings. The first procedure is proposed in section 4.3.5 of the Eurocode 8.1 [13] with the purpose of assessing a horizontal seismic force to design non-structural elements as parapets. According to this procedure, it is necessary to apply Eq. 4:
where Fa is the horizontal seismic force, acting at the center of mass of the non-structural element in the most unfavorable direction; Sa is the seismic coefficient, Wa the weight of the non-structural element γa the importance factor, and qa the behavior factor. According to the Eurocode 8.1 [13] for the parapets case, both γa and qa are equal to 1. Therefore, based on the terrible consequences of the collapse of parapets during the Lorca earthquakes, we consider convenient to start a discussion about the possibility that the value of γa for the parapets case could be increased for the Spain Annex for the Eurocode 8.1. This last suggestion was made considering that the importance factor γ0, is a clear factor for the designers, therefore, if we increase the value of γa it is possible that we be able to capture the attention of the designers about the importance of the appropriate design of the parapets. And then, the designers will have support to highlight to the builders the importance of the appropriate construction of the parapets. In summary, we consider that an increment of the value of the importance factor can contribute to improving the perception of the importance of the appropriate design and construction of parapets. On the other hand, the value of Sa of Eq.4 must be computed according to Eq. 5 that is addressed also in the Eurocode 8.1 [13]:
where α is the ratio of the design ground acceleration on type A ground, ag , to the acceleration of gravity g; S is the soil factor; Ta is the fundamental vibration period of the non-structural element; T1 is the fundamental vibration period of the building in the relevant direction; z is the height of the non-structural element above the level of application of the seismic action and; H is the building height measured from the foundation or from the top of a rigid basement. The value of the seismic coefficient Sa may not be taken less than α.S[13].
The correct application of the Eurocode 8.1 requires the existence of the National annex. However, because is not available the National annex for Spain, we only mention that it is important that Spain has this Annex in order to offer an alternative to compute seismic forces for the seismic design of non-structural elements.
The second procedure that we considered is based on the NCSE-02. According to this last seismic code, the horizontal seismic force must be computed as stated in Eq. 6:
where p is the weight of the element, ac is the seismic acceleration in m/s2, g is the acceleration of the gravity in m/s2, α1 is a coefficient of the mode 1, β is a response coefficient, η1k is a distribution factor corresponding to the floor k, in the mode 1. The value of ac is assessed according to Eq.7:
where S is an amplification factor of the soil; ρ is a non-dimensional coefficient of risk; ab is the basic seismic acceleration determined in the seismic hazard map of Spain included in the NCSE-02.
We applied Eq. 6 to compute the horizontal seismic force for a hypothetical parapet of a hypothetical building type B6F with a structural period equal to 0.3 s. The main material of the parapet is not-confined masonry. Additionally, the parapet has a height of 1 m and it has a longitude of 2.5 m. We considered the most unfavorable case about the kind of support of the parapet, then we considered it as a cantilever beam. According to these data, the value of Fa is equal to 47.31 kg.
On the other hand, since the Lorca earthquake, some proposals to modify the seismic hazard maps have been done. For instance, Mezcua and colleagues [29] proposed a new seismic hazard map for Spain. According to this last study, the value of ab for Lorca must change from the present value of 0.12 g to a value of 0.19 g [29]. If we considered this new proposal for the seismic hazard for Lorca, then the value of Fa computed for the seismic design of the hypothetical parapet of the present study is equal to 75.38 kg. This last seismic force is about 60 % greater than the seismic force computed with the seismic hazard map values of the NCSE-02. Therefore, the sub estimation of the seismic forces for the design of the non-structural elements could be some of the factors that can explain the collapse of some parapets of buildings in Lorca City. Another factor that could contribute to the collapse of some parapets of buildings is the inadequate bracing and confining of the parapets. About this subject, Romao et al [33] proposed that during the updating of the NCSE-02 could be convenient to extend the present recommendations of the NCSE-02 even for parapets with a height lower than 1 m, because Romao et al [33] observed inadequate bracing in this type of parapets in buildings under construction in Lorca.
Additionally, it is convenient to remember that the buildings in Lorca city were affected by a significant value of Sa due to the foreshock and after that, they were again affected by the mainshock. Therefore, it is possible to consider that the foreshock generated damage to some of the non-structural elements, and this condition could have reduced the seismic resistance available from these non-structural elements during the mainshock [34].
3 Conclusions
The analysis developed in the present study complement the numerous studies that have been done about the Lorca earthquakes. However, the present work highlights the particularities of each one of the three main earthquakes of Lorca (foreshock, mainshock, and aftershock) occurred on May 11, 2011. And also, highlight the similitude and differences between them according to their respective seismic records. Therefore, it is important to continue studying the earthquakes of Lorca to identify features that can be useful both to prevent disasters and to reduce losses in futures earthquakes in Spain.
On the other hand, in the seismic records of the LOR station due to the three earthquakes (Table 1), we identified a large full-cycle pulse at the beginning of the velocity record that contains the greatest part of the energy of each seismic record. However, this feature can be due to the near-source effect called forward rupture directivity but also can be due to earthquakes of low magnitude and short duration. Additionally, it was possible to identify the directivity effect in the graphs of the particle motion that we analyzed in the present study (Figure 11). These directivity effects were clearly identified only in the LOR station.
The features of the seismic records that we analyzed in the present study suggest that in the region where the MUL station is located there are geological conditions that contribute to producing significant local effects. These last local effects could increment in a significant proportion the amplitude of the seismic waves that arrive at the Mula region.
We know the general features of the soil where each seismic station considered in the present study is located. However, will be useful to have details about the soil or rock in these sites, because this knowledge allows doing a more complete comparison between the records obtained in these stations. Particularly, this knowledge could contribute to identify the origin of some of the differences between the seismic records obtained in each seismic station.
According to the results, the greater amplitudes during the mainshock occurred principally in the range between 1.5 Hz and 4 Hz (periods between 0.25 s and 0.67 s, respectively), where the LOR station is located (rock site). Therefore, buildings between 5 and 13 floors (located in the region of the LOR station) were affected by the significant amplitudes on the ground motion during the main Lorca earthquake. Similarly, the greatest amplitudes for the same earthquake but in the ZAR station (located in hard soil) occurred mainly in the range between 0.7 Hz and 7 Hz (periods between 0.14 s and 1.43 s, respectively).
The CAVSTD values computed for the horizontal components of the seismic records of the LOR station (rock site) related to the mainshock exceeded the value of 0.16 g.s, which is the conservative threshold defined by the EPRI (2006) to identify a seismic ground motion potentially damaging. Therefore, the values of CAVSTD determined in the present study are values of reference that are in agreement with the significant damage that occurred in the city of Lorca.
The spectrum design of the NCSE-02 for Lorca was exceeded by the response spectra due to the seismic records that were recorded in the LOR station (rock) during the foreshock and the mainshock. However, in the rest of the stations located in Zarcilla de Ramos (firm soil), Mula (firm soil), and Alhama de Murcia (soft soil), their respective design spectrum according to the NCSE-02 was not exceeded by the response spectra due to the Lorca mainshock. However, the response spectra due to the seismic records of the LOR station are enough to justify the necessity to revise the procedures or the values included in the seismic code of Spain to determine the seismic actions. A similar process will be necessary if the National annex of Spain for the Eurocode 8.1 is yet under elaboration.
Furthermore, according to the results of the present study, the seismic forces used to design the parapets according to the NCSE-02 of the buildings of Lorca could have been underestimated. Therefore, it is convenient to have in mind this last condition during the next update of the seismic code of Spain. Additionally, we agree with the suggestion of Romaõ et al [33] of extending the present recommendations of the section 4.7.3. of the NCSE-02 to parapets with a height lower or equal to 1 m; and also, we suggest adding new recommendations for the design of parapets in the new seismic code for Spain to highlight the importance of the appropriate design of the parapets in buildings.
Finally, more than seven years after the occurrence of the Lorca earthquakes we considered essential to continue with the efforts to check the structural and non-structural elements of the existing buildings in the Lorca region to avoid new collapses that could generate serious injuries to the people.

