


 nueva página del texto (beta)
 Inglés (pdf)
 Artículo en XML
 Referencias del artículo
 Enviar artículo por email
 Citado por SciELO
  Similares en
SciELO
Similares en
SciELO 
 Permalink
1 Introduction
The World Health Organization estimates that 17.5 million people died of cardiovascular disease. This represents 30% of all global deaths [1]. Nevertheless, as most of the diseases, the early diagnostic is fundamental to avoid fatal consequences. In this way, the electric activity of the heart can be registered and recorded, and it is known as electrocardiogram (ECG). The ECG signal contains complete information about the health state of the heart.
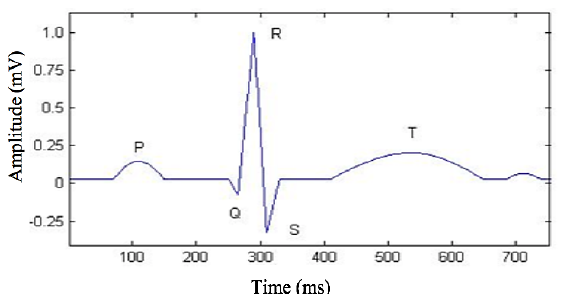
Then, when a doctor analyzes an ECG signal, he can detect if the hearth has some blood flux problem, a disease, suffer from some indisposed of the autonomic nervous system or if it suffers some stress. In a healthy person, the ECG signal appears almost periodic, and it is characterized by five peaks and valleys labeled by the letters P, Q, R, S, T, as it is shown in Fig 1. The first attempt to automate ECG analysis by digital computer was made as early as in 1956 by Pipberger and his group [2], they developed an automatic vector cardiographic analysis program.
The first industrial ECG processing system came into the market during the seventies. The detection of the QRS complex is the most crucial task in automatic ECG signal analysis. QRS complex can be identified using general ECG parameter detection method. R-peak is the less complicated point to distinguish from noisy component since it has large amplitude [3].
The T analysis wave during atrial flutter could require canceling the flutter wave [4]. In the past five decades, numerous computer programs have been developed for the automatic interpretation of ECG. However, methods and independent databases to test the reliability of such programs are still scarce.
Each ECG algorithm has different ways to perform the analysis; for example, some numerical codes are single bits based, whereas others take into account average bits. This fact has created a situation whereby substantial difference results in measurements made by different computer programs and this hampers the exchange of diagnostic criteria and interpretation results [1-3,5].
In the last consensus report [6], two ECG patterns are considered:
a) type-1 ECG pattern, where a coved ST-segment elevation ≥ 2mm is followed by a negative T-wave, with little or no isoelectric separation. This feature is present in some right precordial leads.
b) type-2 ECG pattern also characterized by an ST-segment elevation but followed by a positive or biphasic T-wave that results in a saddle-back configuration.
To perform this task, many programming languages are employed, such as Matlab[7], C language [8], Java[9], or even LabView[10].
In this work, we propose two different numerical methods to detect RR intervals based on the well-known difference method [11] taking into account the energy pulse. The code was done in Matlab (c) . Section two presents the general methodology of the work.
Our results, the comparison with other literature methods and the discussion are presented in the third section, while we close with the conclusion of the work.
2 Methodology
The general methodology includes several stage s. In the first instance, we use ECG records to take them from the MIT-BIH arrhythmia database [12], which has 48 ECG files with an approximate duration of 30 min each. The records were acquired at a sampling rate of 360 Hz, and each record comes from a different patient. Next, each ECG file was digitally filtered using a low-pass filter of 22nd order with a cut-off frequency of 15 Hz. Thus, electrical artifacts and inherent high-frequency noise were eliminated, see Fig. 2a.
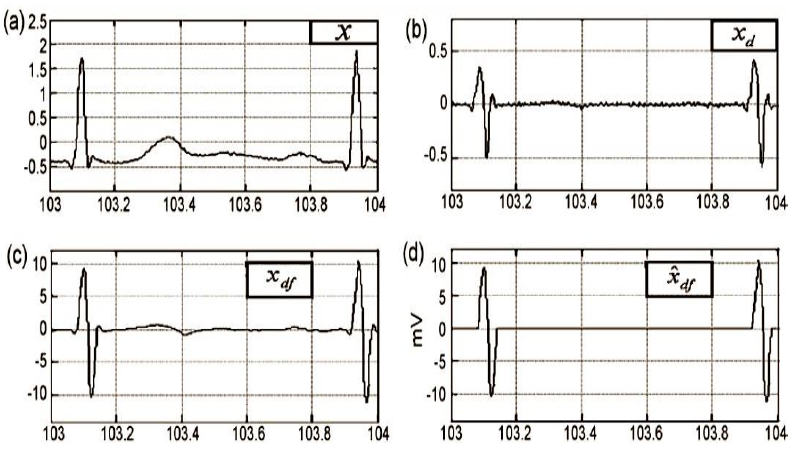
Fig. 2 a) x, the ECG signal in the database MIT-BIH tape 103; b)
Xd, the ECG signal after performing the difference
operation; c) Xdf, the signal after applying a low pass
filter; d)
The method of differences consists of applying the first numerical derivative of the ECG signal. From Fig. 2b it is possible to observe that. The high-frequency components signal in Fig. 2b was smooth using a 10th order low pass filter with a cut-off frequency of 10 Hz, Fig. 2c. Finally, we close this stage by setting two thresholds (positive and negative) to flat the signal, as can be seen in Fig. 2d. It is convenient to consider that the RR (peak to peak) interval has a duration between 0.4 to 1.2 s, this fact implies that all filtering operations must be performed in the bandwidth range from 0.833 to 2.5 Hz.
In the next block, we divide the positive and negative segments from the ECG signal, as is shown in Fig 3a. Once we have separated the positive and negative segments of the QRS signal, we use the window method to obtain the energy for each one. We also used two methods to obtain each local maxima of the ECG signal, that is, the R points, we call them; adjacent and overlapped windows. These methods consist of splitting the ECG signal in windows with a specific time width, as can be seen in Fig 3b. In our case, for the adjacent windows method, we used 300 ms as time width and for the overlapped windows method the period was 500 ms with an overlap of 250 ms. We have to mention that time duration windows values, in both cases, were established as a result of several tests that we present in the next section.
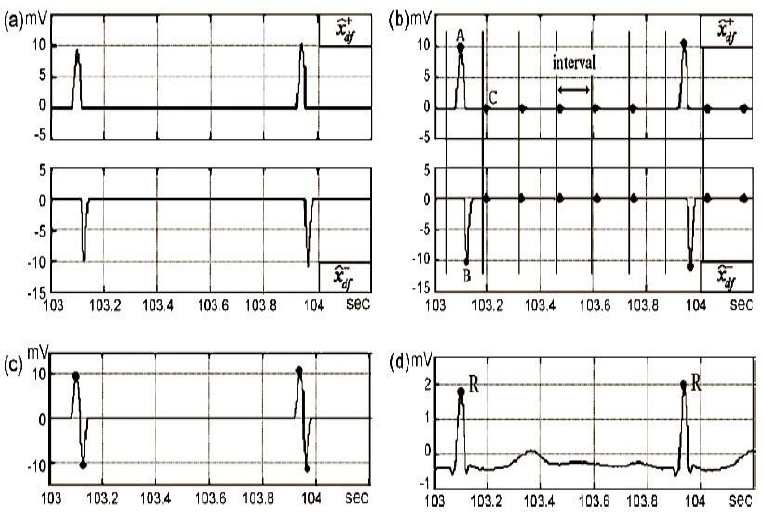
Fig. 3 a) and are the positive and negative parts of the signal
An algorithm was designed to detect the maximum value of the ECG signal inside of each window; i.e., 500 ms or 300 ms duration time, depending on the method. It is also capable of discarding all local maxima that did not correspond to points R.
The same tool was applied to the negative part of the ECG signal; the final result is observed in Fig 3c. We finish this stage remembering that the average distance in time from one-point R to another is between 0.4 to 1.2 s, then we can to discard those points located about ±250 ms around of every R point (tolerance margin), Fig 3d.
Once we identified the R points, it was essential to verify which of them corresponded to false positives (FP), false negatives (FN) and true positives (TP). Then we correlated the points identified against those validated at the MIT-BIH database. We considered, as tolerance margin for each point; ±250 ms. Finally, to have a quantitative comparison between the results obtained between our proposal and some methods that exist in the literature, we calculate a prediction error percentage, which is defined elsewhere by the Eq. 1:
3 Results and Discussion
At the end of the last section, we used some specific values to the window width and to the tolerance margin in time around each point R. Indeed, those values were determined in this section using simple numerical experiments; we used different values in our algorithms, and we select the combination, which generates the smallest error value. For the method of adjacent windows, we try four different window widths: 150, 200, 250 and 300 ms; while for tolerance margins we probed five: 100, 200, 250, 300 and 350 ms.
For these experiments, we spent 4.5 h of processing time to evaluate each combination for these parameters in the 48 ECG files in the database. The best results were obtained for a window length of 300 ms and a tolerance margin of 350 ms (prediction error: 0.97 %). On the other hand, we repeat the procedure for the overlapped window method. In this case, we spent 5 h of a processing time of 5 h, and we obtain the smallest error value for the combination of a window width of 500 ms and a tolerance margin of 350 ms (prediction error: 0.66 %).
Once we found the optimal pair of parameter values, we can compare our methods against some reported in the literature. Table 1 compares the results for the three most complex files in the database, where our two methods; adjacent and overlapped, were compared against three methods: The difference operation method (DOM) [11], the Pan & Tompkins method (PT) [13] and the wavelet transform method (WT) [14]. For complex, we mean that the beat recognition has a high level of difficulty.
Table 1 Comparison of prediction errors (%) between different detection methods
| Registry # | Adjacent | Overlapped | DOM | PT | WT |
|---|---|---|---|---|---|
| 105 | 0.54% | 0.27% | 0.66% | 3.46% | 1.09% |
| 108 | 1.08% | 1.87% | 0.34% | 12.54% | 1.59% |
| 203 | 1.54% | 0.40% | 0.60% | 2.78% | 0.87% |
| Processing time | 10s | 12s | 90s | - | 180s |
The three files have an average length of 30 minutes, and it can be seen from the Table 1 that our methods spent just about 10 % of the processing time for other methods (10 s and 12 s). From the results, it is also possible to appreciate that the DOM has the best prediction error while our methods are competitive only in file #105.
Now, to probe the efficiency of the proposed methods, we use them in the 48 files and compare the results of the 5 methods. Table 2 shows the prediction error results. It is observed that the average error percentages (0.97% and 0.66%) of the methodologies proposed here are not comparable with the best results of the DOM and WT methods [11], (0.2% and 0.17%), respectively.
Table 2 Comparison of prediction errors (%) between different detection methods
| File# | Heartbeats Totals | Adjacent Windows |
Overlapped Windows | Differences Method | PT Method | WT Method |
|---|---|---|---|---|---|---|
| 100 | 2273 | 0.00 | 0.00 | 0.04 | 0.00 | 0.00 |
| 101 | 1865 | 0.11 | 0.27 | 0.05 | 0.43 | 0.00 |
| 102 | 2187 | 0.00 | 0.00 | 0.05 | 0.00 | 0.11 |
| 103 | 2084 | 0.00 | 0.00 | 0.00 | 0.00 | 0.00 |
| 104 | 2229 | 0.22 | 0.18 | 0.09 | 0.04 | 0.45 |
| 105 | 2572 | 0.54 | 0.27 | 0.66 | 3.46 | 1.09 |
| 106 | 2027 | 1.13 | 0.89 | 0.30 | 0.35 | 0.25 |
| 107 | 2137 | 0.28 | 0.28 | 0.14 | 0.09 | 0.00 |
| 108 | 1763 | 1.08 | 1.87 | 0.34 | 12.54 | 1.59 |
| 109 | 2532 | 0.04 | 0.08 | 0.12 | 0.04 | 0.00 |
| 111 | 2124 | 0.00 | 0.00 | 0.05 | 0.05 | 0.09 |
| 112 | 2539 | 0.08 | 0.04 | 0.04 | 0.04 | 0.12 |
| 113 | 1795 | 0.95 | 0.33 | 0.50 | 0.00 | 0.11 |
| 114 | 1879 | 0.85 | 2.18 | 0.05 | 1.06 | 0.16 |
| 115 | 1953 | 0.15 | 0.10 | 0.00 | 0.00 | 0.00 |
| 116 | 2412 | 0.58 | 0.46 | 0.70 | 1.04 | 0.04 |
| 117 | 1535 | 1.30 | 1.82 | 0.13 | 0.13 | 0.07 |
| 118 | 2278 | 0.18 | 0.31 | 0.44 | 0.04 | 0.04 |
| 119 | 1987 | 0.70 | 0.00 | 0.00 | 0.05 | 0.05 |
| 121 | 1863 | 0.16 | 0.16 | 0.11 | 0.59 | 0.16 |
| 122 | 2476 | 0.04 | 0.04 | 0.00 | 0.08 | 0.00 |
| 123 | 1518 | 2.04 | 4.15 | 0.00 | 0.00 | 0.00 |
| 124 | 1619 | 1.30 | 0.56 | 0.06 | 0.00 | 0.00 |
| 200 | 2601 | 0.88 | 0.62 | 0.19 | 0.35 | 0.04 |
| 201 | 1963 | 3.72 | 0.87 | 1.02 | 0.51 | 0.66 |
| 202 | 2136 | 4.07 | 1.03 | 0.05 | 0.19 | 0.05 |
| 203 | 2980 | 1.54 | 0.40 | 0.60 | 2.78 | 0.87 |
| 205 | 2656 | 0.64 | 0.53 | 0.60 | 0.08 | 0.04 |
| 207 | 2332 | 2.70 | 1.63 | 0.05 | 0.43 | 0.27 |
| 208 | 2955 | 0.78 | 0.47 | 0.47 | 0.60 | 0.14 |
| 209 | 3005 | 0.13 | 0.60 | 0.03 | 0.10 | 0.00 |
| 210 | 2650 | 1.06 | 0.72 | 0.53 | 0.38 | 0.23 |
| 212 | 2748 | 0.07 | 0.04 | 0.04 | 0.00 | 0.00 |
| 213 | 3251 | 0.09 | 0.03 | 0.09 | 0.09 | 0.00 |
| 214 | 2262 | 2.17 | 1.46 | 0.18 | 0.26 | - |
| 215 | 3363 | 0.18 | 0.18 | 0.12 | 0.03 | - |
| 217 | 2208 | 0.05 | 0.09 | 0.09 | 0.45 | 0.09 |
| 219 | 2154 | 3.02 | 1.72 | 0.00 | 0.00 | 0.00 |
| 220 | 2048 | 0.34 | 0.34 | 0.00 | 0.00 | 0.00 |
| 221 | 2427 | 1.81 | 2.39 | 0.04 | 0.08 | 0.29 |
| 222 | 2483 | 3.30 | 2.58 | 0.20 | 7.33 | 0.40 |
| 223 | 2605 | 0.23 | 0.12 | 0.04 | 0.04 | 0.08 |
| 228 | 2053 | 0.88 | 0.97 | 0.10 | 1.46 | 0.49 |
| 230 | 2256 | 0.04 | 0.04 | 0.09 | 0.04 | 0.00 |
| 231 | 1571 | 3.44 | 0.32 | 0.80 | 0.00 | 0.00 |
| 232 | 1780 | 3.54 | 0.22 | 0.00 | 0.39 | 0.00 |
| 233 | 3079 | 0.19 | 0.13 | 0.29 | 0.03 | 0.00 |
| 234 | 2753 | 0.04 | 0.00 | 0.04 | 0.00 | 0.00 |
| Total | 109,966 | 0.97 | 0.66 | 0.20 | 0.74 | 0.17 |
In particular, each of the 48 registers has inherent characteristics regarding the morphology of the ECG signal. The age of the patient is another factor that can affect the length of the RR segment. Then, if the goal is to establish an optimal window width, we need to introduce more inputs variables that enable us to classify the files and relate them with the patient, for example; age, sex, weight, etc.
3 Conclusion
In this paper, we propose the use of two methods to automatically detect the R points in an electrocardiogram (ECG). Our methods use a signal segmentation (windows) where we calculate the energy of the signal after some signal processing.
Due to the way we use the segmentation, we call the two methods as adjacent and overlapped windows.
To evaluate the detection methods proposed, we used the MIT-BIH arrhythmia database [12] and compare our methods against three popular methods in the literature: The difference operation method (DOM) [11], the Pan & Tompkins method (PT) [13] and the wavelet transform method (WT) [14].
We have compared the five methods against 3 specific database files and also against the 48 files. Our results show that our methods are faster than the other three because they only use about 10% of the processing time. Nevertheless, our methods present a higher failure rate when we use them in several files and obtain the average, even when in some files, our methods present the smallest error.

