


 nueva página del texto (beta)
 Inglés (pdf)
 Artículo en XML
 Referencias del artículo
 Enviar artículo por email
 Citado por SciELO
  Similares en
SciELO
Similares en
SciELO 
 Permalink
1 Introduction
New materials in the nanometric range are synthetized every day in order to achieve adequate properties for particular applications. These materials may include oxides as host matrices and trivalent rare-earths (RE) as dopants. Semiconductor titanium dioxide (TiO2) is an ideal host for RE emitters due to its good optical and thermal properties and this combination has been used intensively in the last years [1-10]. Among RE erbium (Er) is probably the most used due to its emission properties in applications such as fiber amplifiers, communications, display devices and sensors [11-16]. Emission bands for the Er3+ are well-known both in the visible and in the infrared (IR) ranges. In particular, a useful and well-studied emission band is that located around 1550 nm which has maximum transmittance and minimum losses.
In this paper, we report the synthesis and characterization of a promising Er3+-doped TiO2 composite that showed adequate photoluminescence (PL) emission properties both in the visible and IR ranges. To define the optimal dopant concentration for the PL emission we varied the Er3+ amount (0.5, 1.0 and 3.0 wt%) aiming to determine the most emissive sample in the visible region.
By comparing the obtained emission spectra, we determined that the sample with 1.0 wt%, denoted as TiO2Er1, had the highest intensity profile. Therefore, in the successive we characterized only this sample.
We measured the PL emission spectrum in the IR range and strong emission around 1550 nm was found. We also verified the morphology and structural properties of our composite with Raman spectroscopy, X-Ray Diffraction and Scanning Electronic Microscopy. All the composites were synthetized with the sol-gel and Stõber methods.
2 Experimental
2.1 Reagents
All chemicals are of analytical grade and are used as received without any further purification. Titanium(IV) isopropoxide Ti[OCH(CH3)2]4 purity 97%, penta-hydrated erbium nitrate Er(NO3)3 5H2O and potassium chloride KCl (4x10⁻⁴ m) purity 99.9 % were purchased from Aldrich. Ethanol purity 99.9% was purchased from Sigma.
2.2 Synthesis of TiO2 Er3+ Composites
We synthetized our composites with the sol-gel and the Stöber methods. All conditions were the same for the three samples with the exception of the amount of erbium nitrate used. Herein we provide the description for the sample TiO2Er1. 56 mg of penta-hydrated erbium nitrate, 26.66 ml of ethanol and 0.106 ml of potassium chloride 0.4 mM were poured into a volumetric flask under a low humidity atmosphere.
The solution was stirred vigorously and the temperature was increased to 50 °C. At this temperature, we started to drop 1.92 ml of titanium isopropoxide at a rate of one drop every two minutes. When finished the system was vigorously stirred for 18 hours at 50° C.
Then the remaining ethanol was removed and a gel was formed. This was heated for two hours at 80° C and it was solidified. The solid obtained was pulverized and calcined under a nitrogen atmosphere for three hours at 700°C.
As mentioned, this sample was labeled as TiO2Er1, while the other samples were labeled as TiO2Er05 and TiO2Er3 for 0.5 and 3.0 wt%, respectively.
2.3 Characterization
The PL measurements in the visible range were performed on a Varian Cary Eclipse fluorescence spectrophotometer equipped with a xenon lamp. The corresponding measurements in the IR range were carried out on an Edinburgh Instruments fluorescence spectrophotometer using an InGaAs photo-detector.
Raman spectroscopy was performed on a Raman Thermo Scientific instrument equipped with a laser beam of 633 nm. XRD patterns were obtained on a Bruker D8 Advance diffractometer working at 40 Kv and 35 MA. SEM images were obtained with a JSM 6610LV Scanning Electron Microscope 30 KV magnification x 5 to x 300,000 (on 128 mm x 96 image-size).
3. Results and Discussion
3.1 Optical Properties
In Fig. 1 we show the PL excitation spectrum for the sample TiO2Er1 in the range 290-450 nm by using an emission wavelength at 550 nm. The curve has a maximum around 350 nm, which is associated with transition 4I5/2→4G7/2[17] with an energy around 28 500 cm-1. This value was used as the excitation wavelength for the emission spectra.

In Fig. 2 we show the emission spectra obtained for the three samples in the range 450-600 nm by using the excitation wavelength at 350 nm. We found strong emissions with peaks centered at 495, 520 and 553 nm.
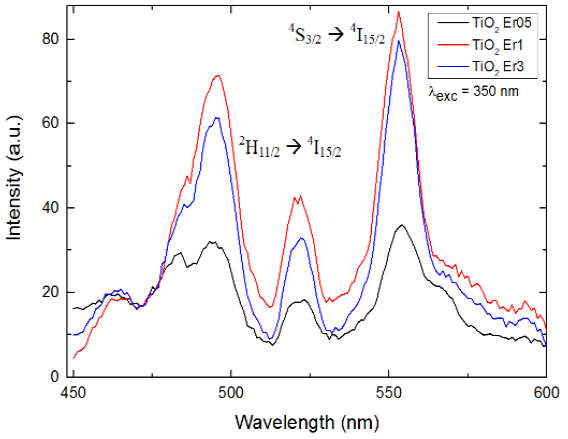
Fig. 2 PL emission spectra in the visible range (450-600 nm) for the TiO2 composites with different Erconcentrations (0.5, 1.0 and 3.0 wt%) with an excitation wavelength at 350 nm. Peaks association is described in the text
The first two peaks are associated with erbium transition 2H11/2→4I15/2 while the last one is associated with transition 4S3/2→4I15/2[6,10,17-20]. It can be seen that intensity increases notably when Er3+ concentration increases from 0.5 to 1 wt%.
However when we keep increasing concentration up to 3 wt% we found a quenching in the PL intensity. This might be due to energy transfer (ET) mechanisms associated with a saturation of the Er3+ ions, where the distance between neighbors decreases drastically as we increase concentration.
This feature may be useful for up-conversion (UC) studies, but is beyond the scope of this manuscript.
In Fig. 3 we show the relative intensities with respect to the sample TiO2Er05 (minimum intensity, represented by the black dashed line). Red dots represent the ratio IEr1/IEr05 for the three wavelengths where the peaks were located (495, 520 and 553 nm).
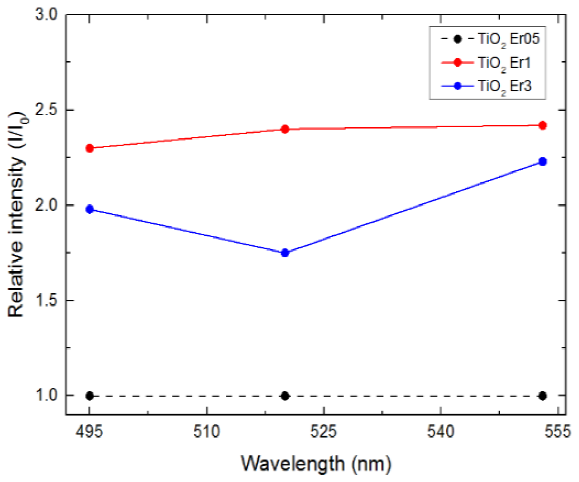
Fig. 3 Relative intensities for the TiO2 Er1 and TiO2 Er3 composites with respect to TiO2 Er05 composite. Description is provided in the text.
Blue dots correspond to the ratio IEr3/IEr05. Solid lines were included to facilitate the comparison. It can be seen that the intensity profile for TiO2Er1 is 2.25-2.5 times higher than the corresponding intensity for TiO2Er05. TiO2Er3 shows lower values, between 1.75-2.25 times higher. After comparison from Fig. 3 we determined that sample TiO2Er1 is the most adequate for further characterizations.
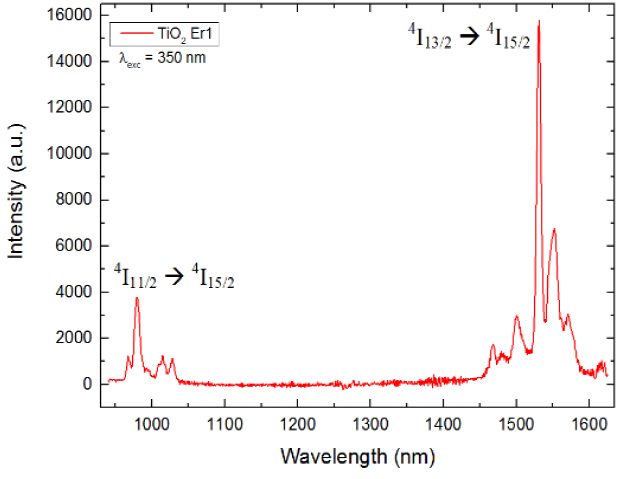
In Fig. 4 we show the PL emission spectrum for TiO2Er1 in the IR range, from 940 to 1625 nm. We found peaks around 980 nm which are associated with the transition 4I11/2→4I15/2 and a strong emission around 1531 nm associated with transition 4I13/2→4I15/2[17,21-23].
3.2 Crystal Structure and Morphology
Fig. 5 shows the characterizations performed for the structure and morphology of the TiO2Er1 composite.
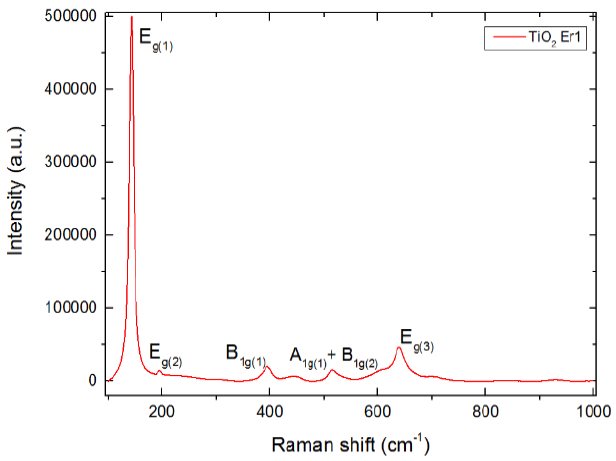
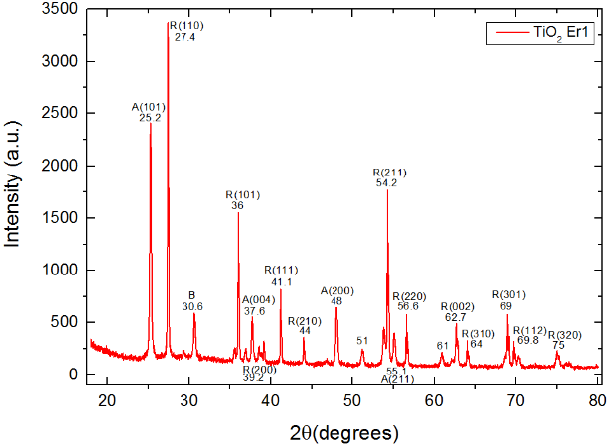
Fig. 5b XRD spectrum for the TiO2Er1 sample. In the association of the peaks we found a combination of rutile, anatase and brookite crystalline phases Peaks association is described in the text

Fig. 5a shows the Raman spectrum obtained. The peaks shown are the phonon modes associated with the anatase phase [1-3,6,9-10].
The 143 cm-1 associated with Eg(1) mode, 196 cm-1 with Eg(2), 395 cm-1 with B1g(1), 515 cm-1 with A1g(1)+B1g(2) and 639 cm-1 with Eg(3).
Fig. 5b shows the XRD spectrum obtained. We associated a total of 17 peaks [1,7] as follows: 12 peaks with the rutile phase: 27.4° with R(110), 36° with R(101), 39.2° with R(200), 41.1° with R(111), 44° with R(210), 54.2° with R(211), 56.6° with R(220), 62.7° with R(002), 64° with R(310), 69° with R(301), 69.8° with R(112) and 75° with R(320); 4 peaks with the anatase phase: 25.2° with A(101), 37.6° with A(004), 48° with A(200) and 55.1° with A(211) and finally one peak at 30.6° associated with the brookite phase.
Fig. 5c shows a SEM image obtained. The diameter for the crystals is in the range 100-400 nm.
4 Conclusions
We synthetized three Er3+-doped TiO2 composites with different erbium concentration (0.5, 1.0 and 3.0 wt%) with the sol-gel method. In order to find the most emissive sample we measured and compared the photoluminescent emission spectra using an excitation wavelength at 350 nm.
We found three main peaks in the green region associated with Er3+ transitions 4S3/2→4I15/2 and 2H11/2→4I15/2. We determined that the sample TiO2Er1 (1.0 wt%) had the highest intensity profile and then we performed further characterizations on this composite. We also measured its photoluminescent emission spectrum in the infrared region using the same excitation at 350 nm and we found strong emission peaks associated with transitions 4I11/2→4I15/2 and 4I13/2→4I15/2. The most intense peak located at 1531 nm corresponds to the well-known window used in communications and fiber amplifiers due to its maximum transmittance. Because of this, we consider that this composite could have promising potential in applications in those fields.

