


 nueva página del texto (beta)
 Inglés (pdf)
 Artículo en XML
 Referencias del artículo
 Enviar artículo por email
 Citado por SciELO
  Similares en
SciELO
Similares en
SciELO 
 Permalink
1 Introduction
Ethanol, also known as ethyl alcohol, is an important constituent in a myriad of applications, such as in alcoholic beverages.
It is also widely used as antifreeze, disinfecting and antiseptic agent. Therein learning the final concentration, in a practical way, is quite relevant to guarantee the quality of the outcome product. For example, in alcoholic beverages ethanol is found in the range of 3 to 70%, per volume. On the other hand, in disinfecting applications the concentration must exceed the 70%.
Henceforth, knowing the final ethanol concentration is of great technological and economic importance. Common methods to measure ethanol concentration relay on its chemical or physical properties and its behavior under an external stimulus, for example, the densimeter, alcoholmeter, pycnometer, ebulliometer, chromatography, spectroscopy, etc. However, in order to guarantee the proper functioning of the detection device it is important to know how the indirect variable behaves in its dynamic range.
When considering the volumetric mixture between two liquids and its optical detection methods, it is important to find a reliable relationship between its direct and indirect variables even if that occurs in a bounded range. Such is the case of an ethanol and water blend.
The direct variable, in this case, corresponds to the ethanol concentration and it is estimated by measuring the indirect variable i.e. the refractive index. Experimental measurements previously reported in the literature show that the relationship between the refractive index and the concentration of ethanol in water is not linear throughout the concentration [1-5]. However, there is a convenient region where the refractive index behaves linearly with respect to the ethanol volumetric concentration.
In this work we demonstrate that it is possible to establish a linear relationship between the ethanol concentration in water and its resulting refractive index. Furthermore, we develop an analytical method that employs an optical refractometric sensing approach to determine its concentration based on its specific spectral sensitivity response.
2 Linear Model between Refractive Index and Ethanol Concentration in Water
In our study, we use the experimental data of ethanol concentration in water by weight C%w already reported [1] see Table 1. For our purposes, it is convenient to have the concentration of ethanol expressed as a percent by volume C %v as the typical measurement parameter. Hence, we need to establish a relationship that relates both percentages, by weight and by volume, which is given by the following equation:
Table 1 Data recorded by J. Nowakowska [1] expressing the refractive index of ethanol in water at four different temperatures with respect to the ethanol percentage concentration by volume and that calculated by weight
| C%W | C%V | n20C | n25C | n30C | n35C |
|---|---|---|---|---|---|
| 0 | 0 | 1.33316 | 1.33276 | 1.33178 | 1.33174 |
| 7.61 | 9.43 | 1.33795 | 1.33720 | 1.33658 | 1.33600 |
| 15.55 | 18.88 | 1.34362 | 1.34304* | 1.34188 | 1.34035* |
| 24.42 | 29.00 | 1.34914 | 1.34926* | 1.34715 | 1.34502 |
| 41.51 | 47.29 | 1.35856 | 1.35722* | 1.35580 | 1.35404 |
| 60.45 | 65.90 | 1.36336 | 1.36185 | 1.35992 | 1.35811 |
| 66.44 | 71.45 | 1.36410 | 1.36263* | 1.36060 | 1.35880 |
| 71.23 | 75.79 | 1.36462 | 1.36308* | 1.36104 | 1.35908 |
| 77.35 | 81.19 | 1.36476 | 1.36340* | 1.36116 | 1.35911 |
| 82.86 | 85.94 | 1.36490 | 1.36314* | 1.36113 | 1.35913 |
| 83.55 | 86.52 | 1.36486 | 1.36309* | 1.36098 | 1.35901 |
| 92.68 | 94.12 | 1.36370 | 1.36166 | 1.35963 | 1.35760 |
| 96.33 | 97.07 | 1.36237 | 1.36083 | 1.35835 | 1.35600 |
where ρ ethanol is the ethanol density. Table 1 shows the concentration of ethanol per weight along with the corresponding concentration per volume calculated using Eq. (1). It also shows the respective refractive index (n) of the solution at four different temperatures.
Due to uncertainties of data extraction from the original source, data points marked with an asterisk represent the interpolation with its two closest neighbors. The refractive indices as a function of ethanol concentration are plotted in Figure 1(a) along a 6th degree polynomial fit curve to show better the parameter behavior. From those curves, we observe a linear behavior from 0 to 45% at specific temperature, as shown in Figure 1(b).
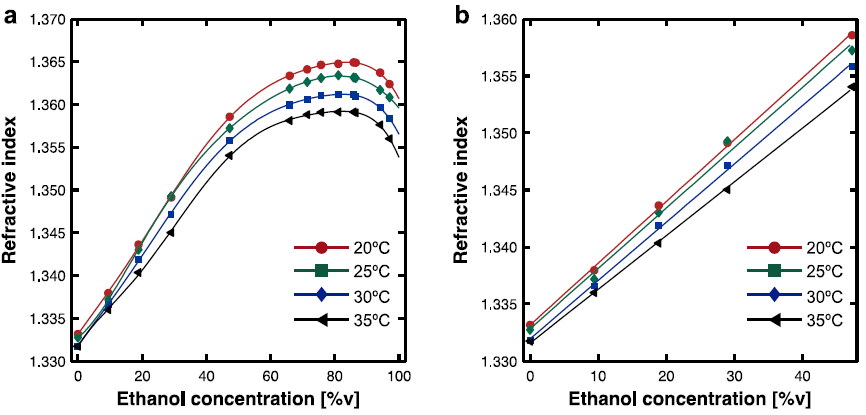
Fig. 1 (a) Plots of percentage by volume C and the experimental data of refractive index with a 6th degree polynomial fit. (b) Linear relationship in the range of 0% to 45%. Lines represent the rms linear approximation
From the plot it is clearly observed that the refractive index of the solution also depends on the. The thinner the solution, due to an increase in its temperature, the light propagates faster. In this linear range, we can establish a convenient relationship between the concentration (C) and the refractive index (n) at a given temperature. The linear fit to the experimental data is given by:
where (C 0 , n 0 ) are the pure water values and (C 1 , n 1 ) is an arbitrary value within that range.
In Figure 1(b), the data has been approximated by a linear function n=aC+n 0 obtained through a root mean square (rms) data fit. There is a small variation between the rms (n 0 ) and the experimental (n 0 ), but we have considered that negligible for our purposes. The temperature (T), the slope (a), the reference refractive index (n 0 ) at pure water and the residuals norm (NR) are listed in Table 2.
3 Optical Sensitivity
There are different varieties of optical devices whose resonance is directly impacted by the refractive index of the environment. For example, electromagnetically coupled charged oscillation at a metal and dielectric interface called surface plasmons (SP). Depending on its bound state SPs can be propagating SPs supported at planar interfaces or localized SPs (LSP) supported in subwavelength metallic nanostructures.
The resonance in LSP is imposed by many parameters, such as the morphology, dimensions, type of metal and excitation conditions.
Nevertheless, for a fixed configuration, the main tuning parameters is the refractive index of the surrounding media thus profiling this type of resonances as versatile refractometric sensors different types of plasmonic devices have been reported showing a linear relationship between the LSP resonance (LSPR) and the surrounding refractive [6-11].
The refractive index sensitivity S, for LSP and other optical refractometric sensors, is the defined by:
Our objective is to find ranges where the sensitivity is constant in relevant domains.
Although, in general, we may only consider domains of small refractive index variations [6], which is the case of ethanol in the 0-45 %v, it is viable to consider it as our convenient linear domain range.
For two known pair of values of refractive index and its corresponding LSPR wavelength, say (n 0 ,λ 0 ) for pure water and (n 1 ,λ 1 ) for another ethanol water mixture within 0-45 %v, the constant sensitivity can be expressed as:
Therefore, we can obtain a linear expression that relates the refractive index with the plasmonic device plasmon resonance wavelength. We can compute a particular value of the refractive index n by using Eq. (3) at a given λLSPR in that range if we select a known reference point, let's say (n0,λ0), hence we obtain:
4 Linear Model between the Optical Sensor Response with Respect the Level of Ethanol Concentration
So far, we have a couple of linear relationships. The first one is between refractive index with concentration of the ethanol in water mixture, Eq. (2), and the second one is between refractive index with the plasmonic device LSPR wavelength, Eq. (5). Both expressions are linear in the selected interval.
To establish an indirect measurement method for the concentration of the mixture with the plasmon resonance wavelength we propose a model that includes both results and that it's the aim of this work. In the same terms that we have done our previous derivation, we may chose as a common reference point the LSPR wavelength λ 0 at pure water. Then we need to measure another LSPR wavelength λ 1 at (C 1) around our refractive index linear range.
Once we relate both equations, we get the desired model that directly relates the LSPR wavelength λ LSP at the concentration percentage (C):
This theoretical result provides a tool to indirectly measure the level of ethanol concentration from the plasmon resonance wavelength. However, as any experimental measurement method, and the equipment used, we have to take into account the susceptible of errors. Therefore, it is convenient to know the uncertainty level of the Eq. (6), given [12]:
where δλ LSP , δλ 0 and δλ 1 are measurements uncertainties of λ LSP , λ 0 and λ 1 , respectively.
From Eq. (6), we realize that if we know the LSPR sensitivity, then the above expression can be further simplified as:
where (a) is the slope of the linear approximation of the refractive index of ethanol in water mixture for a certain temperature, see Table 2. The uncertainty can be calculate by:
As stated by Eq. (8) we can determine the concentration of ethanol in water by taking a pair of LSPR wavelengths, one at zero concentration C (which is usually done at calibration) and the current LSPR λ LSPR .
5 Conclusion
We have established a linear relationship between the LSPR wavelength (of the plasmonic device) and the ethanol concentration (of the ethanol in water mixture), under the assumptions of a linear refractive index of ethanol concentration and a constant plasmonic sensitivity (S). We have pointed out a region where that is the case, corresponding to 0-45% %v. Our mathematical model has the advantage that it is only necessary to take two reference values or a single reference value and a known sensitivity (S). The model is so promising, and convenient, that a thorough experimental review is a must. Clearly, there is temperature dependence, Table (1), but not enough data sets. Henceforth, we need to confirm the actual mixture refraction index temperature dependence from the concentration linear superposition of the water exponential decaying temperature dependence [13] and the linear one for the ethanol [14]. This model is quite attractive to be further explored in other important mixture where similar feature would arise.

