


 nova página do texto(beta)
 Inglês (pdf)
 Artigo em XML
 Referências do artigo
 Enviar este artigo por email
 Citado por SciELO
  Similares em
SciELO
Similares em
SciELO 
 Permalink
1 Introduction
The expression “Computational Intelligence” was first introduced by James Bezdek in a seminal paper [1], where he enunciate the foundations of Computational Intelligence, as well as the differences between this new discipline and Artificial Intelligence. However, it should be noted that the expression coined by Bezdek only changes the qualifying adjective to the word Intelligence, which from "Artificial", it becomes "Computational". Within this context, some specialized authors have defined “Computational Intelligence” as the set of computational models and intelligent tools capable of accepting data coming from sensors, in order to process them efficiently, to generate reliable, fast, and highly failure tolerant responses [2].
Within the Alfa-Beta group (to which the authors of this work belong), we have reflected deeply on these facts. We have discussed at length the contents of scientific works within Computational Intelligence, which span a variety of subjects; for example, topics as supervised classification [3, 4], data preprocessing [5-7], data associations [11-13], time series mining [14-16] and data streaming [17-19], among others.
We have concluded that, in all cases of the sample examined, the authors agree with [2], in the sense that they develop or apply "intelligent tools" and "computational models". In this context, an interesting result that we have arrived at, is that the authors do not mention that intelligence is computational, but rather that the models are computational; and in addition, they do not mention intelligence as a noun, but that it is affirmed that tools are intelligent (here, the word intelligent is used as a qualifying adjective).
All these facts and serious discussions have led the members of the Alfa-Beta Group to conclude, in a responsible manner, that the phrase "Computational Intelligence" does not faithfully reflect the essence of the works included in this discipline. We affirm categorically that the phrase "Intelligent Computing" is much more adequate to express the essence of the mentioned contents. Thus, from here on we will use the expression Intelligent Computing (IC).
For the development of new IC models and algorithms, it is necessary to compare them with respect to existing similar models; and for this task, several researching supporting tools have been developed. Among the most popular tools are WEKA [20] and KEEL [21], which fasten the researching process, due to they include existing algorithms and procedures. However, the researchers in the IC community suffer from numerous functionality insufficiencies.
The proposal of this research consists on the creation of a software prototype to execute experiments in IC. The proposed prototype (EPIC), keeps the main functionalities and characteristics of WEKA and KEEL, and overcomes some of their insufficiencies. Besides, EPIC includes additional IC algorithms.
EPIC has a simple yet effective architecture, capable of fulfilling the needs of users; in particular, the need of directly handling mixed and incomplete data, without any data transforming or preprocessing, and the need of handling data belonging simultaneously to several decision attributes (multi-target classification).
In addition, the developed prototype has an Input/Output interface compatible with the data files managed by WEKA and KEEL. It also has a module for data transforming, a module for data partitioning by several validation techniques, and a user friendly interface to visualize the results of classification algorithms over two dimensional (2D) data. Additionally, EPIC has a user interface to develop supervised classification experiments, which is friendlier and has more functionalities than the ones by WEKA and KEEL.
2 Related Works
Table 1 summarizes some of the characteristics of existing tools to support research in IC. The characteristics considered are the presence of a user interface (UI), if the tool has not cost (Free) and if the tool requires internet access in order to be executed (Internet).
Table 1 Most used tools for IC
| Tool | UI | Free | Internet |
|---|---|---|---|
| Accord [22] | - | X | - |
| Amazon - Machine Learning [23] | X | - | X |
| Apache Singa [24] | - | X | X |
| Azure ML Studio [25] | X | - | X |
| Caffe [26] | - | X | X |
| KEEL [21] | X | X | - |
| Mahout [27] | - | X | - |
| ML Pack [28] | - | X | - |
| Oryx [29] | - | X | - |
| Pattern [30] | - | X | - |
| Scikit-learn [31] | - | X | X |
| Shogun [32] | X | X | X |
| Spark MLib [33] | - | X | - |
| Tensor Flow [34] | - | X | - |
| Theano [35] | - | X | - |
| WEKA [20] | X | X | - |
In this research, we focuses on tools having user interfaces. This is due to we consider that the researchers must have access to a friendly environment, which allows the effortless design and execution of experiments, and also to be easy to explain to undergraduate and postgraduate students in fields related to IC, in a way such that the fast and reliable knowledge acquisition is guaranteed.
On the other hand, we want the tools to be free of charges, and to do not require an internet connection, in order to execute experiments off-line, and without depending on external networks. In addition, we want the data to be protected.
According to the previous analysis (Table 1), the tools fulfilling the three main requirements (UI, Free and no Internet) are WEKA and KEEL. However, both tools had some lack of functionalities, and an architecture design which difficult their daily use for handling mixed data directly, and to include algorithms such as associative memories. With this research, we aim at successfully solve such problems.
Considering the above, and carrying out a deep analysis of both tools, we found out that some of the drawbacks of WEKA are:
It does not allow the visualization of classification results of the instances in two dimensions (2D).
It does not allow the use of dissimilarity functions for mixed data descriptions (it only have distances, to be computed over real data).
It arbitrarily handles mixed and incomplete data (the architecture assume that the feature values of instances are an array of doubles, and it converts the data to fulfill the architecture requirement).
It does not include any associative supervised classifier.
Its architecture does not allow associating an instance with something apart from a single class label.
It does not have the functionality to create synthetic data.
It does not allow serializing data partitions.
On the other hand, KEEL tool also have some drawbacks, as follows:
It does not allow the visualization of instance classification results in two dimensions (2D).
It does not include any associative supervised classifier.
It does not have the functionality to create synthetic data.
It converts mixed and incomplete data (the architecture assume that the feature values of instances are an array of doubles).
It does not allow changing the dissimilarity function in the Distribution optimally balanced stratified cross validation (Dob-SCV), data partitioning procedure.
The new EPIC platform overcomes these drawbacks of WEKA and KEEL.
3 Methods and Materials
In this research, we have decided to start the creation of EPIC from scratch, in order to develop an effective solution to the architectural problems shown by WEKA and KEEL.
We decide to use C# programming language, and the Integrated Development Environment (IDE) Visual Studio Community 2017, due to the facilities they offer to create a tool with a very user-friendly interface. Despite C# is not a multiplatform language, we consider that its use will no represent a difficult, due to the widely extension of Windows operating system in Mexico and the rest of the world.
On the other hand, the IDE used is free, and its license allows the development of academic and researching software.
3.1 Core Architecture of the Tool
In order to make experiments with IC algorithms, one of the main users’ requirements is the capability of directly handling mixed as well as incomplete data; besides, users also want to handle multiple target attributes (many decisions attributes) and also to associate an instance with some else than a decision class label (for instance, to create an auto-associative memory).
To offer a satisfactory response to such user requirements, we have designed a software core architecture, which includes the classes to handle mixed as well as incomplete attribute values, and to handle several decision attributes.
In addition, we consider the existence of several kinds of classes. Thus, we can directly model supervised classification problems (where the decision attribute has nominal labels), regression problems (where the decision attribute has numeric labels), among others.
Additionally, we consider the possibility that a dataset has more than one decision attribute (as in multi-target classification problems).
It allows us to directly implement multi-target classification algorithms (such as ALVOT [36-40]), which does not require to convert the multiclass problem into several single class problems. This is a clear architectural advantage over some existing tools, such as MEKA [41].
4 Results and Discussion
In this section, we offer a general description of the user interface of the proposed Experimental Platform for Intelligent Computing (EPIC), as well as its functioning. It is worth noting that EPIC is fully Input/Output compatible with both WEKA and KEEL; i.e., EPIC handles. ARFF (native file format of WEKA) and DAT (native file format of KEEL) files; thus, EPIC is able to write and read files generated by both WEKA and KEEL.
4.1 User Interface of EPIC
EPIC has three modules at this time. In the first module, it is possible to manually create a dataset in two dimensions (x-axis and y-axis), in a way fully controlled by the user (Figure 1). It is worth mentioning that neither WEKA not KEEL have such functionality.
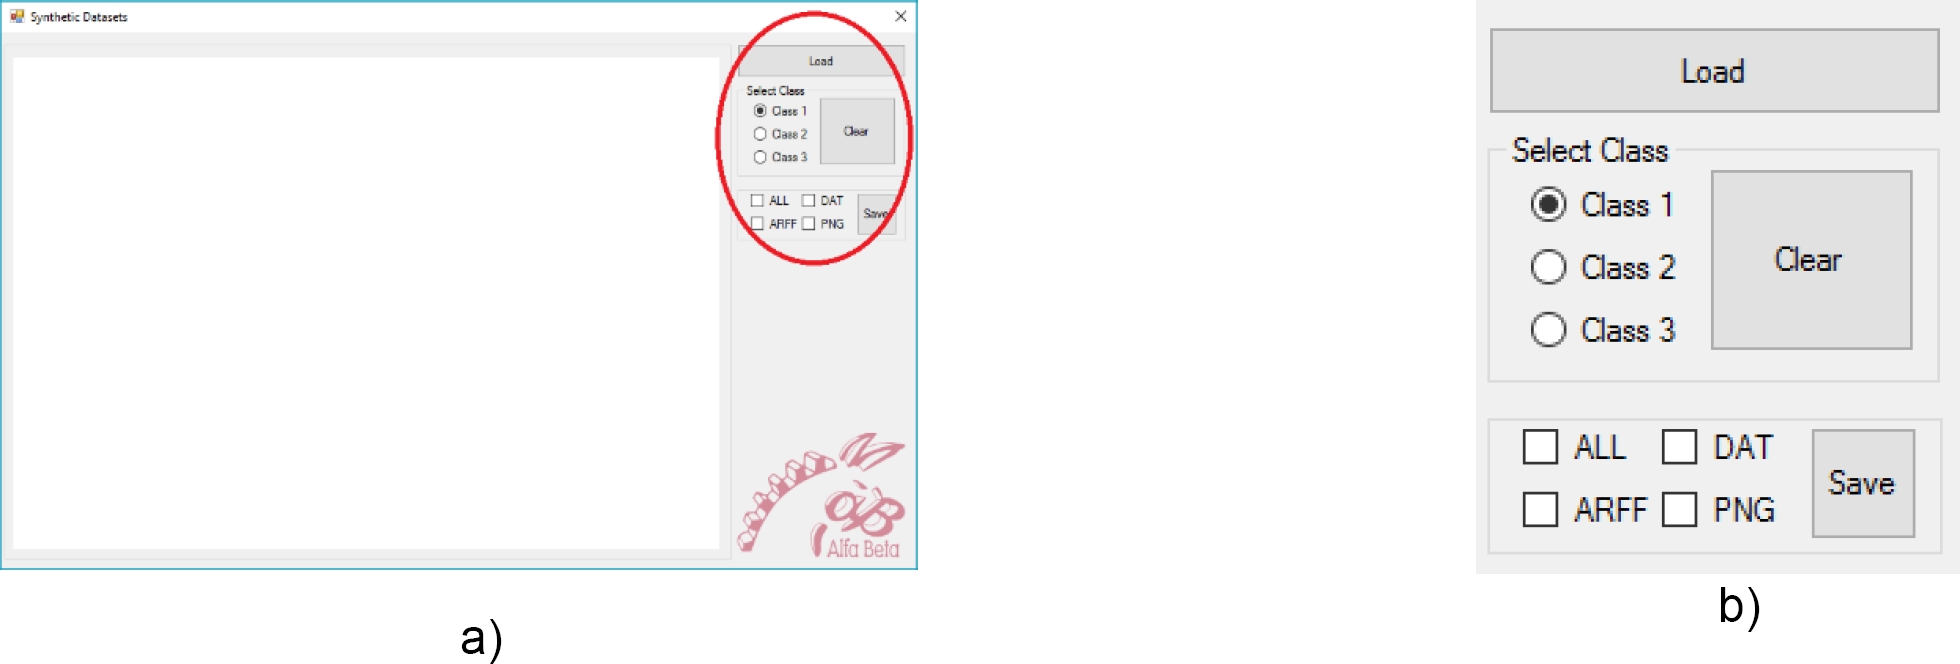
Fig. 1 User Interface of the Synthetic Datasets module of EPIC. In a) is shown the overall view, while in b) is shown a zoom of the highlighted area
Having a two dimensional dataset, designed in a way such that it fully fulfils the current researchers needs, turn to be really useful, due to, in several times, it is necessary to study the behavior of algorithms under certain data configurations.
For such tasks, it is convenient to have a friendly user interface allowing to design the datasets with the desired spatial configuration, and to export such dataset to well-known and popular file formats.
The synthetic dataset created with EPIC can be exported in .ARFF format (used by WEKA) and in a .DAT format (used by KEEL). By this, EPIC guaranteed a full file compatibility.
In addition, it is possible to export in a .PNG format, the image of the synthetic dataset created. This option of exporting a graphical representation of the 2D dataset is extremely useful, due to it allows the direct incorporation of such images in researching papers, thesis, technical reports, and other important documents.
As shown in Figure 2, EPIC shows the created datasets with class labels of different shapes and colors (in the example, there are two classes: Class 1, blue-circles, and Class 2, mustard-squares). The class legend is shown in the upper right corner of the user interface.
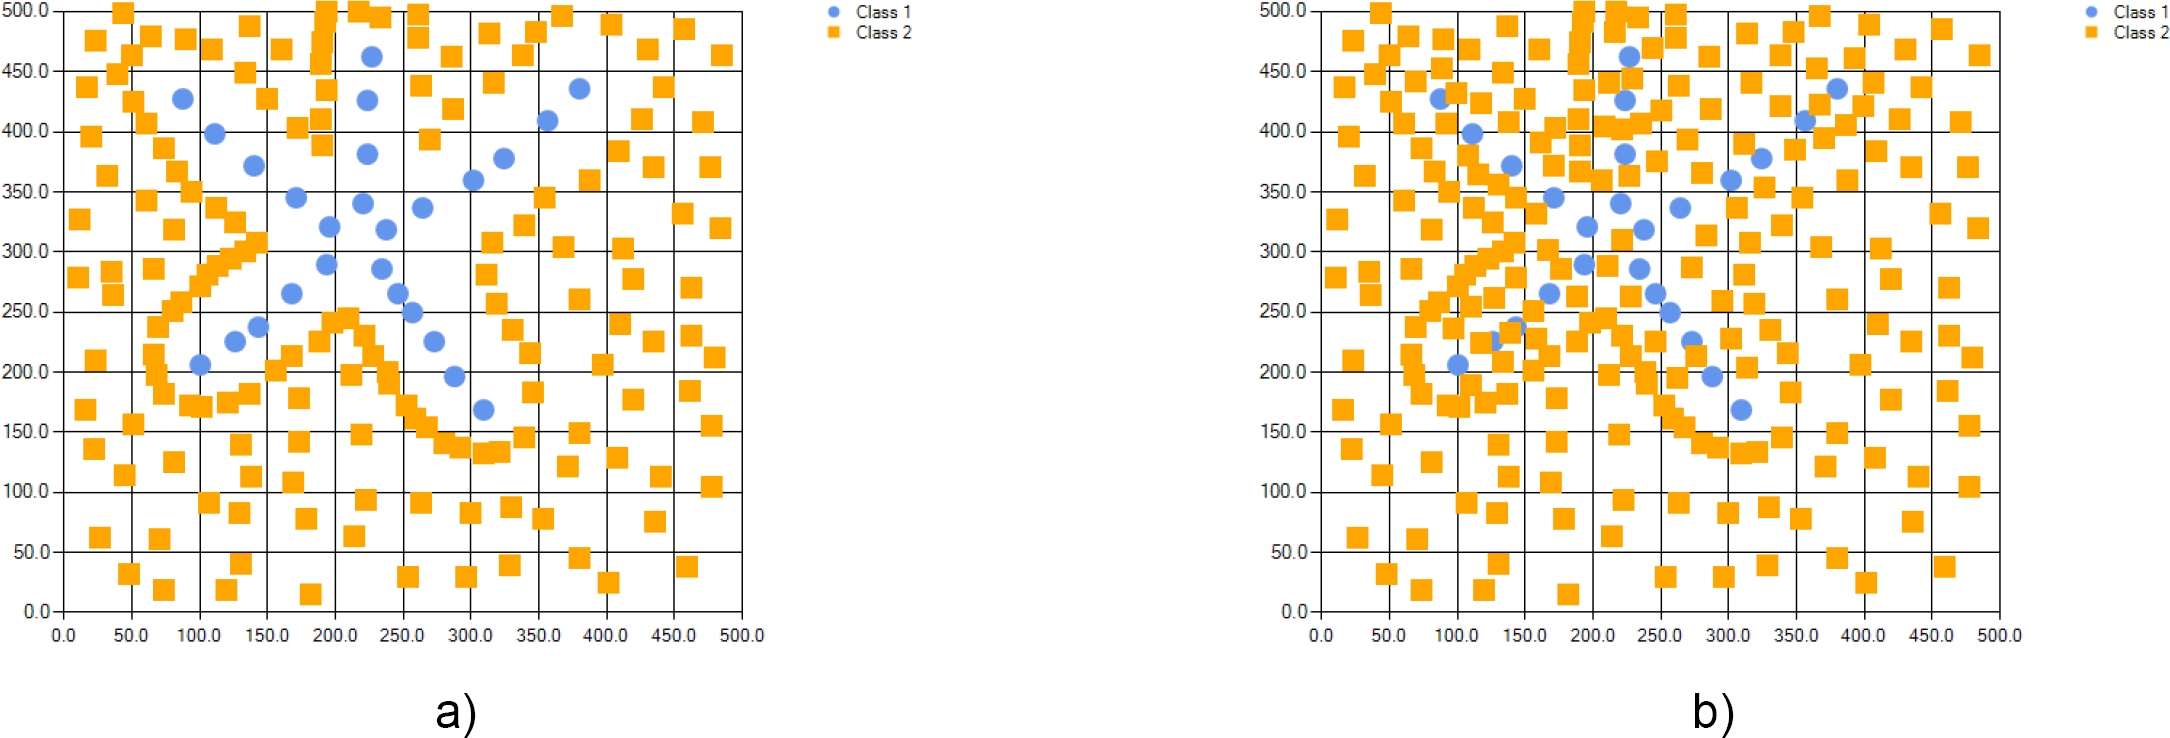
Fig. 2 Example of datasets obtained with the Synthetic Datasets module of EPIC. In a) is shown a clover dataset, while in b) is shown an overlapped version of the dataset in a)
Using this, the user can visually appreciate the data distribution, and to carry out the desired corrections and comparisons.
The second module of EPIC allows to create a synthetic dataset from known statistical data distributions. For such task, we used some of the statistical distributions offered by Accord [22]. In this module, the user defines the desired amount of samples, and the desired distribution for each class.
It allows obtaining in a fast and extremely simple way, huge amounts of data points, following the desired data distribution. Figure 3 shows the user interface of the Synthetic Datasets from Statistical Distributions module of EPIC.
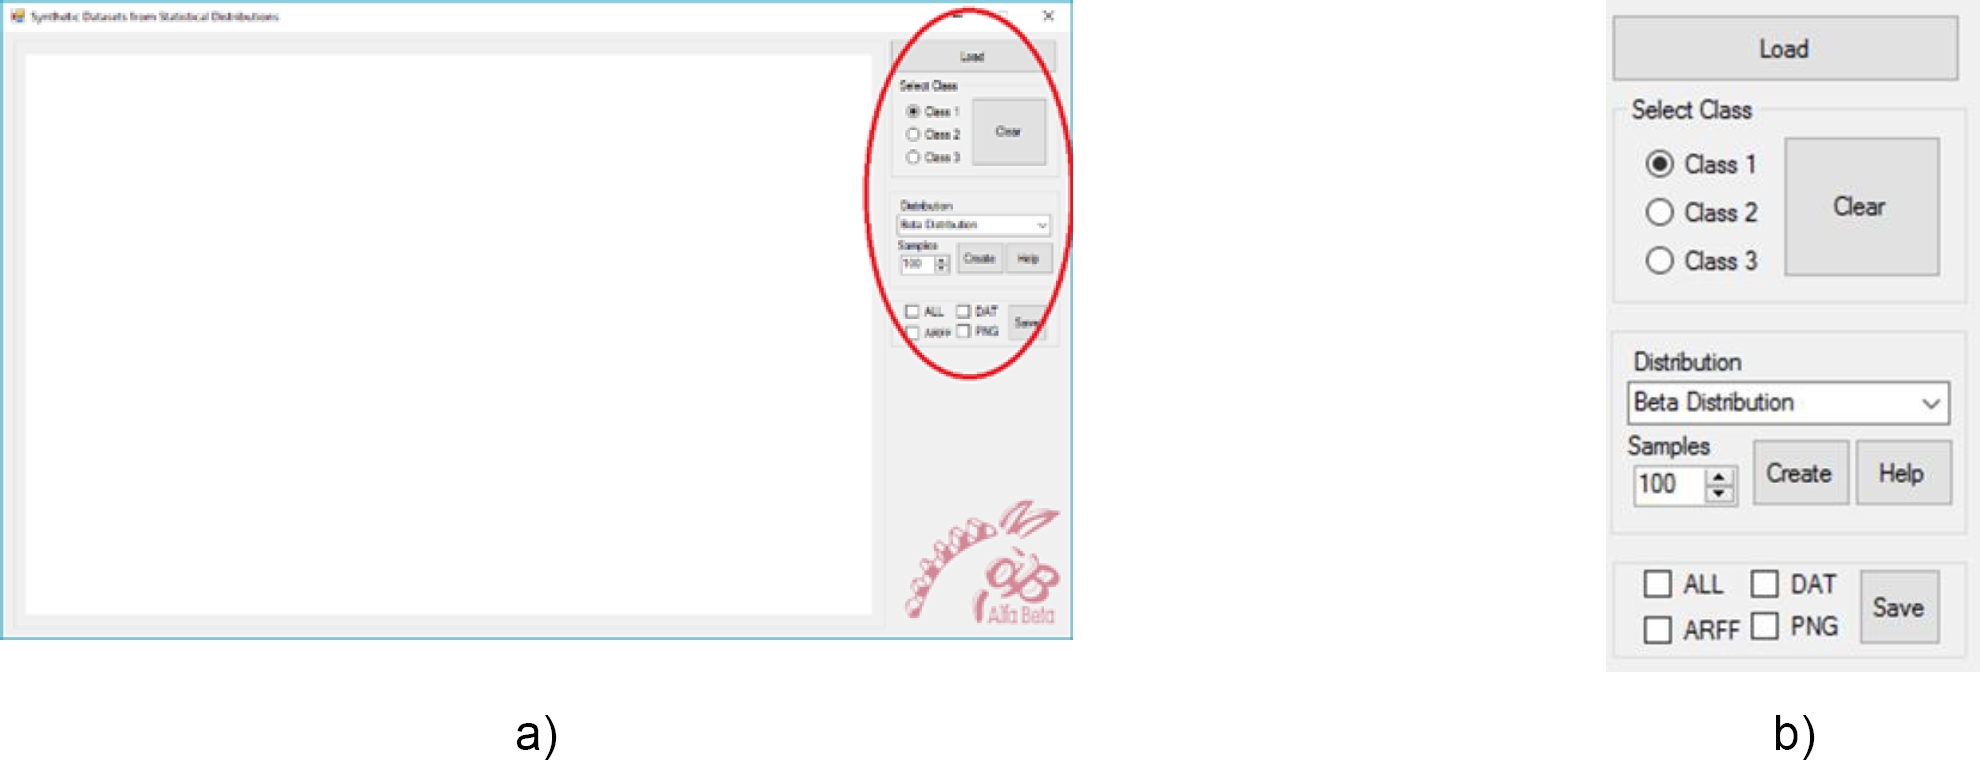
Fig. 3 User Interface of the Synthetic Datasets from Statistical Distributions module of EPIC. In a) is shown the overall view, while in b) is shown a zoom of the highlighted area
As previous module, the obtained dataset can be exported in .ARFF and .DAT file formats (Figure 3b), and the corresponding graphical representation can be exported in .PNG, making easier its further use. Figure 4 shows an example of a dataset created with EPIC, with three classes (Class 1 blue-circles, Class 2 mustard-squares, and Class 3 red-triangles), having 100 instances each, and following a Normal distribution, but with different means and standard deviations.
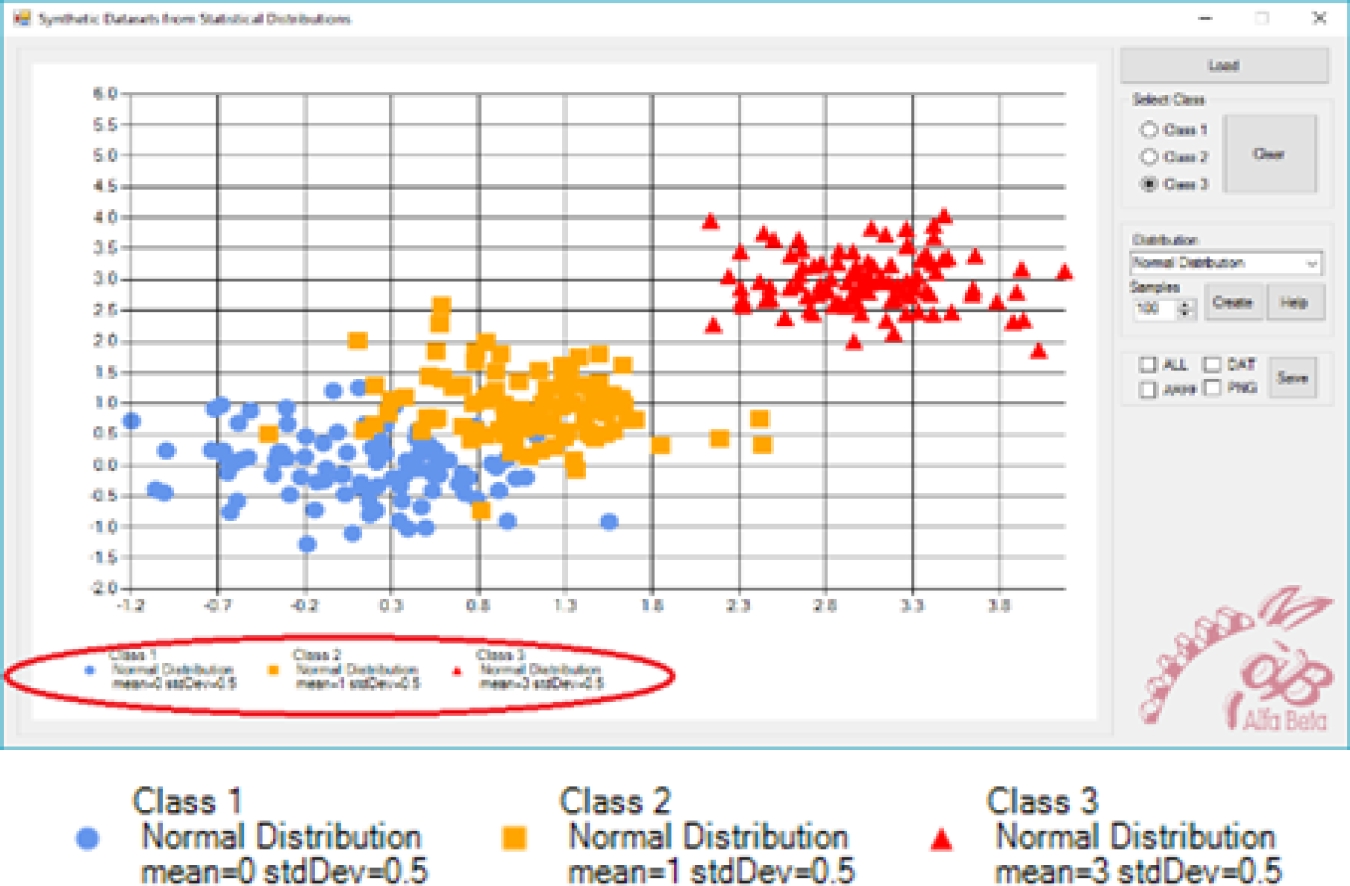
Fig. 4 Example of dataset obtained with the Synthetic Datasets from Statistical Distribution module of EPIC. In a) is shown the dataset, while in b) is zoomed the highlighted legend
The legend shows the name of the classes, as well as the name of the used statistical distribution, and the corresponding parameters and values.
In the example, the parameters for a Normal distribution are mean and standard deviation.
It is important to highlight that neither WEKA nor KEEL had functionalities for creating synthetic data, designed to fit the user needs.
The third module of EPIC reads a two dimensional dataset in both. ARFF or .DAT file formats, and allows to visualize the decision boundaries of several supervised classifiers. For this, EPIC trains the corresponding classifier with the dataset read, and classifies the points in the graphic area.
In Figure 5, we show the user interface of the decision boundaries visualization module of EPIC. This functionality is extremely useful for researchers, due to it allows to visualize rapidly the uncertainty zones of the supervised classifiers, and to study interesting behaviors of the algorithms, as well as to deeply understanding their functioning.
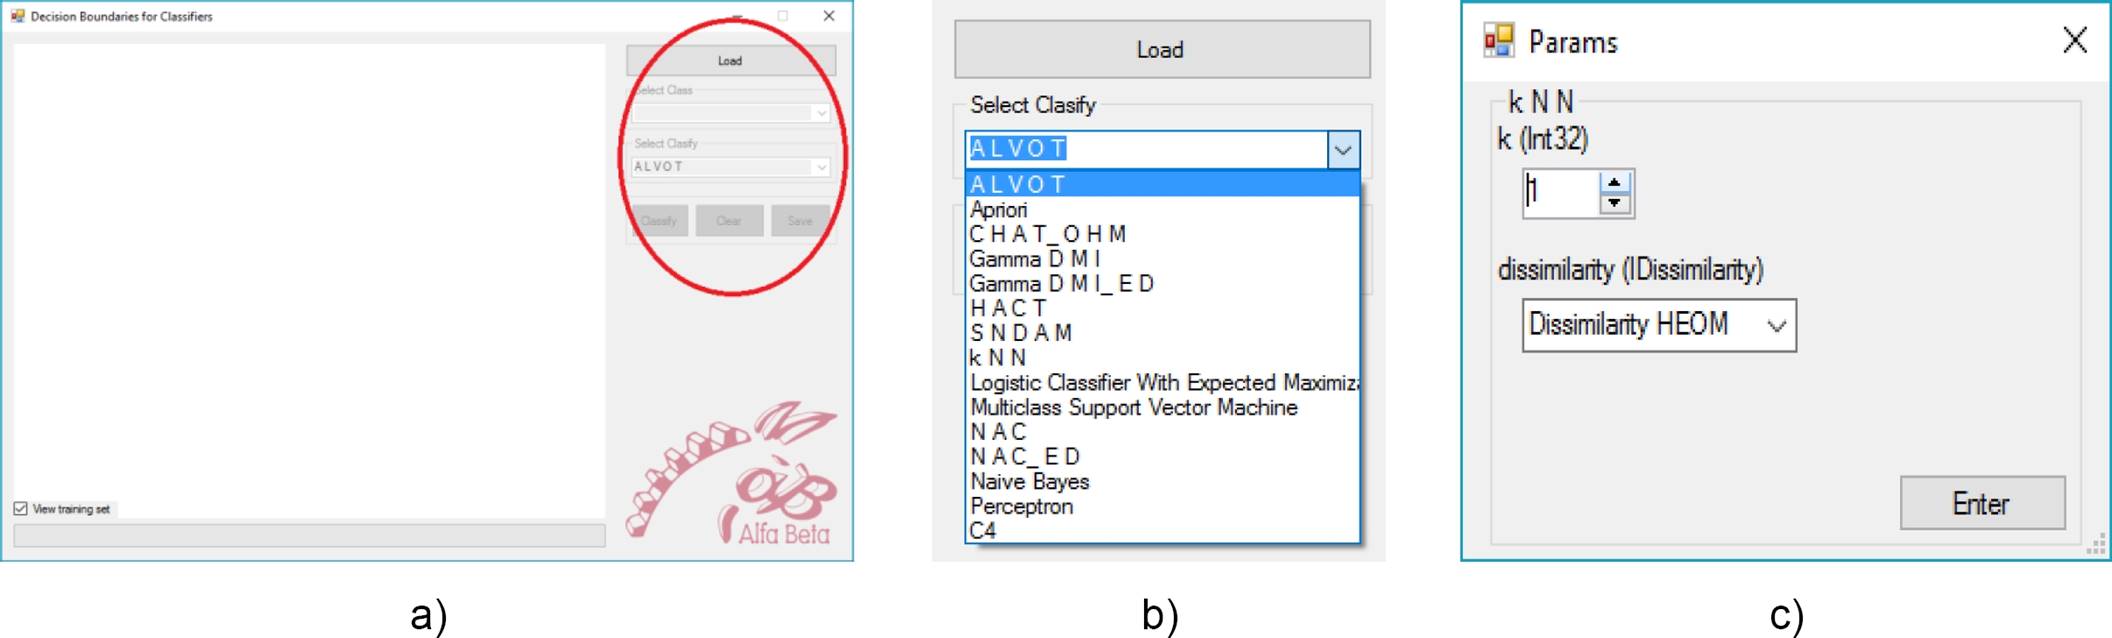
Fig. 5 User Interface of the Decision Boundaries for Classifiers module of EPIC. In a) is shown the overall view, while in b) is shown a zoom of the highlighted area. Note that the menu displays all available learning algorithms. In c) is shown another Windows form displayed to enter the parameters of the selected classifier, in this case, for kNN classifier
This is very important for complex datasets, having imbalanced data, and with small disjoints in the data.
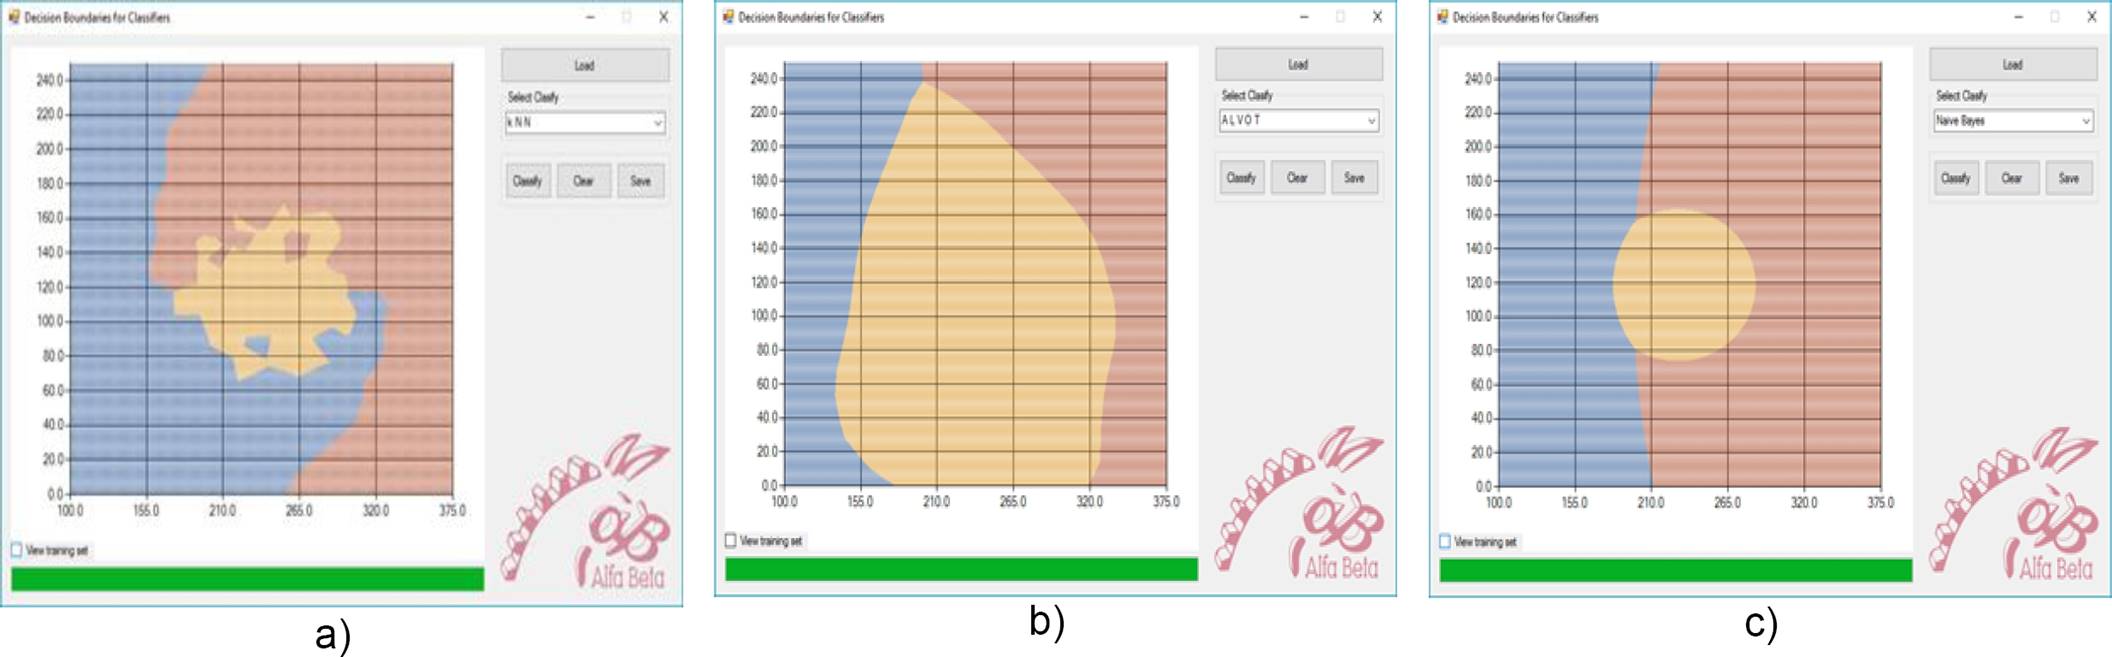
As show in Figures 6 and 7, the Decision Boundaries for Classifiers module of EPIC helps the user in the analysis of the behavior of several supervised classification algorithms, and allows stablishing comparisons with the desired data. In addition, this module can be of interest for researchers and practitioners within IC, by graphically showing the functioning of the algorithms, in the scenarios desired by the user.
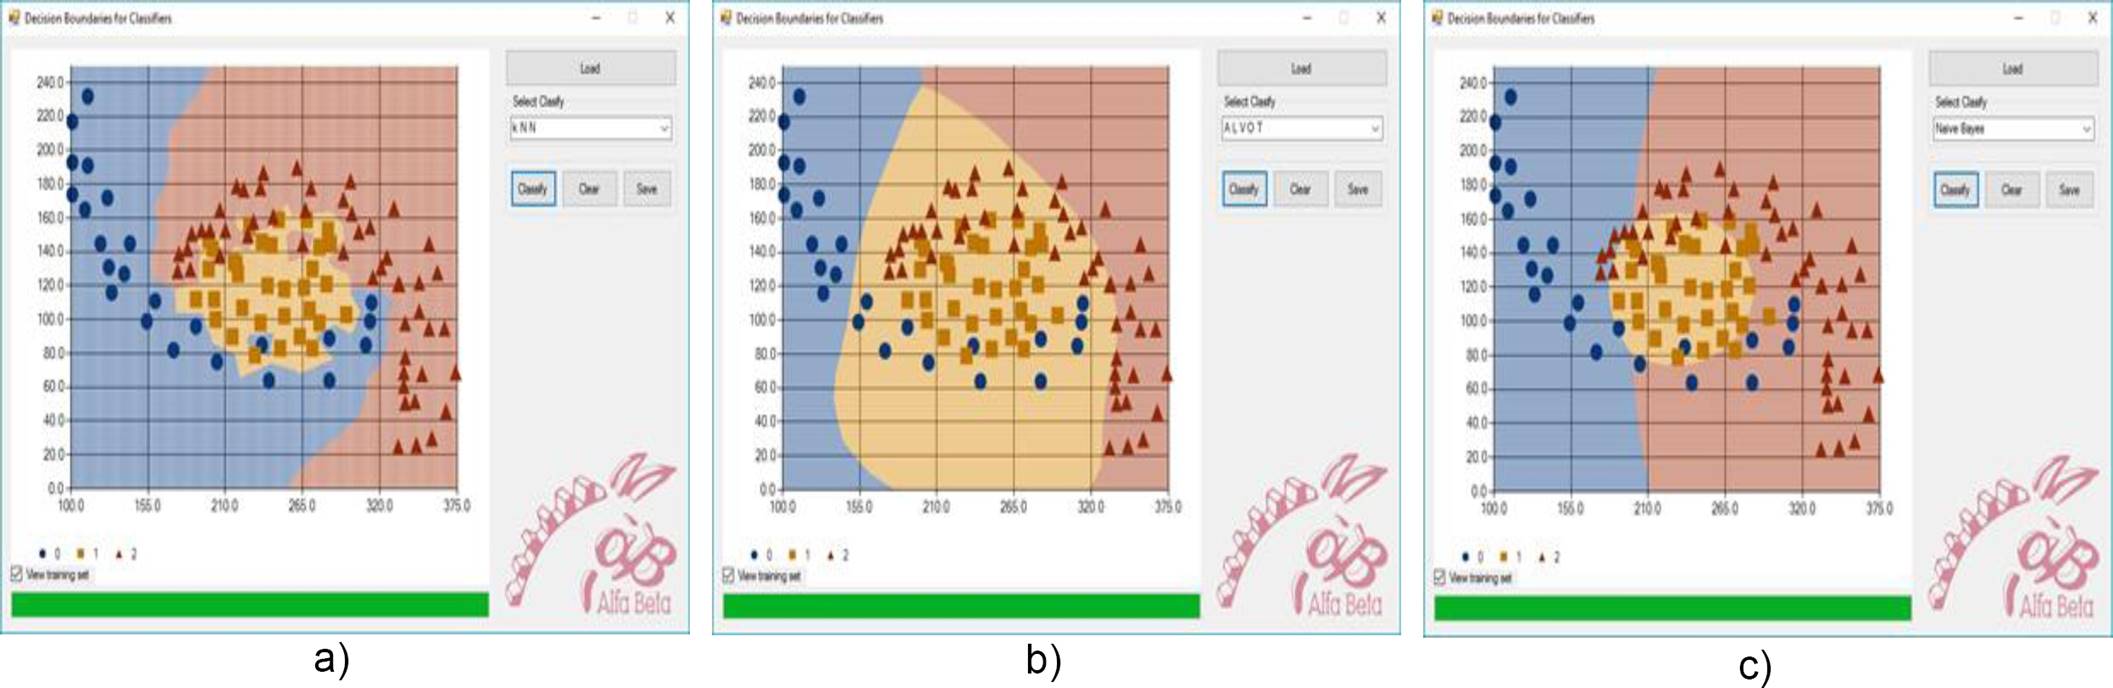
Fig. 6 Decision Boundaries for Classifiers in EPIC, showing training instances. In a) for a kNN classifier, in b) for a SNDAM classifier and in c) for the Naïve Bayes Classifier
5 Conclusions and Future Works
In this paper, we introduce a novel tool for Intelligent Computing research experiments. The tool, named EPIC, offers several desirable functionalities. It includes three modules for data processing, data generation and for the visualization of results of supervised classification algorithms. The architecture of EPIC allows to directly handling mixed and incomplete data, also having multiple decision labels. It allows the inclusion of supervised learning algorithms for multiple target classification and regression tasks.
As future works, we want to extend the EPIC tool, by adding more functionalities, including a module for the execution of experiments to evaluate the performance of supervised and unsupervised learning algorithms over multiple datasets.
The EPIC tool is under development, and the current release can be found at the Alpha Beta Group web site, available at http://www.alfabeta.org.

