


 nueva página del texto (beta)
 Inglés (pdf)
 Artículo en XML
 Referencias del artículo
 Enviar artículo por email
 Citado por SciELO
  Similares en
SciELO
Similares en
SciELO 
 Permalink
1 Introduction
Short Message Service (SMS) is used to send short text messages from one mobile device to another. This service is a very popular type of communication between people. However, not all SMS messages are solicited - mobile users receive legitimate messages and unwanted messages that are called spam.
SMS spam forms 20-30% of all SMS traffic in some parts of Asia [18]. Many reasons motivate spammers to use this service that support the growth of this problem such as an increasing number of mobile users who can be targeted, the higher response rate for this service, the limited availability of mobile applications for SMS spam filtering, lack of laws and regulations to control the purchase of phone numbers and the handling of this problem in some countries, and the availability of low-cost solutions that send bulk SMS messages easily [2, 12, 23, 25].
SMS spam has caused mobile users and mobile network operators many problems. Some types of SMS spam try to bill mobile users by tricking them into calling premium rate numbers to subscribe to services, or tricking the users into calling certain numbers so as to collect their confidential information for use in other purposes [18]. Furthermore, in some countries mobile users pay to receive their messages that may include spam messages [2]. Mobile network providers also suffer from this problem. They are prone to lose their subscribers because the signaling performance of the network can be degraded by the load that SMS spam generates [9]. They may also lose some revenue because they cannot receive a termination fee as some types of SMS spam are sent from fraudulent addresses [9].
Due to these problems, many methods have been used to avoid SMS spam. Among different methods, content-based classification has been extensively used for SMS classification either alone or with other methods [1, 2, 10, 11, 13, 16, 31, 35, 36, 38, 42]. Content-based classification uses some techniques to analyse SMS text message content to decide whether the message is legitimate or spam.
In the literature of content-based SMS classification, some researchers used the full extracted features to filter SMS spam. Other researchers, on other hand, used feature selection methods to select some of the extracted features for the filtering.
Therefore, the main object of this work is to analyse the relationship between features size and classification performance. For that, a classification performance comparison was carried out between different features sizes selected by different feature selection methods separately. Three feature selection methods, namely chi-square, Gini index and information gain were used in this work. Support vector machine method, which found as one of the most suitable model for SMS classification, was used as a classifier to classify messages into legitimate or spam class. Due to the class imbalanced found in the data set, we measured the classification performance using the Area Under the ROC (Receiver Operating Characteristics) Curve between true positive rate and false positive rate. The repeated measures Analysis of variance (ANOVA) at p < 0.05 level followed by post hoc multiple comparisons using Least Significant Difference test were used to analyse the classification performance significance between the features sizes.
Although several works found for content-based SMS classification, there is only one study that compared the impact of feature extraction and selection on SMS classification [39]. The differences between our study with that study are the following:
— We added one more feature selection method which is the information gain method.
— We used ten features sizes as compared with six features sizes in [39].
— The size of our collection is 5,610 samples while it was 875 samples in [39].
— We did a statistical testing to analyse the relationship between features sizes and classification performance.
— We compared our findings with its findings.
The importance of this study is to discover the ability to classify SMS effectively with some selected features in order to reduce memory usage and classification time. As a result, it helps to work in real time and with limited resources.
We organized the remainder of this paper as follows. Related work is given in Section 2. A brief background about feature selection methods and support vector machine are given in Section 3 and 4, respectively. Experimental settings are described in Section 5. The results and discussions are in Section 6. Finally, we give our conclusions in the last section.
2 Related Work
Content-based classification uses some techniques such as machine learning to analyse the features found in an SMS in order to decide whether it is legitimate or spam.
In the literature of content-based SMS classification, some researchers used all the extracted features, which extracted from public SMS data sets, to filter SMS spam [1, 2, 10, 11, 17, 31, 36]. Other researchers, on other hand, used feature selection methods to select some of the extracted features[13, 16, 35, 38, 42].
In [1, 2], the authors considered two different tokenizers. The first one represented tokens start with a printable character, followed by any number of alphanumeric characters, excluding dots, commas and colons from the middle of the pattern. The second considered tokenizer represented any sequence of characters separated by blanks, tabs, returns, dots, commas, colons and dashes. They also did not perform stop word removal or word stemming because such process tend to hurt spam-filtering accuracy. They used many classifier such as naive Bayes, C4.5, k-nearest neighbours and linear support vector machine (SVM) to classify messages. The best results was achieved with the first token with accuracy equals to 97.64%.
A vector representation using words, lowercased words, character bi-grams and tri-grams and word bi-grams was provided for machine learning methods to filter SMS spam [11]. Bogofilter with these features outperformed many filters such as SVM with performance equals to 0.116 in 1-AUC (%).
Expanded feature set includes words, orthogonal sparse word bigrams, character bigrams and character trigrams was used in [10]. SVM with this expanded set achieved the best performance with around to 0.0502 in 1-AUC (%).
In [17], the authors presented an efficient SMS spam filtering algorithm which utilized stylistic and text features in conjunction with SVM classifier. Two text features were explored : terms and character level n-grams. Two SVMs were trained on the stylistic features and the text features. An SMS message was considered spam if and only if both the classifiers classified it as spam. This methodology was used to avoid legitimate messages misclassification. The two SVMs methodology outperformed single SVM with either n-grams or words or stylistic features.
The work presented in [31] extracted space delimited tokens from the stored messages in the mobile. Then these tokens were used to build a weighted graph. After that, the probability of occurrence of specific token and the link probability of nodes in both legitimate and spam messages were computed. Then, they used KL-Divergence measure for the classification. Simulation results showed that the false detection of legitimate messages was less than 0.08 with two data sets but the spam detection accuracy for one of the data sets was around 0.65.
Recently, three categories of features that based upon the length of SMS that greater than 100 characters, special characters (i.e. numbers and symbols) and keywords were used to detect SMS spam from three data sets [36]. Theses categories were selected based on analysis conducted by the authors. To find the best combination for optimum detection using these three categories, the authors tested five different combinations. Simulation results showed that there is no best combination for all the data sets but the best combination for each data set used legitimate and spam keywords.
In [13], dual filtering was proposed. First, rough set and k-nearest neighbors algorithm (k-NN) were applied together to filter SMS spam messages. Followed by that, k-NN was used again to re-filter some messages to avoid lowering precision in the first filtering. Through the experiment, the dual filtering achieved high accuracy compared to the performance using k-NN alone. However, the classification time was increased. This paper reduced the number of used features to filter SMS spam by reducing the number of samples used in training using rough set but there is no indication of the number of used features.
The authors in [16] used information gain method (IG) to select three different features sizes: 100, 200 and IG > 0 to represent the messages. naive Bayes, C4.5, PART and SVM were used in the experiments. They found that SVM with 200 features was the optimal classifier for English data set while SVM with IG > 0 was the optimal for Spanish data set.
In [29], the authors used naive Bayes and word occurrences table to filter SMS spam on an independent mobile phone. Ten messages for each class were used to train the filtering system while 855 messages were used for the testing. The filtering system was updated by the user when misclassification was found. The obtained result was 90.17% accuracy with around 0.04 seconds to classify one incoming SMS. After processing the 855 messages, the word occurrences table consisted of 1,011 words and took 12 Kb.
Motivated by the difficulties in detecting SMS spam using the lexical features only, the authors in [35] proposed an approach to detect SMS spam using lexical and stylistic features. The used stylistic features were the length of SMS message and the average length of words in the message without the non-alphanumeric characters, function word frequencies, part of speech tri-grams, special character frequencies and phrasal category features. They used IG to select different features sizes. Two data sets in two different languages, English and Korean, were used in their work. They achieved the best result with only 250 lexical and stylistic features, regardless of language.
In [38], they filtered SMS spam using features which selected using feature selection methods. Two most common feature selection methods were used in their work namely IG and chi-square (CHI2). The selected features were employed with two different Bayesian-based classifiers. The aim of this work was to develop a real-time mobile application running on the mobile phones with Android operating system. The findings revealed that with a tiny number of features, up to 20 features only, they got around 90% in accuracy. However, by using a tiny number of features spammers may escape filtering process easily. Moreover, some legitimate messages may be forwarded to spam box.
Due to the class imbalanced found in the data sets, the authors in [42] used Gini index (GI) method to select ten features sizes. Neural network trained with the scaled conjugate gradient backpropagation algorithm used as a classifier. The best performance was around to 0.9648 in the AUC with classification time around to six microseconds. These result was with one hundred features. Their model was validated by an extra experiment using 45,243 samples. The result showed that their model blocked 402 messages from the 45,243 samples. Similar work was done by [41] using three soft computing techniques: fuzzy similarity, neural networks and SVM. The best result was obtained using SVM with 150 features.
In [39], the impacts of various feature extraction and feature selection on SMS spam filtering in Turkish and English were analysed. Two classification algorithms, namely k-NN and SVM were employed. CHI2 and GI methods were used to select six features sizes: 1%, 5%, 10%, 20%, 50% and 100% of the entire extracted features. Message length, number of terms obtained using alphanumeric tokenization, uppercase character ratio, non-alphanumeric character ratio, numeric character ratio and URL presence were also used as features in the filtering. Simulation results for English messages showed that the highest Micro-F1 score was around 0.96 with SVM classifier. This value was achieved using the 100% of the extracted features. They found that no particular feature selection method was superior to another because all features were employed to attain the highest score.
Beside the works discussed above, there are different types of filtering and feature representations are available in the literature such as topic modeling [27], Unicode Transformation Format-8 encoding representation [22], personality recognition [14], sentiment polarity identification [4] and signature-based detection [3]. Interested reader may refer to [12] for more details about SMS spams filtering.
3 Feature Selection Background
In text classification, feature selection is often considered an important step in reducing the high dimensionality of the feature space [26]. Feature selection has the ability to capture the salient information by selecting the most important features, and thus making the computing tasks tractable [15, 26, 28, 43]. Furthermore, feature selection tends to reduce the over-training problem therefore helps classifier to perform well when applied to unseen data [33].
In content-based SMS classification, feature selection methods were used to select the important features [16, 35, 38, 39, 41, 42]. In this work, three different feature selection methods were used namely, chi-square (CHI2) [43], Gini index (GI) [34] and information gain (IG) [43].
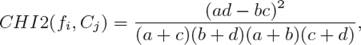
Chi-square method measures the independence between the feature f and the class C [43]. More specifically, it is used to test whether the occurrence of a specific feature f and the occurrence of a specific class C are independent. This method has a nature value of zero if f and C are independent. High scores on CHI2 indicate the occurrence of the feature and class are dependent. Therefore, this feature is selected for the text classification.
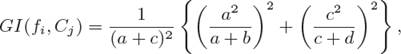
Gini index method measures the purity of attributes towards classification where the larger the value of the purity is, the better the feature is [34]. This method is based on Gini Index theory that was used in the decision tree to search for the best split of attributes [34].
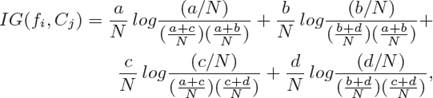
Information gain method measures the effect of the absence or presence of feature f in a document on the number of bits of information obtained for categories C to be predicted [43]. IG reaches its highest value if a feature is present in a message and the message belongs to the respective class.
The equations of these methods for binary classification are given as follow:
 (1)
(1)
 (2)
(2)
 (3)
(3)
where N = a + b + c + d, fi is a feature and Cj is a class. a, b, c and d mean the number of training samples fi and Cj co-occur, Cj occurs without fi, fi occurs without Cj, neither Cj nor fi co-occur, respectively.
4 Support Vector Machines
Numerous content-based classification studies in the literature used different types of models such as the Bayesian variations, C4.5 variations, graph-based model, LBFGS algorithm, neural networks, k-NN and support vector machine (SVM) variations [1, 2, 10, 16, 31, 35, 39, 41, 42], with SVM being one of the most suitable model for SMS classification [1, 2, 10, 16, 39, 41].
SVM is presented by [5] based on early work on statistical learning theory [40]. In two-class classification problem, SVM searches for best hyperplane that can separate the two classes. The best hyperplane is the hyperplane that has maximum marginal hyperplane because it gives largest separation between the two classes thus it is expected to be more generalized [19]. Fig. 1 shows an example of two-class classification problem using SVM.
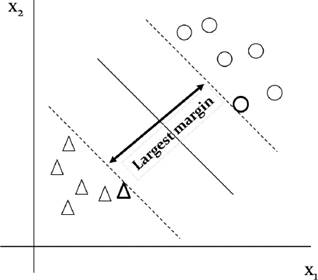
Fig. 1 Support vectors. The samples that lie on the margin, which are encircled with a thicker border, are called support vectors
In this work, we used a linear SVM because most text categorization problems are linearly separable as found by [21]. A brief explanation about C-Support Vector Classification (C-SVC), which used in this work, is explained based on [7] as follows:
Suppose a two-class classification problem is given as follows. Given training vectors xi∈ Rn, i = 1, ..., l, which are associated with class labels y∈Rl, such that yi∈{−1, 1}, C-SVC solves the following dual problem:
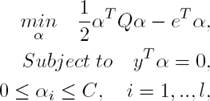 (4)
(4)
where e = [1, ..., 1]T is the vector of all ones, Q is a l by l positive semi-definite matrix, Qij ≡ yiyjK(xi, xj), K(xi, xj) ≡ φ(xi)T φ(xj) is the kernel function, φ(xi) maps xi into a higher-dimensional space, and C > 0 is the regularization parameter.
After solving Eq. 4, using the primal-dual relationship, w is given by:
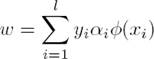 (5)
(5)
and the decision function is:
 (6)
(6)
The needed information such as yiαi∀i, b, support vectors are stored in the model for use in predicting the labels of testing data.
5 Experimental Settings
The steps involved to analyse the relationship between features size and classification performance are shown in Fig. 2. To achieve this analyse we formulate a null hypothesis and an alternative hypothesis for the statistical significance test. These two hypotheses are:
— The null hypothesis (H0): ’the mean difference between the classification performance of different features sizes which were selected by a feature selection method are equal (i.e., statistically insignificant)’.
— The alternative hypothesis (H1): ’there is at least one mean which differs from another mean’.
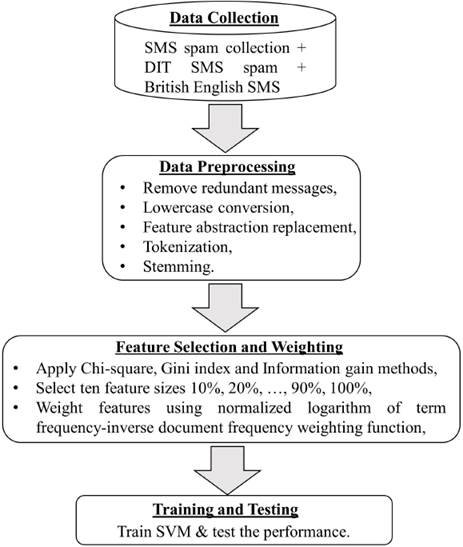
5.1 Data Collection
In this work, three public data sets were collected. These data sets were combined into one collection with 5,277 (67.6%) legitimate messages and 2,525 (32.4%) spam messages as shown in Table 1. A brief discussion about these three data sets is given as follows:
— SMS spam collection1: This data set was obtained from UCI machine learning repository [24]. It contains 5,574 SMS text messages including 4,827 (86.6%) legitimate and 747 (13.4%) spam messages. Legitimate messages were collected from three sources: Jon Stevenson Corpus, Caroline Tagg’s PhD thesis [37] and randomly from NUS SMS Corpus [8], while spam messages were collected from a complaint website called GrumbleText [2, 16].
— DIT SMS spam2: It was collected by [12] from Dublin Institute of Technology (DIT). This data set contains only 1,353 spam messages that were collected from three sources, two from public consumer complaints websites, GrumbleText and WhoCallsMe, and the third source was the spam messages from SMS spam collection.
— British English SMS3: It was collected by [29] and contains 875 SMS text messages including 450 (51.4%) and 425 (48.6%) legitimate and spam messages, respectively. Legitimate messages were collected from Caroline Tagg’s PhD thesis [37], and spam messages were collected from Grumbletext.

5.2 Data Preprocessing
The collected data sets share many of the same sources. Therefore, duplicate messages were removed from the combined data set. Then non-English messages were deleted because spam messages are in English while few legitimate messages are influenced by Singaporean English. We removed the non-English messages by searching for particles such as ”lor” or ”lah” inside the messages [12]. Finally, near duplicates messages that differ only in number digits or currency symbol were removed. Table 2 shows the number of redundant messages which were removed. Notice that after the removal process, the number of legitimate messages in our collection is 4,375 (78%) and for spam messages is 1,235 (22%).

After the redundant messages had been removed, four most common text preprocessing methods were used to reduce the number of extracted features including lowercase conversion, feature abstraction replacement, tokenization and stemming. An example shows the work of these methods is shown in Fig. 3.

Fig. 3 An example of the used text preprocessing methods on SMS text message. The changes in each method are in blue color
As shown in Fig. 3, the lowercase conversion converts all the capital letters in the SMS text message into lower letters. Lowercase conversion groups the features that contain the same information regardless of their case. Thus, it reduces the number of extracted features. Furthermore, we did not find much differences in the classification performance by keeping the upper-case features.
Feature abstraction replacement method replaced some features by unique identifiers to group and represent them semantically rather than lexically. Table 3 shows the used replaced identifiers for feature abstraction replacement method in this work. As shown in Fig. 3, ”$3000000 usd”, ”free@host.com” and ”+111111111111” were converted to MONEY, URL and PHONE identifiers, respectively.

After that, each SMS text message was tokenized into a set of alphabetic and identifiers by punctuation and space. It is good to note that we did not remove stop words since we found it helps in the classification performance.
Finally, the tokenized features were stemmed to their roots using a widely applied stemming algorithm developed by [30]. Stemming helps to avoid treating feature variations as different features, thus reducing the number of extracted features.
5.3 Feature Selection and Weighting
The number of distinct extracted features from the combined data set was 6,455 lexical features plus the eight replaced identifiers. A word cloud of some of these features is shown in Fig. 4. Three feature selection methods, namely chi-square (CHI2), Gini index (GI) and information gain (IG) were used for feature selection step. Each feature selection method was used to select ten features sizes. These ten features sizes were the multiples of 10% till 100% from the feature space. For example, 10% from the 6,463 features is the top-646 features with the highest scores.

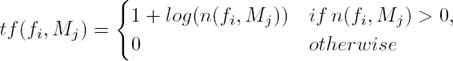
Each SMS text message was represented using vector space model [32]. The vector’s dimensions in this model represent the selected features, and each entry of the vector represents the feature’s weight. The features in this work was weighted using the normalized logarithm of term frequency-inverse document frequency weighting function [26]. This weighting function is given by:
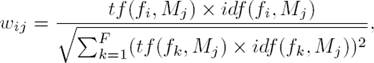 (7)
(7)
 (8)
(8)
 (9)
(9)
in which F is the number of the used features, n(fi, Mj) is the number of occurrences of feature fi in the SMS text message Mj, N is the number of SMS text messages samples and N(fi) represents the number of SMS text messages samples in which feature fi occurs at least once.
This weighting function presents three fundamental assumptions that make it significant. These assumptions are quoted from [44]:
5.4 Training and Testing
All experiments were performed using stratified 10-fold cross validation. Stratified cross validation means that each fold contains roughly the same proportions of the class labels. SVM4 was then trained using the training folds and tested by the test fold.
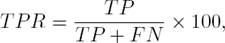
In this work, we used True Positive Rate (TPR) and False Positive Rate (FPR) as a performance measure. It measures the percentage of caught spam messages and the percentage of blocked legitimate messages. This measure was summarized with 95% confidence intervals by Area Under the ROC (Receiver Operating Characteristics) Curve, denoted as AUC. AUC measures classifier’s effectiveness over all possible values of TPR and FPR. Also, AUC is better than accuracy particularly in the case of imbalanced data, which is found in the combined data set, because accuracy provides a strong advantage to the dominant class [20]. TPR and FPR can be given by:
 (10)
(10)
 (11)
(11)
where TP, FP, FN and TN stand for true positive (i.e. the number of correctly predicted spam messages), false positive (i.e. the number of mispredicted legitimate messages), false negative (i.e. the number of mispredicted spam messages) and true negative (i.e. the number of correctly predicted legitimate messages), respectively.
After the performance had been measured, the repeated measures ANalysis Of VAriance (ANOVA) was used to analyse the classification performance significance between the ten features sizes. ANOVA test is a generalization of t-test. Unlike t-test that deals with differences between only two means, ANOVA deals with any number of means to see if the differences between these means are statistically significant [20]. The repeated measures ANOVA at p < 0.05 level followed by post hoc multiple comparisons using Least Significant Difference test was set in this work.
6 Results and Discussions
Based on the used hypotheses and the methodology discussed in Section 5, the experiments were run. Accordingly, the mean AUC for the test folds for each features size for each feature selection method are shown in Table 4. It can be seen from Table 4 that the classification performance using all selected features sizes using IG method were the best as compared with the other methods. The performance using the full features for all methods are same because all the methods used same features. The best AUC performance was around to 0.9705 with 50% of the selected features using IG method (i.e., 3,232 features).
Table 4 The mean AUC performance of different features sizes for all methods
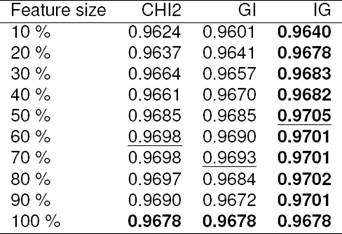
The best result for each features size is in boldface.
The best result for each feature selection method is underlined.
Features similarities between these three methods are shown in Table 5, and we can see that there are some differences in the selected features between the selected methods. We can notice also that CHI2 and IG methods shared many features.

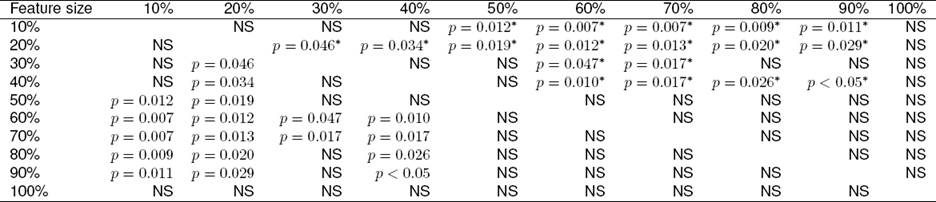
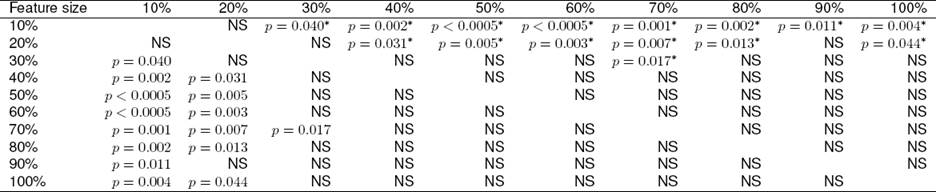
For the statistical test, for each feature selection method the AUC value for the test folds of each features size were fed to the statistical test. The results for all methods reject the null hypothesis and that means there is a significant difference in means. The repeated measures ANOVA with a Greenhouse-Geisser correction determined that AUC mean differed statistically significant within CHI2 features sizes (F(2.573, 23.154) = 6.266, p = 0.004), GI features sizes (F(3.514, 31.625) = 8.095, p < 0.0005) and IG features sizes (F(3.036, 27.328) = 4.139, p = 0.015). Post hoc comparisons between different features sizes for the three methods are shown in Table 6, 7 and 8.
Table 6 Pairwise comparisons between the AUC of different features sizes for CHI2 method
NS means no statistically significant difference.
* means the mean value for the AUC performance for the feature size in the column is greater than the mean value for the AUC performance for the feature size in the row.
Table 7 Pairwise comparisons between the AUC of different features sizes for GI method
NS means no statistically significant difference.
* means the mean value for the AUC performance for the feature size in the column is greater than the mean value for the AUC performance for the feature size in the row.
Table 8 Pairwise comparisons between the AUC of different features sizes for IG method
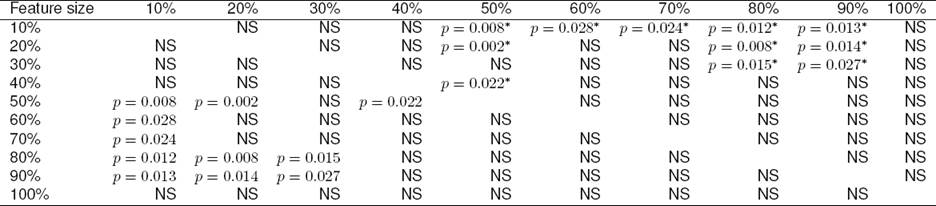
NS means no statistically significant difference.
* means the mean value for the AUC performance for the feature size in the column is greater than the mean value for the AUC performance for the feature size in the row.
In order to make conclusions regarding the performance we summarized the comparison of results found in Table 6, 7 and 8 and represented them in Fig. 5. For each method, we grouped the comparison results for each feature size into three groups.
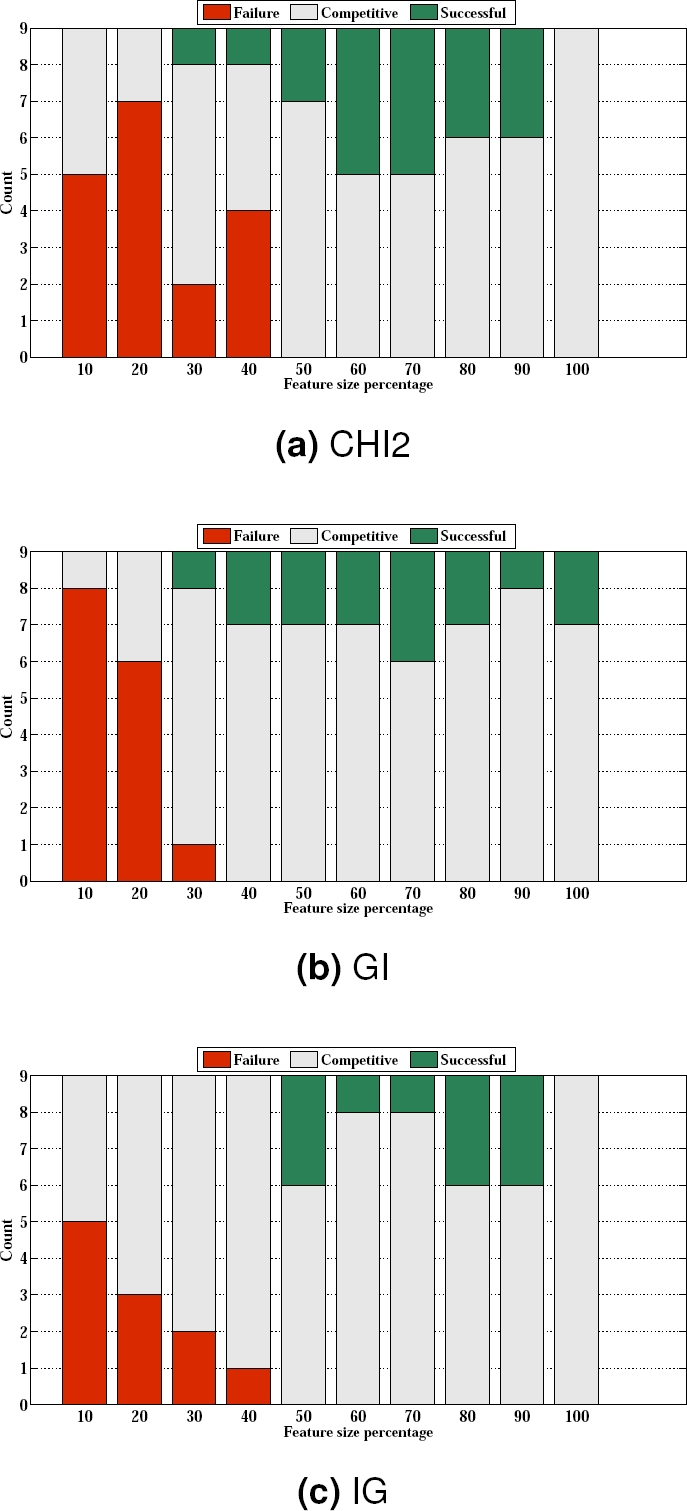
Fig. 5 Pairwise comparisons summary. Successful represents the number of comparison results in which the feature size had significant performance. Failure represents the number of comparison results in which the feature size failed to have significant performance. Competitive means that there is no significant difference in the performance
The first group, which was titled “Successful” represents the number of comparison results in which the feature size has significant performance (i.e., p < 0.05). This group does not include the results with the symbol (*) because it is a negative significance.
In the second group we calculated the number of comparison results with the symbol (*); this group was titled “Failure” .
The final group was titled “Competitive” which was calculated from the insignificant comparisons (i.e., NS). The insignificant comparisons means that there is no significant difference in performance between the two compared features sizes.
The results in all figures in Fig. 5 revealed that there is no features size outperformed all features sizes (i.e., there is no full ”Successful”). Another interesting point that can be concluded from the figures is that features sizes equal to 50% as selected by CHI2 or IG methods can be used to classify SMS effectively, and equal to 40% for GI method. This conclusion is because these features sizes do not have any ”Failure” with any other features sizes.
Furthermore, by looking into Table 6, 7 and 8 we can notice that for theses best features sizes, all cell contents, which greater than these features sizes, are with no significant performance. This means that adding more features greater than these best features sizes do not help to improve the classification performance.
Finally, a t-test was used to see if there is mean significance in the classification performance between IG with 50% features size and GI with 40% features size. This test to select the smallest features size among the feature selection methods. We found that IG with 50% features size has significant performance.
Therefore, the best result obtained in this work is using IG with 50% features size. These result shows that we can classify SMS effectively with some of the extracted features. Thus, it will help reduce the memory usage. Also, the classification time will be reduced automatically because the number of used features in the vector space model is reduced.
The best result obtained in this work as compared with the work in [39] is shown in Table 9. For the best result, they found that no particular feature selection method was superior to another because the best result was with the full feature set. We can see from this table that the used data set in our work is around 6.4 times as their data set size.

Although this bigger data set size, the performance was almost same to their result. As a result of this big data set size, more features were extracted in our work. Therefore, the best features size in our study is 1.2 times greater than that found in [39].
7 Conclusion and Future Work
In this work, we compared the classification performance for SMS using different features sizes. Support vector machine with three feature selection methods namely chi-square, Gini index and information gain were used in the comparison. We used the Area Under the ROC (Receiver Operating Characteristics) Curve between true positive rate and false positive rate to measure the classification performance. The repeated measures ANOVA at p < 0.05 level followed by post hoc multiple comparisons using Least Significant Difference test were used to analyse this classification performance. The results of the work are summarized as follows:
— Information gain method outperformed chi-square and Gini index in all features sizes with the imbalanced short text messages data set.
— Using larger features size does not mean superior performance but sometimes leads to less classification performance. Feature selection methods should be applied to select the best features from the extracted features during training the classifiers.
— Reducing the used features for the classification, without degrading the classification performance, means reducing memory usage and classification time. As a result, it helps to work in real time and with limited resources.
For future work, this work can be further extended by using another classifiers such as naive Bayes or k-NN. Furthermore, using features from Latent Dirichlet Allocation as used in [6] can be considered too.

