


 nova página do texto(beta)
 Inglês (pdf)
 Artigo em XML
 Referências do artigo
 Enviar este artigo por email
 Citado por SciELO
  Similares em
SciELO
Similares em
SciELO 
 Permalink
1 Introduction
The progress of Social Web (Web 2.0) and Semantic Web (Web 3.0) has given rise to a significant amount of data relative to user’s interests (personal, collective, shared, etc.). These data are crucial for different systems (adaptive web, adaptive mobile applications, recommenders, etc.). They serve to return a customized result to the user according to his interests [2]. The success of users’ social networks refers largely to not only their open and decentralized structure but also to the generation of a great number of data. In this context, the problem is that this quantity makes the access to user’s interests more and more difficult mainly after updating and/or enrichment of the user’s profile, which refers basically to the diversity of content that may interest the user. This may produce a cognitive overload problem for the system, which is time consuming in terms of browsing the user’s profile [19].
As a consequence, many reorganization methods of the user’s profile are required in different research studies. Generally, reorganization methods use machine learning algorithms. Recently, the difference between them resides in the fact that these reorganization methods use different similarity measures [21, 10, 23] in order to take into account the semantic relationships between user’s interests.
The user’s interests can be also characterized by their popularity and freshness. In this direction, Mezghani et al. [17] considered temperature as a basic notion resting upon popularity and freshness at the updating of interests in order to keep only pertinent interests for a period of time. However between the periods, the user is getting more or less active according to his needs and affiliations.
Departing from our current life, the popularity and freshness of user’s interest change over time which implies that their links can grow stronger or weaker depending on the users’ needs and their affiliations. Hence, this notion of temperature becomes necessary to reorganize the user’s interests. For this reason, we propose to improve the reconstruction of his profile according to his social relationships as well as his distributed interests. The originality resides in taking into account the notion of temperature with the similarity measure in the learning algorithm.
In the rest of this paper, we first introduce some existing works about updating and reorganizing the user’s profile. Second, we present a new reconstruction approach to improve the enrichment process by reorganizing the user’s interests, and vice versa.Third, we experiment and validate our approach. Finally, we conclude and discuss some future works.
2 Related Work
Nowadays, the user’s profile(s) is (are) characterized by various changes and density. It (They) cannot be considered as stable. Therefore, it is important to improve the appropriate content of the user’s profiles at the moment of their reconstruction. In this section, we present a brief overview about updating and reorganizing approaches followed by a synthesis.
2.1 Updating the User’s Interests
Updating the user’s profile rests on detecting relevant interests according to the user’s need for enrichment in certain systems. Several works in literature applied techniques for the detection of interests based on different types. Three types of detection are distinguished related to the way of introducing the interest in the user’s profile namely: explicit, implicit or hybrid.
In the first type, the user provides his information via a form, a query or/and an annotation. Consequently, his profile building process can suffer from the lack of useful information. Therefore, the provided interests can be incomplete. In order to overcome this limit, different ways are suggested in the implicit type.
In the second type, the best and most popular way is to observe the interaction of the user with the visited resources [11]. Generally, the works are based on the analysis of the user’s browsing behavior (resource business history, time spent on a web page, etc.)[19]. However, with the explicit or the implicit types, the cold start problem may appear. With the emergence of distributed systems in different contexts (social, e-learning, etc.), the hybrid type seems to overcome this problem.
The third type is not only based on the user’s interests existing in his profile, but also on the detection process [16]. For example, in social media, behavior can reflect the user’s interests. This behavior is often described as the ternary annotation relationship between users, resources and tags (< user, tag, resource >). Therefore, interests can be extracted from the user’s annotation behavior [15]. Other studies showed that the user’s interests can be detected from his profiles situated in such different systems as e-learning [6]. On the other side, interests can be extracted from the educational resources visited by the user (learner).
Three techniques of the user’s profile detection are distinguished. These techniques allow the validation of the relevance of the selected interests (based on one of the described types) for enrichment.
The first studies used the vector space model that consists in extracting and adding the keywords relative to such user’s queries or tags as user’s interests. However, it is likely that the system enriches the user’s profile with redundancy, ambiguity, sparsity and lack of semantics. In order to resolve this problem, other studies proposed the knowledge based technique.
The second studies considered the semantic relationship between the interest and the external semantic dictionaries such as word-net. Generally, these dictionaries provide a restrictive set of words and concepts. Thus, the new used concepts and words that do not exist in the dictionary are not considered for the enrichment. For this reason, the context based technique appears to overcome this limit.
The third technique is based not only on semantic dictionary, but also on other knowledge resources such as the interests relative to: (1) the user’s closest friends in social networks and (2) the user’s profiles existing in different systems. In our work, we are basically interested in the context based technique. In social networks, the latter is mainly based on the co-occurrence method which means that two tags (reflecting the user’s interests) are used to describe the same resource or two tags are used by the same user. Some authors in [16, 10] asserted that this method weakens the semantic relationship of tags and brings semantic noise. Authors in [16] proposed to use the external semantic dictionary in addition to the tag co-occurrence. Besides, they kept certain interests of the user’s profile relative to a specific period of time through the concept of “temperature” that has been dealt within [13]. Recently, authors in [10] have looked for a better tag co-occurrence that maintains perfectly the tag semantic relationship. They proposed the common co-occurrence group similarity approach which is based on the ternary relation between users, resources and tags. To detect the user’s interests based on other user’s profiles existing in different systems, the context-based technique is based mainly on the mapping rules generated by a matching process[14, 6].
2.2 Reorganization of the User’s Profile
With frequent updating (detection and enrichment of user’s interests), the user’s profile evolves over time. Therefore, its content may vary between relevant and irrelevant. This may produce a cognitive overload problem for the system [19]. As a consequence, the reorganization of the user’s profile (which can also be based on the detection techniques and types) is required to reduce its overloading. In this context, the research works distinguish three groups of methods that use the machine learning techniques [22] which can be supervised, semi-supervised or unsupervised. The supervised and the semi-supervised techniques help classify an unlabeled data set based on a labeled one. In this case, the number of clusters is predefined. The unsupervised learning technique enables the classification of unlabeled data set into clusters. In this case, the number of classes is unknown.
The first group of methods consists in classifying the new interest which needs to be added. These methods are based on the supervised KNearest Neighbors (KNN) algorithm[18, 3]. They provide the user’s profile with a content that consists of semantically-similar interests uniquely. As a matter of fact, the profile has only very close interests.
The second group of methods consists in classifying the already existing interests in order to remove the irrelevant ones. For example, authors in [19] proposed a new version of the semi-supervised Co-Training algorithm in order to remove the irrelevant interests from the user’s profile. These two first methods use the supervised or semi-supervised learning technique depending on the manual labeling in order to generate a prediction model.
The third group of methods emerges in order to resolve the problem of the manual labeling identified in the two first groups. These methods use the unsupervised learning technique. They consist in dividing the user’s interests into clusters and separate the ones containing irrelevant interests (or tags) that are ambiguous and redundant [10, 23, 21]. Authors in [10] proposed a new method to measure the tag similarity based on the common co-occurrence group. After that, they used the unsupervised K-Means clustering algorithm to aggregate the tags. Authors in [23] proposed a new tag clustering algorithm based on the unsupervised KNN algorithm. Authors in [21] used keyword clusters with a weighted graph in order to construct the user’s interests at a rather fine granularity level.
2.3 Synthesis
Based on the analysis of some research studies related respectively to the updating or reorganization of the structure and content of user’s profile, its reconstruction is discussed.
It should be noted that the updating can be carried out in two main ways. On the one hand, the user’s profile can be updated from the same user’s distributed profiles [19, 14, 6]. On the other hand, it can be updated from the social networks [16, 10] such as, communities, consisting of users who share common social criteria, and egocentric network formed by the user’s closest friends. In addition, some studies update the user’s profile by keeping some interests relative to a specific period of time [16] or by deleting the outdated interests based on a machine learning algorithm [19]. These studies can feed a user’s profile with relevant interests in terms of ambiguity and redundancy.
However, with the challenge of distributed systems and social networks, two observations may be formulated. On the one hand, the user’s interests can be semantically dependent from one system to another regardless of time. On the other hand, in the same user’s profile, the interests can be semantically independent and they can be unstructured. In this case, the adaptive system browse the entire profile. For this reason, we propose (1) to update the user’s profile based at the same time on his distributed and social profiles and (2) to reorganize his unstructured interests by keeping the outdated ones based on the notion of temperature and the machine learning algorithm.
3 Overview of the Proposed Approach
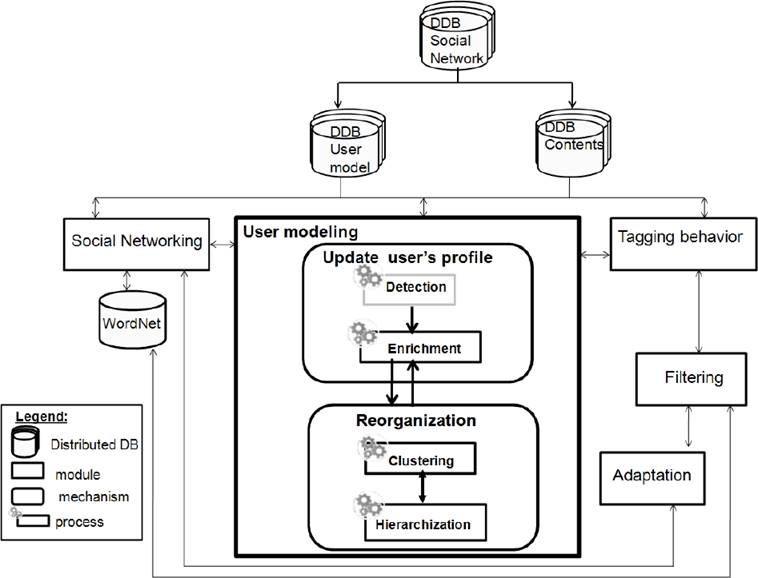
The original motivation is to extend the architecture proposed in [16]. This architecture is illustrated in Figure 1. In this paper, we attempt to extend the module of user modeling. This extension consists in improving the updating mechanism and adding the reorganization mechanism. These two mechanisms are illustrated in Figure 1 with a bold stroke. The updating mechanism is based on two dependent processes: detection and enrichment. The reorganization mechanism is based on two processes : clustering and hierarchization.
3.1 Updating Mechanism
Mezghani et al. [16] proposed an approach of detecting social interests which is based on analyzing the tagging behavior of each user. As mentioned above, each user can have at the same time a social relation with others and uses different distributed systems. Consequently, a user can have many profiles. Each profile may complete the other one.
In our work, we applied the approach of detecting social interests on distributed user’s profiles (See Figure1). Thus, we use the following Distributed Data Bases (DDB): i) the DDB social network which contains data about resources and users ; ii) the DDB user model which uses from the DDB social network some information about users and networks of users (interests, preferences, friends, etc.) and iii) the DDB Contents store information about the resources of the social network (type of resource, tags associated by each user, metadata, etc.). The user’s interest detection is part of the modeling module. The latter is based on the distributed user’s tags reflecting his interests. It combines the tag, user and resource in a way that guarantees a relevant interests detection. The detection process is related to some modules.
The most important modules are in direct relation with user modeling module : i) Social networking module which allows the identification of similar users with a similar tagging behavior. Based on social relationships, it is able to send information such as most popular users, friends, etc. to the adaptation module. As a matter of fact, the user’s neighbours are extracted from Social networking module and ii) Tagging behavior module which contains data about the users who tag the resources of various types (e.g. photos, scientific papers, etc.). Generally, this activity is represented by the ternary annotation relationship < user, tag, resource >.
Relying on [16], the validation in the detection process is based uniquely on one of the two following methods: either by the exact comparison between interests or by referring to external dictionary Wordnet1. This validation is used for enrichment.
3.2 Reorganization Mechanism
In our approach, the notion of validation is invested in not only the updating mechanism but also in the reorganization mechanism. The validation as far as reorganization is concerned, is based on comparison method resting in turn on two factors : temperature and semantic similarity.
Our proposed reorganization mechanism aims to organize the user’s interests in order to improve their updating. It allows the clustering and Hierarchization of user’s interests via two processes detailed respectively by a scenario and an algorithm. The latter is named the Hierarchical-based Temperature and Semantic K-Means algorithm (HTS k-Means).
3.2.1 Temperature Factor
In order to update the user’s interests, authors in [17] apply the temperature factor which is related to two main sub-factors : Freshness and Popularity. We note that the concept of this factor can be useful also for the reorganization mechanism.
Since in our work we used Distributed Data Bases (DDB) in distributed systems, we denote by S={s 1, ..., s k , ..., s n } the system set. Each system s k contains for each user a unique profile. The latter includes a set of interests denoted by I={i 1, ..., i a , .., i m }. Each interest (i a ) in s k is represented by three elements: a word, its Freshness (F(i a (s k ))) and its Popularity (P(i a (s k ))). These elements are determined by the social networking module. An interest (i a ) may exist in a sub-set of S namely S +.
The freshness of an interest (i a ) is the maximum of its Freshness in S +, see equation 1:
 (1)
(1)
The popularity of an interest (i a ) is the average of its Popularity in S +, see equation 2:
 (2)
(2)
3.2.2 Semantic Similarity Factor
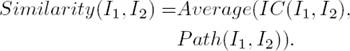
The semantic similarity factor is the value related to the similarity degree between two interests. It is calculated based on different similarity measures. In literature, there are two semantic-based similarity types (for words or texts) which are knowledge and corpus similarity [1, 12].
This work [12] assumed that knowledge-based similarity measures provide a gain of time by giving measure results compared to the corpus-based ones. For this reason, we are basically interested in this type which can be divided into two groups; the information content (IC) and the path length (Path) measures. There are three measures of information content: Resnik (res), Lin (lin) and Jiang and Conrath (jcn) and three path length measures: Leacock & Chodorow (lch), Wu and Palmer (wup) and Path Length (path).
Based on the identified types, several methods of similarity measurement emerged. Some methods consist in using one similarity measure relative to one type. Other methods consist in confirming the similarity degree by the average of two or more similarity measures relative to one or more types [1, 14].
Inspired by basic principles of the last methods [1, 14], we measure the similarity between two interests through the combination of the IC and Path measures based on equation 3:
 (3)
(3)
Equations 4 and 5 represent respectively the average of the similarity values between all the IC (res, lin and jcn) measure values and all the Path (lch, wup and path) measure values:
 (4)
(4)
 (5)
(5)
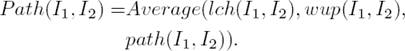
4 Clustering Process
In order to better explain the clustering process, firstly the initial part of the Hierarchical-based Temperature and Semantic K-Means (HTS K-Means) algorithm is identified. Secondly, a scenario of its execution with real user’s interests is presented.
4.1 Algorithm of Clustering Process
The clustering process consists in applying the unsupervised k-Means learning algorithm for creating clusters and their relative sub-clusters. The algorithm of the clustering process constitutes the first part of the “HTS K-Means” algorithm. This part is represented by a diagram in Figure 2.
Our proposed algorithm takes as input the Interest set denoted “I” (See sub-section 3.2.1), “kc” which stands for the number of clusters, “ksc” which corresponds to the number of sub-clusters, “nbIteration” which stands for the number of iterations, and the distance “factor” which is initialized by “semantic”.
In the first step, the algorithm starts by applying k-means algorithm. The k-Means algorithm randomly selects, from the interest set, kc initial centroids relative to the clusters. In each iteration, interests which are assigned to each cluster are very close to its centroid. Then, it selects the new centroid of each cluster and reconstructs the clusters. Therefore, after nbIterations, kc clusters containing interests which are semantically very close are generated.
In the second step, for each generated cluster, the algorithm applies again the K-Means algorithm with the temperature factor in order to generate ksc sub-clusters.
4.2 Scenario of Clustering Process
In Figure 3, an example of clustering scenario is displayed. It is based on two steps.

The first step consists in dividing the user’s interests into clusters based on the semantic similarity factor (See equation 3). Each cluster is represented by an oval chart with a continuous line. For instance, the interests such as literature, dictionary, poetry, article, novel, book, etc. are included in the same cluster.
In the second step, each cluster is divided into sub-clusters based on the temperature factor (F and P values). Each sub-cluster is represented by an oval chart with a dotted line. For example, the interests such as literature, dictionary, poetry, which have close popularity values (0.32-0.62) and the same freshness values (0.9) are included in the same sub-cluster.
5 Hierarchization Process
The hierarchization process enables us to represent the clusters with their respective sub-clusters in hierarchy. In order to clarify the hierarchization process, firstly we present the second part of the HTS K-Means algorithm. Secondly, we introduce a scenario of its execution according to the result of the clustering process.
5.1 Algorithm of Hierarchization Process
This algorithm constitutes the second part of HTS k-Means algorithm. It is presented by a diagram in Figure 4.
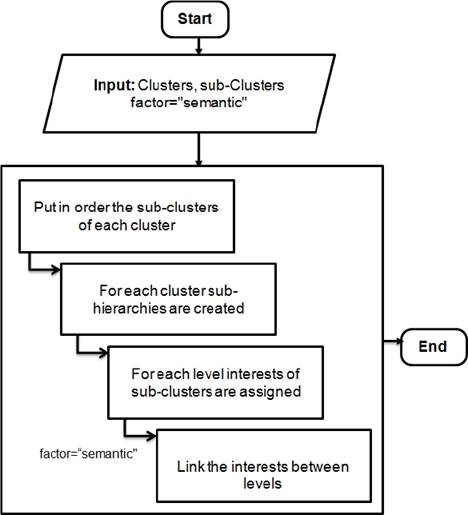
This algorithm takes as input clusters and their relative sub-clusters. First, it puts in order for each cluster its sub-clusters beginning with the ones that have interests with the highest freshness and popularity values. Second, it generates the hierarchy by adding the interests relative to each cluster into a sub-hierarchy as follows: the first level is composed of the interest of the first sub-cluster, the other levels are composed of interests relative to the other sub-clusters and each interest is assigned to its direct parent based on comparison through the semantic similarity factor.
The output of this algorithm is a semantic RDF tree that contains the interest hierarchy constituted by sub-hierarchies.
5.2 Scenario of Hierarchization Process
This scenario represents the hierarchy which is generated based on clusters and sub-clusters illustrated in Figure 3. The root of this hierarchy represents all interests. The number of nodes in the first level of the hierarchy is equal to the number of clusters generated in the first step of the clustering process. Each cluster is represented by a sub-hierarchy. The number of levels in each sub-hierarchy depends on the number of sub-clusters.
In the first level, each node is related to a sub-cluster which has the highest F and P values. For example, Figure 5 highlights in the first level the sub-cluster related to the first cluster that contains the interest “article” having the highest values of F equal to “0.9” and P equal to “0.9”. Similarly, in the descendant level of each sub-hierarchy, we find nodes relative to a sub-cluster (belonging to the same cluster), but having F and P lower than the sub-cluster of the previous level.

In the second level of the first sub-hierarchy, we find for example the sub-cluster that contains the interests “Poetry”, “Literature”, “Dictionary”, etc. having F equal to “0.9” and P between “0.32-0.62” lower than the values of the first sub-cluster. The levels in each sub-hierarchy are related by the most semantically related interests (“Literature” is the closest semantically to “Roman” and “Book” compared to “Dictionary” and “Poetry” ).
6 Evaluation
In this section, our approach for users’ interest reconstruction is evaluated based on Distributed Data Bases (DDB) and particularly DDB user model. First, DDB user model and metrics used for the evaluation are respectively described. Then, the obtained results are displayed.
6.1 DDB User Model
Compared to [16], we added another database in order to take into account the principle of DDB. DDB user model is composed of two databases, each of which contains a set of users’ profiles.
The first database contains users’ profiles relative to the social network Delicious2. Each profile contains updated interests based on the approach proposed in [16]. The user’s interests in delicious may be related to educational and scientific resources.
The second database contains learner’s profiles relative to the social-learning system Moodle3. A learner’s profile contains learner’s interests that are explicitly provided by the learners themselves or implicitly based on domains of the learned courses, lessons and activities.
These domains (mathematic, technology, geology, etc.) may be dependent on domains of resources in Delicious. Thus, the learner’s interests in Moodle may complete the user’s interest in Delicious and vice versa.
In this evaluation, we tried to apply our approach of interest reconstruction by merging each user’s interests in Delicious with the interests of a learner which are selected randomly from Moodle database. Note that each interest in each database is described in terms of its value (word), freshness (F) and popularity (P).
6.2 Metrics
We evaluated our proposed approach for reorganizing the interests of 20 users. As previously described, our approach is based on the HTS K-Means algorithm in order to divide: (1) the user’s interests into Kc clusters based on the semantic factor and (2) the interests relative to each generated cluster into Ksc sub-clusters based on the temperature factor.
For this reason, we selected two well-known evaluation metrics to assess the clustering result: the Silhouette coefficient [8] and the Dunn Index [4]. After clustering and sub-clustering steps, HTS K-Means creates the user’s interest hierarchy (RDF document) which is composed of sub-hierarchies that are evaluated resting on human judgment.
The silhouette is computed for an individual point, interest in our case, in a cluster following three main steps. The first, for the i th interest, consists in calculating its average distance compared to all other interests in its cluster. This value is called a i . Second, for the i th interest and any cluster which doesn’t contain this interest, the interest average distance is calculated in the given cluster. Then, the minimum value is found with respect to all clusters. This value is called b i . Third, for the i th interest, the silhouette coefficient is (b i - a i )/max(b i ; a i ). The value of the silhouette may vary between -1 and 1. Therefore, a negative value is undesirable because it corresponds to a case in which a i , the average distance to interests in the cluster, is greater than b i the minimum average distance to interests in another cluster. It is expected that the silhouette coefficient is positive, and a i is close to 0 as much as possible, since the coefficient assumes its maximum value of 1 when a i =0. The average silhouette coefficient of a cluster is computed by simply taking the average of the silhouette coefficients of interests belonging to the cluster. An overall measure of the relevance of clustering can be obtained by computing the average silhouette coefficient of all interests.
The Dunn Index is introduced in order to recognize the well-separated and dense cluster. Let us denote by d min the minimal distance between the interests of different clusters and d max the largest distance within-clusters. The Dunn Index is the ratio of d min to d max . If a data set contains well separated clusters, the distance between the clusters d min is generally large and d max of the clusters are expected to be small. Therefore, a larger value means better clustering result.
6.3 Evaluation of the Clustering Process
As mentioned in section 4, the clustering process takes place in two steps which correspond to the first part of HTS K-Means algorithm. These steps are evaluated as follows.
For the first step, we measured the average of the silhouette coefficient values for each user’s generated clusters based on the semantic similarity factor. These values are illustrated in Figure 6. The results indicate a clear improvement in the silhouette values based on the semantic factor compared to the results based only on the Information content similarity measure. For example, the silhouette value for user 147 increased from “0.69” to “0.75”. Based on all values presented in Figure 6, the average of the silhouette values rose from “67%” to “70%”.
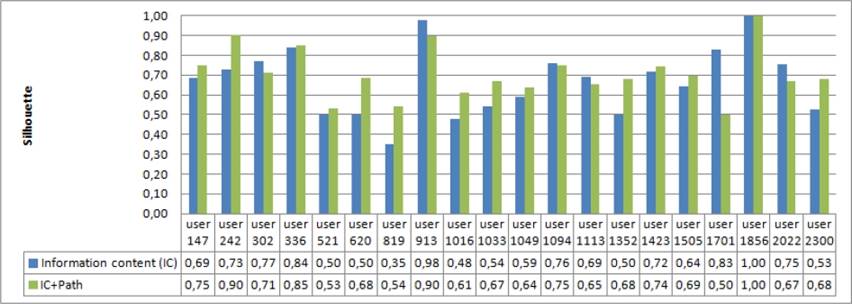
Fig. 6 The silhouette coefficient comparison values with Information Content and the semantic similarity factor
For the second step, we measured the average of the silhouette coefficient values for each user’s generated sub-clusters based on the temperature factor or one of its sub-factors : Freshness or Popularity. Figure 7 displays the generated results. This figure exhibits a significant result improvement. In fact, the average of the silhouette values for all users increased from “0.60” with Freshness or Popularity and reached “0.75” with temperature factor.

After evaluating the first and the second step of the clustering process, we measured the average of the silhouette and the Dunn Index values for each user generated clusters and sub-clusters. In this evaluation, we applied first the simple K-means which is based on Euclidean distance between interests in the clustering and sub-clustering steps. Second, we applied our proposed HTS K-means algorithm which is based on semantic and temperature factors.
Figure 8 shows a clear improvement in the silhouette values for all users. Indeed, the average increased from “54%” to “75%”.
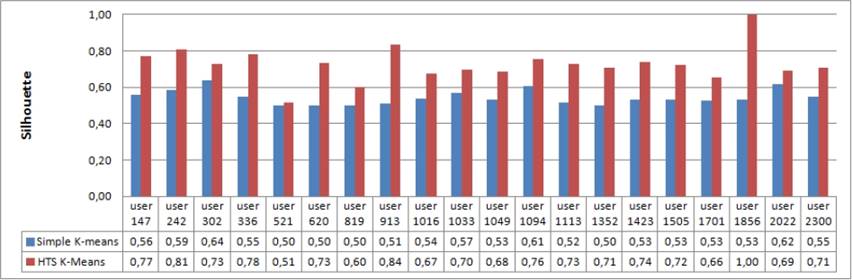
Fig. 8 The silhouette coefficient comparison values with simple k-Means and our proposed HTS k-Means
Moreover, the Dunn Index values show a clear improvement in Figure 9. We record an average of “0.97” for simple K-Means and “1.09” for our proposed HTS K-Means.
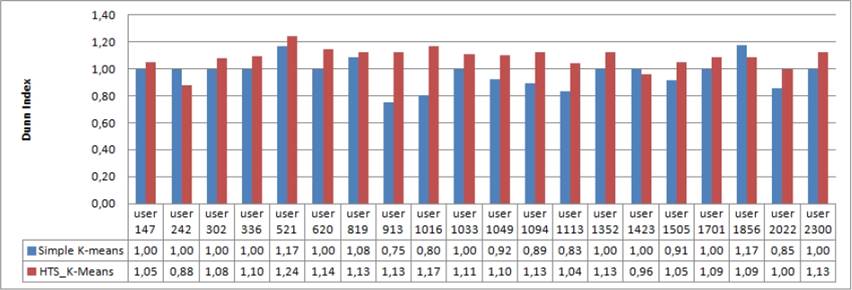
These results refer to the fact that user’s interests can not be regarded as semantically separate or distant in the temperature factor. In fact, with the Euclidean distance we can not have more accurate clusters and sub-clusters. However, taking into account the semantic factor in addition to the temperature factor participates largely in the improvement of clustering and sub-clustering results.
6.4 Evaluation of the Hierarchization Process
We attempted to evaluate the created hierarchy of each user on the basis of human judgment. An interest hierarchy is composed of a set of sub-hierarchies. For each level of a sub-hierarchy, the semantic and temperature relationships between interests are considered for assessing the quality of organization in the current level according to the interests of the other levels. Consequently, three sub-hierarchy quality grades are extracted: high, medium and low.
Table 1 presents the evaluation result related to each user. We note for each level the percentage with respect to the total created sub-hierarchies for each user.
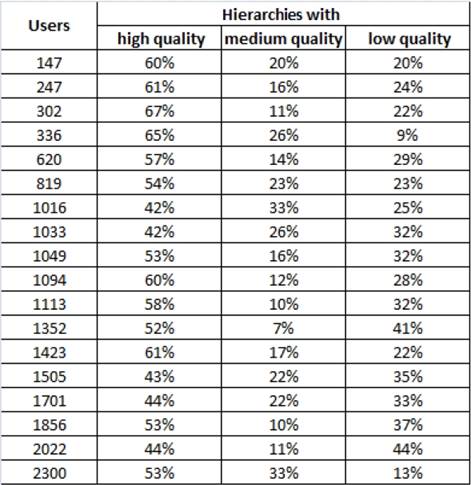
For example, for user 147, there are “60%” of sub-hierarchies with high quality, “20%” are with medium level and “20%” are with low level.
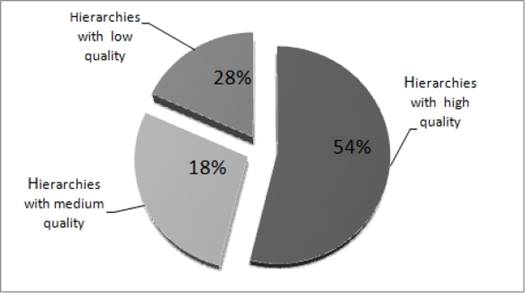
Based on these evaluation values, we record the percentage average value for each quality grade, relative to all users’ interest created hierarchies.
Figure 10 shows that “54%” of the total users’ interests hierarchies have high quality, “18%” have medium quality and “28%” have low quality.
7 Conclusion
In this paper, we are basically interested in a new approach based on updating and reorganizing the social and distributed user’s interests. We have proposed reorganization mechanism which depends on updating the user’s interest mechanism. This reorganization mechanism relies on the clustering and the hierarchical processes for reconstructing the user’s interests.
We have proposed the Hierarchical-based Temperature and Semantic K-Means “HTS k-Means” algorithm. First, HTS K-Means constructs “Kc” clusters based on “k-means” algorithm with the semantic factor. Then, it constructs for each cluster its Ksc sub-clusters based on the temperature factor. Afterwards, HTS K-Means puts in order for each cluster its sub-clusters beginning with the ones that have the highest interest freshness and interest popularity values. Finally, it generates the hierarchy by adding the interests relative to each cluster into a sub-hierarchy.
We have experimented our approach through Moodle and Delicious social databases. We have calculated the Silhouette and the Dunn Index values in order to assess the clustering results. Moreover, we have evaluated the generated hierarchies based on human judgment. The generated result shows the effectiveness and the performance of our approach.
The present research opens new horizons and offers different prospects for future works.
First, we would suggest to enhance the generated hierarchy by i) conducting a step for preprocessing the user’s interests [7] and ii) using other similarity measures such as “soft cosine measure” [20].
Second, we aspire to invest the result of our approach in the adaptive module. This module has to select the most pertinent interests in the hierarchy so as to return results which respond to the user’s needs. As a matter of fact, additional research is needed to fix an adaptive threshold relative to the level of the interests hierarchy for each user.
Third, we would suggest adding some experiments so as to assess if our proposed approach really improves the adaptive module. For instance, the evaluation of time needed for browsing the user’s interests and the obtained results by the adaptive module.
Finally, we would judge it interesting to enhance our reorganization mechanism through introducing an additional factor besides semantic as well as temperature factors. This factor allows the identification of the most reliable user’s profiles in DDB user model. In fact, a user’s profile may contain interests with conflicts (erroneous, duplicated, out-of-date, ambiguous...). Hence, it can be considered non-reliable. The problem of conflict resolution is still critical in different fields (social, education, etc.) [5, 9].

